 "
"
Team:UIUC Illinois/Project/Results
From 2013.igem.org
(Difference between revisions)
Bwilhelmsen (Talk | contribs) |
Ashleysmoy (Talk | contribs) |
||
| Line 41: | Line 41: | ||
<ul> | <ul> | ||
<li style="margin-bottom:20px;"><a href="https://2013.igem.org/Team:UIUC_Illinois/Project/Overview">Overview</a></li> | <li style="margin-bottom:20px;"><a href="https://2013.igem.org/Team:UIUC_Illinois/Project/Overview">Overview</a></li> | ||
| - | <li style="margin-bottom:20px;"><a href="https://2013.igem.org/Team:UIUC_Illinois/Project/Background_Info">Background | + | <li style="margin-bottom:20px;"><a href="https://2013.igem.org/Team:UIUC_Illinois/Project/Background_Info">Background</a></li> |
<li style="margin-bottom:20px;"><a href="https://2013.igem.org/Team:UIUC_Illinois/Project/Design">Design</a></li> | <li style="margin-bottom:20px;"><a href="https://2013.igem.org/Team:UIUC_Illinois/Project/Design">Design</a></li> | ||
<li style="margin-bottom:20px;"><a href="https://2013.igem.org/Team:UIUC_Illinois/Project/Parts">Parts</a></li> | <li style="margin-bottom:20px;"><a href="https://2013.igem.org/Team:UIUC_Illinois/Project/Parts">Parts</a></li> | ||
Revision as of 03:04, 28 September 2013
Contact Us


This was done by retrieving the cytoplasmic extract of our cells after induction of our CDH plasmid. This extract now containing the enzyme was analyzed for absorbance at 340 nm to watch NADH accumulation after adding either L-carnitine supspended in HEPES or HEPES alone. A spectrophotometer is able to give you this reading because NADH has specific absorbance wavelength that can be measured.
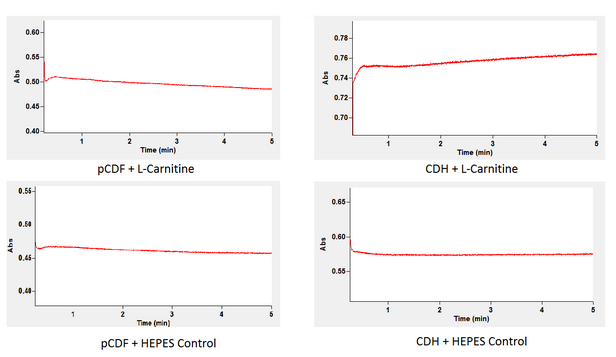
By comparing the two graphs you can see that in comparison to the background accumulation of NADH that our cytoplasmic extract from the cell containing our genes accumulation of NADH is much greater. This indicates that our genes have created the correct enzyme since once L-carnitine is added the NADH level increases indicating that our intended reaction is proceeding. As depicted above the cytoplasmic extract from cells with the backbone alone did not generate an increase of NADH. This indicates that when L-carnitine was added to the cytoplasmic extract of the bacteria containing our gene the NADH concentration increased thus proving our desired enzyme is being produced and functioning as predicted.
Uptake
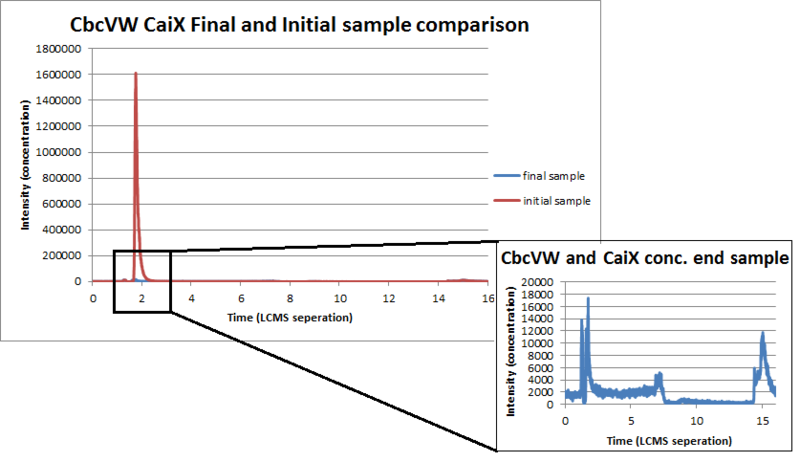
As you may recall the uptake system depends on two genes. CbcVW is a memebrane complex that allows L-carnitine to be shuttled through the membrane. CaiX is a free floating protein and directs the L-carnitine to our membrane protein thus helping the uptake of l-carnitine. We desired to measure the uptake of L-carnitine with Liquid Chromatography Mass Spectrometer. We will use this device by measuring the concentration of L-carnitine in the supernatant initially and finally. We prepared sample of Nissle with our genes and just with our backbone. Then we took samples of the supernatant initially and finally. By comparing L-carnitine concentrations before and after the amount of L-carnitine that was uptaken will be visible.
By looking at the graphs below you can see that our concentration of L-carnitine finally is drastically lower than the concentration of L-carnitine initially.

 It can also be seen that the bear backbone does not affect the concentration of l-carntine because initially and finally the concentration of l-carnitine is virtually identical.

 Conclusively it can be seen by this final overlaid graph of L-carnitine with our gene insert, that the concentration of L-carnitine in the supernatant drastically decreases over time. This indicates that our transporter are indeed accelerating the amount of L-carnitine that is it uptakes.
Home
About
Project
Achievements
Human Practices
Safety
Breakdown
As you may recall CDHcab is responsible for the breakdown of L-carnitine down our alternative pathway. We tested the function and production of cdh using a kinetic spectrophotometric analysis of NADH. As shown in the following reaction NADH is a product of when this enzyme converts L-carnitine into 3-dehydrocarnitine. Thus we can conclude whether or not our enzyme is working based on the levels of NADH accumulation after adding L-carnitine to a cytoplasmic extract containing our cdh enzyme.

This was done by retrieving the cytoplasmic extract of our cells after induction of our CDH plasmid. This extract now containing the enzyme was analyzed for absorbance at 340 nm to watch NADH accumulation after adding either L-carnitine supspended in HEPES or HEPES alone. A spectrophotometer is able to give you this reading because NADH has specific absorbance wavelength that can be measured.
By comparing the two graphs you can see that in comparison to the background accumulation of NADH that our cytoplasmic extract from the cell containing our genes accumulation of NADH is much greater. This indicates that our genes have created the correct enzyme since once L-carnitine is added the NADH level increases indicating that our intended reaction is proceeding. As depicted above the cytoplasmic extract from cells with the backbone alone did not generate an increase of NADH. This indicates that when L-carnitine was added to the cytoplasmic extract of the bacteria containing our gene the NADH concentration increased thus proving our desired enzyme is being produced and functioning as predicted.

Uptake
As you may recall the uptake system depends on two genes. CbcVW is a memebrane complex that allows L-carnitine to be shuttled through the membrane. CaiX is a free floating protein and directs the L-carnitine to our membrane protein thus helping the uptake of l-carnitine. We desired to measure the uptake of L-carnitine with Liquid Chromatography Mass Spectrometer. We will use this device by measuring the concentration of L-carnitine in the supernatant initially and finally. We prepared sample of Nissle with our genes and just with our backbone. Then we took samples of the supernatant initially and finally. By comparing L-carnitine concentrations before and after the amount of L-carnitine that was uptaken will be visible.
By looking at the graphs below you can see that our concentration of L-carnitine finally is drastically lower than the concentration of L-carnitine initially.
It can also be seen that the bear backbone does not affect the concentration of l-carntine because initially and finally the concentration of l-carnitine is virtually identical.
Conclusively it can be seen by this final overlaid graph of L-carnitine with our gene insert, that the concentration of L-carnitine in the supernatant drastically decreases over time. This indicates that our transporter are indeed accelerating the amount of L-carnitine that is it uptakes.