 "
"
Team:XMU Software
From 2013.igem.org
| Line 1,221: | Line 1,221: | ||
<div id="brickdemo_m3"> | <div id="brickdemo_m3"> | ||
Reading the Brick-Worker's source code, | Reading the Brick-Worker's source code, | ||
| - | please click here: <a href="https://static.igem.org/mediawiki/2013/d/d5/Xmu_software_ttt_Brick_Worker.pdf" target="_blank"> | + | please click here: <a href="https://static.igem.org/mediawiki/2013/d/d5/Xmu_software_ttt_Brick_Worker.pdf" target="_blank">Tutorial of Brick Worker</a> |
</div> | </div> | ||
<div id="brickdemo_m4"> | <div id="brickdemo_m4"> | ||
| Line 1,258: | Line 1,258: | ||
<h1>Future work</h1> | <h1>Future work</h1> | ||
| - | <p>1.Click here to learn how to use E' NOTE: <a href="https://static.igem.org/mediawiki/2013/9/9b/XMU_SOFTWARE_TTT_E_note.pdf" target="_blank"> | + | <p>1.Click here to learn how to use E' NOTE: <a href="https://static.igem.org/mediawiki/2013/9/9b/XMU_SOFTWARE_TTT_E_note.pdf" target="_blank">Tutorial of E' note</a></p> |
<p>2.Reading some example of E' NOTE, please click here: <a href="https://static.igem.org/mediawiki/2013/6/6a/Xmu_software_ttt_Enote_example.pdf" target="_blank">Quick Start Guide</a></p> | <p>2.Reading some example of E' NOTE, please click here: <a href="https://static.igem.org/mediawiki/2013/6/6a/Xmu_software_ttt_Enote_example.pdf" target="_blank">Quick Start Guide</a></p> | ||
</br></br></br></br></br></br></br></br> | </br></br></br></br></br></br></br></br> | ||
Revision as of 03:28, 28 September 2013
<!DOCTYPE HTML>


XMU Software 2013 team consists of 11 team members, 2 instructors and 3 advisors. This extraordinarily energetic and creative team is tightly connected by trust, collaboration and affection among its members. Learn more about our team on the Team page.
Our project includes 2 independent software tools - the Brick Worker and the E' NOTE. The former is a software suit for the evaluation and optimization of biobricks, i.e., promoter, RBS, protein coding sequences and terminator. E' NOTE is a web application serveing as an assistant for experiments. Its useful functions such as experiments recording and experimental template customization make experimental process easier and more enjoyable. To learn more about our project, please visit the Project page.
See more about XMU Software 2013 safety form on the Safety form page.
XMU Software 2013 has hosted a series of activities aiming at facilitating communication and collaboration among iGEM teams, propagating iGEM competition as well as promoting the development of synthetic biology. And these efforts are well paid off and have received satisfying feedback. More information is available at the Outreach page.
See more about XMU Software 2013 notebook on the Notebook page.


Dr. Baishan Fang is the professor in College of Chemistry & Chemical Engineering at Xiamen University. In the group of biocatalysis and biotransformation, his research mainly focuses on synthetic biology, mining and the transformation of the enzyme, construction of bio-molecular machines, the application of new biocatalysts. His major role of XMU iGEM team is to mentor for all and to enlighten the members.

Dr. I-Son Ng is the associate professor in College of Chemistry & Chemical Engineering at Xiamen University. Her research interests are biofuel, engineering of enzyme and protein, zymology, genetic engineering, biochemical separation procedures and proteomics. Her role for the project is to provide suggestions and instruments.

It is great for a team to have an omniscient advisor, even better an inspiring one. Ruosang Qiu , our beloved advisor, definitely is offering both. Her hard work as well as undoubted adorable personality is the motivation of our team members' efforts, her clear mind combined with provident planning lays the foundation of our successful project, To quote her words: I' was a happy iGEMer in 2012, I'm going to make you all happy iGEMers in 2013.

The past three years have seen his tremendous dedication to iGEM, Xin Wu, a passionate team member in XMU China 2011, a devoted team leader in XMU China 2012 and now, an invaluable advisor in XMU Software 2013. Had it not been Xin Wu's constant encouragement and guidance, we,the inexperienced iGEMers might have been faint-hearted and failed to face up to the challenges during the process. It is drawing on his expertise in synthetic biology and proficiency in iGEM competition that we have solved the seemingly unsolvable and conquered the seemingly unconquerable.
Youbin Mo is one of the great advisors of XMU software team in 2013. As a computational biophysicist, y, he is an unquestionable master of biological model and computer programming. In the meanwhile, website constructing is also Mo's technical ability which he acquired by participating the iGEM last year. Youbin gives play to his talent by teaching fundamental program skills to new iGEMers as well as directing them to be self-reliant synthetic biologists.
Team Members
Yumin Hong
- Human Practice
- Photographer
- Design User Interface of all software and tools
- Design Visual Identity of team (team logo, mascot wiki, poster and so on)
Yuezhen Chen
- Constructor of the circuit
- Wet Lab Journal
- Lecture and Theme Campus Party
- Wiki designer and implementer
- E' NOTE designer and implementer
Yijuan Zhang
- BioBrick designer
- Circuit construction
- Data analyzer
- The designer of Promoter-decoder, RBS-decoder
- Lecture and Theme Campus Party
- The chief translator
Xin Huang
- Fluorescence test
- Mascot maker
- Travel management
- Wetlab assistance
- Data analyzer
- Programmer
Tao Han
- Talented programmer
- Human practice
Shen Lin
- Designer of the SynoProteiner
- Human practice
- Translater
- Financial management
- Wiki designer
Likai Qiu
- E’ NOTE designer and main implementer
- Wiki implementer
- Network advisor of XMU-China
Jianxing Huang
- Meeting memo
- Draft specification of E’ NOTE
- PPT of presentation
Jiang Huang
- Fluorescence test
- Designer of SynoProteiner part
- Wetlab assistance
Han Cheng
- Constructor of the circuit and fluorescence test
- The chief of Human practice
- Mascot maker
- First lord of the treasury
Advisors
Youbin Mo
- Software training
- Wiki checker
Xin Wu
- Snacks sponsor
- rescue worker
Ruosang Qiu
- Charge of the whole project
- Experiment training
All work described on this wiki or on our parts registry pages was done by iGEM Team XMU Software 2013. We managed to finish the whole project, from planning, financing to the complete dry and wet lab work by ourselves. Nevertheless we could not have done all this work without the help, advice and guidance of several people. Therefore, special thanks to the following people:
1. Team XMU China, the wet lab team of our university, gave us a hand to construction work.
2. Tina Zhang, the advisor of team XMU China, helped us in experiments, especially in site-specific mutagenesis and PCR.
3. Prof. Zhiliang Ji, College of Life Science, provided us with valuable guidance in choosing the project.
4. Prof. Shoufa Han, provided us with many instruments such as ELISA reader to test the fluorescence.
5. Qiang Kou, the previous team leader of SYSU-Software team, gives us lots of help.
6. Wenjun Rao, a shy boy from XMU Software College, build the beautiful interfaces for Brick Worker.
Xiamen, also known as Amoy to the west, is a cozy city located in the southeastern part of China, and has a relaxing coastal charm with a population of 1.3 million. It's a historical harbor city which was founded in the mid-14 century, in the early years of the Ming Dynasty. In the early 1980's, Xiamen was declared as one of China's first Special Economic Zone, taking advantages of the city's heritage as a trading center and the proximity to Taiwan. In 2004 the city won the finals of the world's Human Settlements and Environment Award, "Nations in Bloom". Xiamen is one of China's most attractive and best-maintained resort city, and attracts a large number of foreign and local tourists. The city is easily accessible by air, and there are direct flights from Hong Kong, Kuala Lumpur, Osaka, Seoul, Singapore and Tokyo. Within China, Xiamen airport is linked to more than 30 domestic airports.


Xiamen University (XMU), also known as Universitas Amoiensis in Latin, is one of the top universities in China. It was founded in 1921 by Tan Kah-Kee, the well-known patriotic overseas Chinese leader. As an integrated university, XMU owns a comprehensive branches of discipline as well as many specialized institutes. Economy, counting, chemistry, life science and marine science all win high fame nationwide and even worldwide. The main campus of XMU locates in a picturesque setting between the sea and a scenic mountain, spreading over 150 hectares, and is generally regarded as the most beautiful campus in China.
Abstract
In a promoter sequences, the sigma factor binding site and other transcription factor binding site affect the strength of binding significantly. For annotating promoters, some software was developed which mostly focused on the prediction of other transcription factors or one particular type of sigma factors but failed to analyze the promoter with both sigma factors and other transcription factors. 1-2 To solute this problem, a module of our software was designed which can analyze and evaluate promoters.
Our software use PWM method to calculate the similarity between promoter sequencess and the position frequency matrix of transcription factor binding sites (TFBS) to locate the TFBS as well as to predict the relative strength of the promoter. Promoter-Decoder overshadows its counterparts with all-round analysis and the prediction of promoter strength. It enables users to figure out promoter types, predict promoter strength, changeit by mutating the key sites and even change the property of certain promoter by adding new TFBS to the promoter sequences.
Background
Sigma Factors
Bacteria encode several thousands of different proteins, which are necessary for normal cell functions or for adaptation to environmental changes.3 These proteins are not required at the same time or in the same amount. Regulation of gene expression therefore enables the cell to control the production of proteins needed for its life cycle or for adaptation to extracellular changes. The various steps during transcription and translation are therefore subject to different regulatory mechanisms.4
The most prominent step in gene regulation is the initiation of transcription in which the DNA-dependent RNA polymerase (RNAP) is the key enzyme. The RNAP or the RNAP core enzyme is the catalytic machinery for the synthesis of RNA from a DNA template. However, RNAP cannot initiate transcription by itself. Initiation of transcription requires an additional polypeptide known as a sigma-factor.5 Sigma-factors are a family of relatively small proteins that can associate in a reversible way with the RNAP core enzyme. Together, the sigma-factor and the RNAP core enzyme form an initiation-specific enzyme, the RNAP holoenzyme.

The sigma-factor directs RNA polymerase to a specific class of promoter sequencess. Most bacterial species synthesize several different sigma-factors that recognize different consensus sequencess.6
This variety in sigma-factors provides bacteria with the opportunity to maintain basal gene expression as well as for regulation of gene expression in response to altered environmental or developmental signals.
The frequency at which the RNAP holoenzyme initiates transcription, also known as the strength of a promoter, is influenced by the promoter sequences and the conformation of the DNA in the promoter region. The sigma-factors recognize two conserved sequencess in the promoter region, known as the promoter consensus sequences. Sigma-factors or fragments of sigma-factors bind specifically to promoter DNA sequences and by specific base pair and amino acid substitutions in the promoter consensus sequencess or sigma factors. Most bacterial species synthesize several different sigma-factors which direct the RNAP holoenzyme to distinct classes of promoters with a different consensus sequences. This variety in sigma-factors provides the bacterium with the opportunity to maintain basal gene expression as well as for regulation of gene expression in response to specific environmental stimuli.
The identification of bacterial promoters is an essential step in the elucidation of gene regulation.7
As a general rule, the more complex the life-cycle and environmental niche of a bacterium, the greater the number of sigma factors with corresponding promoter types. Typically however, the most common promoter type is that which regulates the housekeeping genes and the corresponding major sigma-factor is shared by all bacteria (sigma 70 in the well studied E. coli, and its homologues in other species). The binding site for the sigma70-family of promoters is defined by two consensus hexamers, TTGACA and TATAAT, located at approximately −35 and −10, respectively relative to the transcript start site (TSS) and spaced 15–21 base pairs (bp) apart2. RNA polymerase core enzyme associates with the major sigma-factor to form the holoenzyme which in turn binds to its cognate promoters to initiate transcription.


In prokaryotes, the minimum requirement for RNA polymerase binding is recognition of the promoter by the sigma factor. In general, prokaryotic RNA polymerases can interchange a number of sigma factors which bind and initiate different groups of genes.3
Transcription Factors

Sigma factors are essential for the transcription initiation in E. coli.10
In addition, promoter strengths are not determined purely by the binding of the sigma factor. Other transcription factors can bind specific sequencess surrounding or overlapping the promoter to either activate or repress transcription.4 The mechanism is transcriptional activators and repressors contribute to and detract from the accessibility of DNA by the RNA polymerase. 12
These transcription-regulating nuclear proteins bind to specific binding sites in the regulatory regions (e.g. promoters, enhancers) of the genes thus providing their activation or repression.

Computational methods of predicting TF binding sites in DNA are very important for understanding the molecular mechanisms of gene regulation.
The binding sites of the same transcription factor show a significant sequences conservation, which is often summarized as a short (5–20 bases long) common pattern called a transcription factor binding site (TFBS) or binding consensus. Our software aims to figure out the possible TFBS in promoters and precisely locate the TFBS so that the user may know the exact sites that play a role in regulating the transcription.
In prokaryotes (lower organisms without nuclei), there are fewer TFs, their motifs tend to be relatively long and the strength of regulation for a particular gene often depends on how closely a particular site matches the consensus for the motif. The more mismatches to the consensus in a binding site, the less often the TF will bind and therefore the less control it will exert on the target gene. So our software will calculate the similarity between the possible TFBS in the promoter and the standard motifs so the user will know to which extent the transcription factor will control the promoter transcription
Primer Design
To facilitate the design of PCR primers of various promoters, we've developed an additional function, namely, primer design in this part of our program. After inputting the promoter sequences, the software will figure out the most suitable primers based on the theory of Thomas Kämpke1, Markus Kieninger, and Michael Mecklenburg.13
Data Source
RegulonDB
Genes and operons that are under control of the same TF are members of that TF's regulon. Although methods for the prediction of regulons have been substantially improved, they are still far from perfect.
Comparative genomics tools can be used to predict regulons in bacterial genomes but the procedure can lead to incorrect regulon calling. Despite this drawback, several regulon databases are available that are based on comparative genomics methods and lack experimental evidence.
Probably the extended and accurate databases of regulons for E. coli are RegulonDB which provides the data source for our program.
Algorithm
Experimental results show that these are the strongest promoters that have been characterized in vitro so far and confirm the hypothesis that the consensus promoter sequences is "best". To calculate the similarity between the promoter sequences and the best sequences, we implement the PWM method6 in our program.
PWM (Position Weight Matrix)
Molecular techniques for the identification of promoters are both costly and time consuming, hence in silico methods are an attractive and well explored alternative. The most common in silico method to identify sigma 70 promoters uses position weight matrices (PWMs) and depends on the relative conservation of the transcription factor binding site (TFBS, or motifs ).
The algorithm can be divided into two parts regarding to the difference between the motifs of sigma factors and other transcription factors.

Part 1: the recognition of other transcription factors.7
Other transcription factors are proteins that can bind to a specific DNA sequences (motifs) and regulate the promoter's transcription. To recognize these possible motifs in a given promoter sequences, we calculate the Matrix Similarity Score (MSS) of every possible sites in the promoter sequences using the position frequency matrix of 86 transcription factors published by RegulonDB. The algorithm reports only those matches of a matrix that have got MSS higher than the settled threshold. And MSS for a subsequences x of the length L is calculated in following steps:


fi,Bi , frequency of nucleotide B to occur at the position i of the matrix (B ∈{A, T, G, C})

f imin , frequency of the nucleotide which is rarest in position i in the matrix

f imax , highest frequency in position i.
The information vector

describes the conservation of the positions i in a matrix. Multiplication of the frequencies with the information vector leads to a higher acceptance of mismatches in less conserved regions, whereas mismatches in highly conserved regions are very much discouraged. This leads to a better performance in recognition of TF binding sites if compared with methods that do not use the information vector.
To determine the best threshold of the motif finding algorithm, we test various threshold values and analyze the true negative and false positive rate of each threshold value. The ideal threshold is supposed to have both the least true negative and false positive rates.
| Threshold | 0.5977 | 0.598 | 0.69 | 0.7 | 0.73 | 0.76 | 0.0778 | 0.84 | 0.85 | 0.86 | 0.9 |
| True megtive | 0.1 | 0.11 | 0.21 | 0.23 | 0.3 | 0.45 | 0.5 | 0.63 | 0.7 | 0.72 | 0.77 |
| False positive | 56.4778 | 57.01124 | 31.56962 | 29.15584 | 23.58571 | 20.92727 | 17.90796 | 9.945946 | 10.66667 | 10.17857 | 6.608696 |
The picture above shows part of our test results and to keep both the true negative and false positive rates at a reasonable level, we adopt 3 threshold values, namely, low (0.5977) , median (0.0778) and high (0.85), with a true negative rate at 0.1, 0.5, and 0.7 respectively. And for more flexibility, we also allow the users to set their own thresholds.
Part 2: the recognition of sigma factor motif and the evaluation of relative promoter strength.
In the case of sigma 70 factors, the motifs are the −35 and −10 hexamers. Enclosing a spacer of length 15–19 bp.
Given a promoter sequence, the -10 and -35 hexamers are located by the total MSS of the two hexamers calculated by the position frequency matrices of the sigma factor binding sites, which are derived from Regulon DB. And the calculating process is subject to two constraints:
1. That the spacer length (the number of base pairs between the −35 hexamer and the −10 hexamer) should lie in the range (15–20);

2. The total MSS (our results are the sum of the scores for the −10 and −35 hexamers and therefore lie in the interval [0,2], with a score of 2 corresponding to the joint consensus TTGACA (−35) and TATAAT (−10).
Score(Promoter)=score(-10 box)+score(-35 box)+score(spacer between -10 & -35 boxes)
And the score of spacer length is calculated by algorithms propozed by Ryan K. Shultzaberger.el. in
In prokaryotes, the strength of sigma factor regulation for a particular gene often depends on how closely a particular site matches the consensus for the motif. The more mismatches to the consensus in a binding site, the less often the sigma factor will bind and therefore the less strength the promoter will have. Experiments have confirmed the hypothesis that the consensus promoter sequences is "best". We set the best promoter strength to 100% and calculate the relative strength of a given promoter by the Score (promoter).
Primer design
A primer pair (p, q) is assigned the scoring vector
sc (p, q) = (|p|, |q|, GC (p), GC (q), Tm (p), Tm (q), sa (p), sa (q), sea (p), sea (q), pa (p, q), pea (p, q))T ∈ R12.
All primers are designed to have ideal values of length, GC content, and melting temperature which are specified externally by the designer of the hybridization experiment. These ideal values are to be specified for forward and reverse primers. The ideal score vector or reference vector for the primer pair is
scideal =(lengthf , lengthr , GCf , GCr , Tm,f , Tm,r , 0, 0, 0, 0, 0, 0)T.
All ideal annealing values are set to zero and typically
Tmf = Tm,r as well as GCf = GCr . The final assessment of a primer pair (p, q) can be its deviation from the reference in terms of the l1-distance

Here, we employ a weighted distance

with weights given in the following table.

The formulas for calculating the variations above are provided in Efficient primer design algorithms.13
Results
Sigma factors recognition
Our program has a correctness rate of 56% in recognition various types of sigma factors. We ran our program with 100 various promoters sequencess whose types have already been confirmed experimentally. And we've recognized 56 of them correctly. Specifically, as for sigma 70 promoters, which are the most prevalent, the recogtion correctness rate has reached 92%. The results are showed below.
TFBS Location
We then test the reliability of our software regarding TFBS location and results show that the correct site prediction rate is 64%. We used the sigma70 promoter sequences with annotated -35 and -10 region provided by RegulonDB to test the correct prediction rate of the binding site of a specific transcription. We input 89 sigma70 promoter sequencess and ran our program to precisely locate the sigma factor binding site.
The test results are as follows. The numbers represent the site of actual-35 motif, the actual spacer length, the predicted site and predicted spacer length respectively.
Promoter strength correlation & experiments
To testify our prediction of promoter strength, our team has done a considerable amount of lab work. First, we located the -10 region of the pBAD promoter (BBa _K206000) and accordingly mutated the -10 region into BBa _K1070002, BBa _K1070003, the sequencess of these promoters are given bellow (-10 regions are highlighted):
Pba dSt rong (BBa _K206000):a c a t t g a t t a t t t g c a c g g c g t c a c a c t t t g c t a t g c c a t a g c a a g a t a g t c c a t a a g a t t a g c g g a t c c t a c c t g a c g c t t t t t a t c g c a a c t c t c t a c t g t t t c t c c a t a c c g t t t t t t t g g g c t a g c
BBa _K1070002:a c a t t g a t t a t t t g c a c g g c g t c a c a c t t t g c t a t g c c a t a g c a a t a t a g t c c a t a a g a t t a g c g g a t c c t a c c t g a c g c t t t t t a t c g c a a c t c t c t a c t g t t t c t c c a t a c c g t t t t t t t g g g c t a g c
BBa _K1070003:a c a t t g a t t a t t t g c a c g g c g t c a c a c t t t g c t a t g c c a t a g c a a g a t a a t c c a t a a g a t t a g c g g a t c c t a c c t g a c g c t t t t t a t c g c a a c t c t c t a c t g t t t c t c c a t a c c g t t t t t t t g g g c t a g c
Subsequently, we measured the fluorescence intensity of these promoters and relate it to the actual promoter strength. The experimental results are shown in Figure 8.

Than we fit the actual strength and the predicted strength, as can be seen in figure 9, the coefficient of determination is 0.8924.

Future work
Apply our algorithms to more species. Now Pro-decoder is designed expressly for prediction and evaluation of E. coli promoters, in the near future we'll study the transcription regulation mechanism of other species and try to apply our algorithms to an extended range of species.
Enhance promoter strength prediction accuracy. Because our experimental data is so limited, the weight of the spacer length and the motif similarity is roughly determined, which lead to a weak correlation between the promoter strength. In the future we hope to obtain more experimental data with regard to the effect of spacer length and motif similarity having on promoter strength so we can revise the weight coefficients of the two factors and get more reliable results.
The next version of this part of our program will be able to analyze not only the promoters of E. coli, but other species such as Bacillus subtilis, we'll integrate the transcription factor binding site data of more species into our database and use PWM algorithm to predict the TFBS in the promoters.
References
Abstract
The efficiency of translation in bacteria is greatly influenced by the binding affinity between the ribosome and RBS, which can be measured by RBS strength. Experimental work to determine a RBS sequences can be awfully laborious while our software program can solve this problem easily. RBS-decoder is a software tool for evaluating RBS strength and locating SD sequences. This program uses the same method—PWM to calculate the similarity between the RBS sequences and the position frequency matrix of SD sequences and transform the similarity to the relative strength of a RBS sequences.
Background
Translational efficiency in Escherichia coli is generally determined at the stage of initiation. There are several principal mRNA sequences elements which can affect the kinetics of ternary initiation complex formation (30 S-mRNA-fMet-tRNA): SD sequences and the start codon (ATG). The SD sequences base-pairs with a RNA molecule that forms part of the bacterial ribosome (the 16s rRNA), while the start codon base-pairs with the initiator tRNA which is bound to the ribosome. In addition the SD sequences and the start codon being important, the spacer between them also influences the RBS strength, these two sequencess need to be positioned approximately 6-7 nucleotides apart so they can both make contact with the appropriate parts of the ribosome complex1.
Introduction
How do baterial Ribosome Binding Sites work?
The bacterial ribosome binds to particular sequencess on an mRNA, primarily the SD sequences and the start codon (ATG). The SD sequences base-pairs with an RNA molecule that forms part of the bacterial ribosome (the 16s rRNA), while the start codon base-pairs with the initiator tRNA which is bound to the ribosome. In addition to SD sequences and the start codon being important, these two sequences need to be positioned approximately 6-7 nucleotides apart so they can both make contact with the appropriate parts of the ribosome complex.1
The Shine-Dalgarno sequences

The end of the 16s rRNA that is free to bind with the mRNA includes the sequences 5′–ACCUCC–3′. The complementary sequences, 5′–GGAGGU–3′, named the Shine-Dalgarno sequences, can be found in whole or in part in many bacterial mRNA. Very roughly speaking, ribosome binding sites with purine-rich sequencess (A's and G's close to the Shine-Dalgarno sequences will lead to high rates of translation initiation whereas sequencess that are very different from the Shine-Dalgarno sequences will lead to low or negligible translation rates. You can see how common the sequences is by looking at the RBS sequences logo on the right (where the height of a letter indicates the frequency of the letter at that location).
Algorithms
As we know, the RBS strength is greatly influenced by the SD sequences, where the 16s RNA of the ribosome binds to, so the strength can be determined by the binding free energy between the SD sequences and the 16s RNA. So we designed a program calculating the binding free energy but the results show that the correlation between the free energy and the strength of RBS is rather weak (R2=0.5517). So we decide to find other algorithms for better accuracy.
Inspired by the strength prediction algorithms used in promoter part, in which the similarity to the sigma factors' PWM is interlocking with the binding affinity between the protein and DNA sequences. We obtained the Position Frequency Matrix of SD sequences of E. coli and use the PMW method (illustrated in detail in the promoter part) to calculate the similarity between the RBS sequences and the Position frequency sequences, what is different from the promoter is that, the spacer length between the SD sequences and the startcodon and the start codon itself both act as constraints in locating the SD sequences, which is confined to 3-16 bp and ATG/TTG/GTG. And similar to the prediction of promoter strength, the spacer length between the SD sequence also contributes to the RBS strength, the optimal spacer length is 7 bp, and the spacer score is calculated using the same algorithm applied in the promoter part.2 The weight of the influence of the spacer on the strength isderived from the algorithm to predict the promoter strength, in which the weight of the total MSS and the spacer is 0.29:0.71, and since in promoter the total MSS is the sum of two motifs while the SD sequences is only one motif, the weight between the MSS(SD sequences) and the spacer is 0.29:0.355.
| 1 | 2 | 3 | 4 | 5 | |
| T | 0.161 | 0.050 | 0.012 | 0.071 | 0.115 |
| C | 0.077 | 0.037 | 0.012 | 0.025 | 0.046 |
| A | 0.681 | 0.105 | 0.105 | 0.861 | 0.164 |
| G | 0.077 | 0.808 | 0.960 | 0.043 | 0.659 |
Results
We use the RBS sequences listed on the iGEM registry with experimentally determined relative strength,4 and the correlation between the RBS strength predicted by our software and the actual relative strength is strong, with a determination coefficient value 0.8039.

Future work
Due to scarcity of experimental data, the relative weight of the SD sequences and the spacer length used currently is roughly determined which may undermine the accuracy of RBS strength prediction. For further improvement of our program, we'll try to obtain more reliable experimental data to accurately determine the weight used in our algorithm and hopefully elevate the accuracy of RBS-decoder.
In the next version of RBS-decoder, the secondary structure of the RBS sequences will be shown on the software and we'll also include the other species' SD sequence data in order to predict the RBS strength of a larger range of species.
Reference
Background
Gene expression in both prokaryotes and eukaryotes is frequently controlled at the level of transcription. This process can be represented as a cycle consisting of four major steps: (1) promoter binding; (2) RNA chain initiation; (3) RNA chain elongation; and (4) termination. Since regulatory controls are exerted at each step, an understanding of the mechanism of each step is of general importance in understanding gene expression.
In the promoter part of our program, we've discussed the mechanism of promoter binding step and how it affects the transcription level. To complete our biobrick evaluation program and to better understanding of transcription process, we integrated the software developed by 2012 iGEM team SUSTC-Shenzhen-B to realize the prediction of transcription termination efficiency.
Introduction
Termination, the last step of the transcription cycle, occurs when the RNA polymerase releases the RNA transcript and dissociates from the DNA template. It is important that transcription is imperfectly terminated at some terminator so that the ratio of the amount of the mRNA transcribed from upstream and that from downstream of the terminator is controlled. This regulation is quantified by the termination efficiency (%T).
Two mechanisms of transcription termination and two classes of termination signals have been described in bacteria: rho-dependent and rho-independent.
Rho-independent (also known as intrinsic) terminators are sequences motifs found in many prokaryotes that cause the transcription of DNA to RNA to stop. These termination signals typically consist of a short, often GC-rich hairpin followed by a sequences enriched in thymine residues.
The conventional model of transcriptional termination is that the stem loop causes RNA polymerase to pause and transcription of the poly-A tail causes the RNA: DNA duplex to unwind and dissociate from RNA polymerase.
Algorithm
In 2011, iGEM team SUSTC-Shenzhen-B developed a software tool TTEC to predict terminator efficiency. It takes DNA sequencess as input and returns the terminator efficiency value.
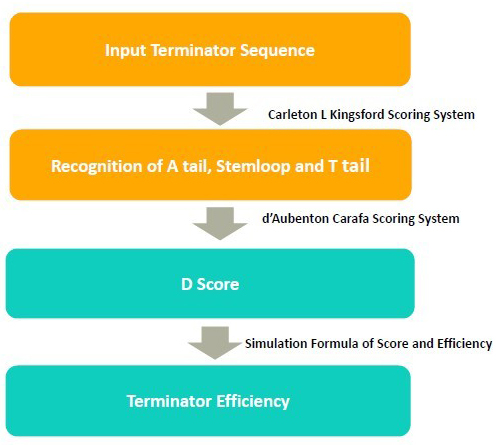
In the algorithm, it takes 3 steps to calculate the terminator efficiency:
1. Use RNA folding algorithm to predict the secondary structure of terminator and and recognize A tail, stemloop and T tail.
2. From the secondary structure, we calculate the free energy of stem loop, and generate a score by considering stem loop free energy and T tail
3. From the score, we predict the terminator efficiency based on the score-terminator equation.
The prediction of secondary and recognition of A tail, stemloop and T tail are achieved by Kingsford scoring system.
Kingsford Scoring System
In 2007, Carleton L. Kingsford et al. described TransTermHP1, a new computational method to rapidly and accurately detect Rho-independent transcription terminators.
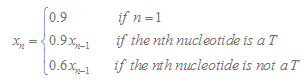
They put forward an algorithm to predict Rho-independent terminators. The first 15 bases of the potential tail sequences are scored using a function:
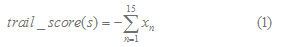
where
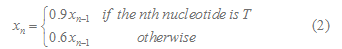
for n=1,2,..,15 and =1.
The energy of potential hairpin configurations adjacent to a reference position can be found efficiently with a dynamic programming algorithm. The table entry hairpin_score[i,j] gives the cost of the best hairpin structure for which the base of the 5' stem is at nucleotide position i and the base of the 3' stem is at position j. The entry hairpin_score[i,j] can be computed recursively as follows:
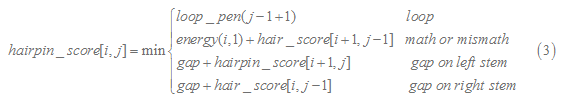
The function energy(i,j) gives the cost of pairing the nucleotide at i with that at j, and loop_pen(n) gives the cost of a hairpin loop of length n. The hairpin's loop is forced to have a length between 3 and 13 nt, inclusive, by setting loop_pen(n) to a large constant for any n outside that range. The constant 'gap' gives the cost of not pairing a base with some base on the opposite stem and thus introducing a gap on one side of the hairpin stem.
Table 1
Parameters used to evaluate hairpins
Pairing Energy
G-C -2.3
A-T -0.9
G-T 1.3
Mismatch 3.5
Gap 6.0
Loop_pen(n) 1•(n - 2)
Parameters used to evaluate the energy of a potential hairpin where n is the length of the hairpin loop
The D score is calculated by Carafa Scoring System.
Carafa Scoring System
Scoring System 2 is based on the model created by d'Aubenton Carafa 2. The score of terminator consists of two parts, the free energy of stemloop and the score of 15 nt poly T tail. The free energy of stemloop is calculated using Loop Dependent Energy Rules 3. The minimization of the free energy also determined the secondary structure of the stemloop. T tail score is calculated by the formula given by d' Aubenton Carafa.
Detailed Calculation of Score
1. Some definitions3
i. Closing Base Pair
For an RNA sequences, we number it from 5' to 3' . If i < j and nucleotides ri and rj form a base pair,we denote it by i.j. We call base ri' or base pair i'.j' is accessible from i.j if i <i' ( <j' ) <j and if there is no other base pair k.l so that i <k <i' ( <j' ) <l <j. We denote the collection of base and base pair accessible from i.j by L(i,j). Then i.j is the closing base pair. Here “L” means loop.
ii. n-loop
If the loop contain n – 1 base pairs, we denote it by n-loop. (Because there is a closing base pair, so we denote it by n-loop even though the closing base pair is not included in the loop.)
Here we can divide loops which may be formed in the terminator secondary structure into two kinds.
1-loop : Hairpin loop(size of loop shouldn't be smaller than 3)
2-loop : Interior Loop(right strand size and left strand size are both bigger than 0.)
Buldge(Size of one strand is bigger than 0 and that of another strand is 0.)Stack(size of the loop is 0.)
2. Calculation of the Minimum Free Energy Change of Stemloop Formation4 Assume i.j is the closing base pair of the loop
G(i,j)= min { GH ( i , j ) , GS( i , j ) + G ( i + 1 , j – 1 ) , GBI( i , j ) } ;
GBI ( i , j ) = min{ gbi( i , j , k , l ) + G( k , l ) } for all 0 < k – i + l – j - 2 < max_size
G(i,j) is the minimum free energy change of stemloop formation. GH is the free energy change to form a hairpin loop. GS is the free energy change to form a stack. GBI is to calculate the minimum free energy change of structure containing 2-loop. gbi(i,j,k,l) is the free energy change to form 2-loop.
3.Calculation of T Tail Score
Here we consider 15 nucleotide in the downstream of stemloop. T tail score nT is calculated as follows :

In our program, if the length of the T tail( n ) is less than 15, we will only consider n nucleotides. If TL is more than 15, we will only consider 15 nucleotides.
4.Calculation of Score
Score = nT * 18.16 + deltaG / LH * 96.59 – 116.87
Here nT is T tail score. deltaG is the minimum free energy change of stemloop formation. LH is the length of stemloop.5,6
References
Abstract
Our team mainly focuses on programming the software by two methods using genetic algorithm, evaluating both optimization of single codon and codon pair and hence determining the fittest optimized sequences for expression in heterologous host cell.
Apart from the optimization, we have two additional functions. One is the statistics analysis, which provides the numbers and the proportion of the codon in the original and optimized sequences, making the optimization easier to understand. The other is the prediction of the protein folding rate. The purpose of the prediction is to seek the law of the folding rate in general, computing a relatively accurate folding rate value of the optimized sequences for the users.
Background
Synonymous codons and the efficiency
Except methionine and tryptophan, all amino acids can be encoded by two to six synonymous codons, resulting from the degeneracy of the genetic code.1 However, unequal utilization of the synonymous condons leads to the phenomenon of codon usage bias, which is mainly due to natural selection, mutation and genetic drift.2 According to related studies, codon usage bias has certain connection with gene expression level.3 The larger the value of codon usage bias is, the higher gene expression will be. So the problem, how to substitute the synonymous codons aimed at raising the efficiency of gene expression and thus increasing the production of recombination protein in heterologous host cell, is expected to be addressed.
Protein folding rate
Protein is an important class of biological macromolecules. It is the main bearer of life activities and occupies a special position in vivo. Each protein has its own unique amino acid composition and sequences. Only when the amino acid chain is folded into the correct three-dimensional structure, will the protein have normal biological functions. Misfolded ones will not only lose its biological function but also even cause diseases such as mad cow disease, Alzheimer's syndrome, etc. The protein folding problem, an important biological question that the central dogma of molecular biology has not solved yet, has been listed as an important topic in twenty-first century. The folding mechanism of the protein is a challenging task, one of which is to determine factor influencing the folding rate. Although the answer can be found in a variety of biological experiments, such as various spectroscopy, mass spectrometry and nuclear magnetic resonance, these methods are time-consuming and costly. With the development of physics, mathematics, especially the progress of computer technology, how to apply a fast and accurate calculation method to predict protein folding rate attracts more and more attention.4
Introduction
Balance with single codon and codon pair
Individual codon usage optimization has been attached importance to, taking Codon optimizer,5 Gene Designer,6 OPTIMIZER7 for example. Subsequently, people found the effect of gene expression optimization cannot be perfect just by single codon optimization. Codon pair, namely the pair of k-th and (k+1)-th codons from the 5’ to 3’ end, is another crucial factor. Due to potential tRNA-tRNA steric interaction within the ribosomes,8 the usage of rare condon pairs, which correlate with translation elongation, decrease protein translation rates.9 Optimization of individual codon has an influence on the corresponding codon pair resulting in maybe-not-the-best codon pair optimization. In the same way, optimizing codon pair merely contributes to maybe-not-the-best single codon optimization. Therefore, it is a challenging way for us to apply a method considering and weighing the effects of single codon and codon pair optimization and thus make the whole best.
Our team focuses on evaluating both optimization of single codon and codon pair and thus selecting the best sequences for expression in heterologous host cell.
Host Cell
Considering E. coli and S. cerevisiae are the ideal hosts for recombinant proteinexpression, and Gram-positive bacterium L. lactis and methylotrophic yeast P. pastoris are also promising candidates for expressing recombinant proteins,10 we attached importance to selecting these four kinds of bacterium as host cell to optimize the sequences.
Method of prediction
In recent years, many researchers have made great efforts to explore the determinants of the folding rate, and various forecasting methods have been proposed. The existed prediction methods can be roughly divided into three categories.11-12 The first one is based on the tertiary structure.13-19 However, it takes lots of molecular experiments, expensive and in long period, to acquire the information of the tertiary structure, which fails to meet the demand of rapid prediction. The second category is based on the secondary structure.20-24 This kind of method requires information of the secondary structure, similarly obtained by molecular experiments, or from the primary sequences prediction, but it will be limited by accuracy of the secondary structure prediction method. The last one is based on the primary structure,25-34 which predicts the folding rate from amino acid sequencess without most structure information.4 And our prediction of the protein folding rate focuses on the last method.
Algorithm
Part I—Method I: MOCO35
Basic Table
Based on the table below, we calculate function of single codon (ICU) , function of codon pair (CCO) and the function of multi-objective codon optimization (MOCO). MOCO aims at make the optimization of whole best by calculating the relative effect of ICU and CCO.
Amino acid abbreviation and synonymous codons.11
| Amino Acid | Abbreviation | Synonymous Codon(s) |
|---|---|---|
| Methionine | M | AUG |
| Tryptophan | W | UGG |
| Cysteine | C | UGC, UGU |
| Aspartate | D | GAC, GAU |
| Glutamate | E | GAA, GAG |
| Phenylalanine | F | UUC, UUU |
| Histidine | H | CAC, CAU |
| Lysine | K | AAA, AAG |
| Asparagine | N | AAC, AAU |
| Glutamine | Q | CAA, CAG |
| Tyrosine | Y | UAC, UAU |
| Isoleucine | I | AUA, AUC, AUU |
| Alanine | A | GCA, GCC, GCG, GCU |
| Glycine | G | GGA, GGC, GGG, GGU |
| Proline | P | CCA, CCC, CCG, CCU |
| Threonine | T | ACA, ACC, ACG, ACU |
| Valine | V | GUA, GUC, GUG, GUU |
| Leucine | L | CUA, CUC, CUG, CUU, UUA, UUG |
| Arginine | R | AGA, AGG, CGA, CGC, CGG, CGU |
| Serine | S | AGC, AGU, UCA, UCG, UCC, UCU |
| (Stop) | * | UAA,UAG,UGA |

Calculation of ICU
max
s.t.

Calculation of CC
max
s.t.

In the function,
Kronecker Delta symbol
Calculation of MOCO
The MOCO calculation is as follows (NSGA-II algorithm applied):
1. Randomly initialize a population of coding sequencess for target protein.
2. Evaluate ICU and CC fitness of each sequences in the population.
3. Group the sequencess into nondominated sets and rank the sets.
4. Check termination criterion.
5. If termination criterion is not satisfied, select the “fittest” sequencess (top 50% of the population) as the parents for creation of offsprings via recombination and mutation.
6. Combine the parents and offsprings to form a new population.
7. Repeat steps 2 to 5 until termination criterion is satisfied.
The identification and ranking of nondominated sets in step 3 is performed via pair-wise comparison of the sequencess' ICU and CC fitness. For a given pair of sequencess with fitness values expressed as  and
and  , the domination status can be evaluated as follows:
• If  and
and  , sequences 1 dominates sequences 2.
• If  and
and  , sequences 1 dominates sequences 2.
• If  and
and  , sequences 2 dominates sequences 1.
• If  and
and  , sequences 2 dominates sequences 1.
The process is showed in the figure below:

Multi-objective codon optimization solution. The optimal solutions generated by MOCO lies on the pareto front (region in yellow).11
At the first, we decided on this method and we also programmed the software by MOCO method. However, we found two problems. One is that the calculation of ICU and CC fitness is only based on mathematical rationality, and lacks of enough experimental data to prove the result. And the other, we would like to find a fitness function, which weighs both the two aspects as a whole. Therefore, in order to tackle with the problem, we chose the method II below as the one recommended.
Part II—Method II: Fitness36
Fitness function:

In the function,

cpi is a value larger than zero, ranging from 10-4 to 0.5,fitcp (g) is the fitness function of the codon pair,fitsc (g) is the fitness function of the single codon,w ( (c (k),c (k+1)) is the weight of codon pairs in sequences g,|g| is the length of encoding sequences, c (k) is k-th codon in the sequences, is the target ratio of k-th codon,
  is the actual ratio of k-th codon in the sequences,the best value of cpi is 0.2 in the software.
In the function, the target ratio of k-th codon can be approximated by the equation below:

In the function, weight can be calculated by the equation below:

 stands for the ratio of single codon ck in the complete genome'
 is the number of pair ( ci,cj ) in high-expression genes, and high-expression genes are genes whose copy numbers of mRNA can be detected at least 20 per cell.

syn (ck) stands for the synonymous codon set related to ck, equals to the number of amino acid encoded by ci in the whole protein set.
By this method, there are enough experimental data to prove the sequences optimized works. Xylose isomerase in Bacillus stearothermophilus, Xylose isomerase in Streptomyces olivochromogenes and L-arabinose isomerase in Thermoanaerobacter mathranii all, the optimized ones, were highly expressed in Bacillus subtilis. In addition, the activity of the optimized Aspergillusniger fungal amylase was enhanced to 400% compared with the original sequences in A. niger.36
Part III—Prediction of protein folding rate
In order to illustrate protein folding rate quantitatively, we determine the folding rate of 60 kinds of proteins as an experimental data set from literature and database37, and information of the sequences comes from PBD and NCBI.
| protein | Logarithm of the folding rate Ln(kf) | protein | Logarithm of the folding rate Ln(kf) | protein | Logarithm of the folding rate Ln(kf) |
|---|---|---|---|---|---|
| 2PDD | 9.8 | 1FKB | 1.5 | 1RA9 | -2.5 |
| 2ABD | 6.6 | 2CI2 | 3.9 | 1QOP | -6.9 |
| 256B | 12.2 | 1URN | 5.8 | 1PHP | 2.3 |
| 1IMQ | 7.3 | 1APS | -1.5 | 1PHP | -3.5 |
| 1LMB | 8.5 | 1RIS | 5.9 | 1BNI | 2.6 |
| 1WIT | 0.4 | 1POH | 2.7 | 2LZM | 4.1 |
| 1TEN | 1.1 | 1DIV | 6.1 | 1UBQ | 5.9 |
| 1SHG | 1.4 | 2VIK | 6.8 | 1SCE | 4.2 |
| 1SRL | 4 | 1A6N | 1.1 | 1YCC | 9.62 |
| 1PNJ | -1.1 | 1CEI | 5.8 | 1VII | 11.52 |
| 1SHF | 4.5 | 2CRO | 3.7 | 1NYF | 4.54 |
| 1PSF | 3.2 | 2A5E | 3.5 | 2AIT | 4.2 |
| 1CSP | 7 | 1IFC | 3.4 | 1PIN | 9.44 |
| 1C9O | 7.2 | 1EAL | 1.3 | 1C8C | 6.91 |
| 1G6P | 6.3 | 1OPA | 1.4 | 1BRS | 3.4 |
| 1MJC | 5.3 | 1CBI | -3.2 | 1UBQ | 5.9 |
| 1LOP | 6.6 | 1QOP | -2.5 | 3CHY | 1 |
| 1C8C | 7 | 1BRS | 3.4 | 1BIN | 2.6 |
| 1HZ6 | 4.1 | 3CHY | 1 | 1SCE | 4.2 |
| 1PGB | 6 | 2RN2 | 0.1 | 1GXT | 4.38 |
In order that the characteristic factors of the folding rate can be extracted from protein sequencess, we introduced the Chou's pseudo amino acid composition concept.38 According to the pseudo amino acid composition principle, the position information of protein sequencess can be, to some extent, reflected by a group of serial correlation factors θ1,θ2 ,θ3……,θn ,which is defined as follows:

in the function, θ1 is called the first-tier correlation factor that reflects the sequences order correlation between all the most contiguous residues along a protein chain (Fig. 2a), θ2 the second-tier correlation factor that reflects the sequences order correlation between all the second most contiguous residues (Fig.2b), θ3 the third-tier correlation factor that reflects the sequences order correlation between all the 3rd most contiguous residues (Fig.2c), and so forth.38

the correlation function is given by4:
where H1(Ri)), H2(Ri), and M(Ri) are, respectively, the hydrophobicity value. Studies have shown that λ=10 will be the best predictor.39 But there will be a large amount of calculation considering all possible situations—the 30 factors. We should select factors that can obtain the best prediction accuracy in least calculation. For that reason, we drew lessons from the literature4 by using the method of Monte Carlo simulation and then 14 optimal characteristic factor were obtained. Other studies have indicated that the logarithm of the sequences length has a good correlation with folding rate, so Ln (L) will be the fifteenth factors. We apply SPSS software to calculate the coefficient of 15 factor by multivariate linear regression, and this will be the forecast formula of the rate of protein folding. We compared the experimental data and the predicted data and the results are as follows:

Through the test, our software succeeded in showing a relatively accurate folding rate value.
Future work
First of all, we will modify our software by advancing the program and the framework to improve its ability of concurrent computation and shorten the computing time.
Secondly, to accelerate the calculation, we may simplify the function of calculation by neglecting some term in our equations. However, considering the time spent on running program was extremely little, we will pay more attention on how to modify the equations for increasing the accuracy which maybe dramatically progress optimization result.
Thirdly, enriching the database is other way to improve our software. According to time-space tradeoff law, we could pre-process a bunch of sequencess in common use to optimized one and save the result into our database. By assessing our data, investigators could select the optimized sequencess for their synthesis. Then, users are required to feedback their result. When it collects enough information, our app will learn users’ bias therefore modify our optimizing function by some methods, like genetic algorithm.
The specific points are listed as following:
1. Shortening the computing time of the software.
2. Expanding the range of the host cells.
3. Improving bacterium's resistance to toxic molecule.
4. Advancing existed paths of synthetic biology by the method.
5. Designing new paths of synthetic biology by the method.
6. Increasing the output of recombinant protein.
7. Predicting the expression of heterologous gene in a new host cell.
8. Considering more factors such as spiral structure in folding which influence the folding rate and thereby obtaining more accurate prediction rate.
9. Providing a set of software tools for protein folding, especially in molecular dynamics simulation of protein folding.
References
Abstract
E' NOTE is a web application designed for bearing iGEM wetlab team a hand with their project. Our software not only contains the basic function of ordinary recording softwares such as text editor, graph uploading, table customization and some noting templates for experiments, but also integrates the wetlab applications from the internet as well as other iGEM software teams' projects. As an iGEMer, you can use E' NOTE all the way through their preparing day. After an easily register, users can start their project quickly. In the brain storm, you and your teammates gather together and record the process in E' NOTE. When days come to the experimental time, classical templates designed by ourselves will help you streamline the noting process for more easy reading and understanding of your team journal. In a word, E' NOTE is a brilliant synthetic biology tool!
Demo
Future work
1. Update the safety level of E' NOTE. For example, saving the users' data in several servers. 2. Design more recording template for more experiment. 3. Integrate E' NOTE with existing softwares in github, not only the web applications, but the programs which were coded with C, C++ and java as well. 4. Perfect the basic function of E' NOTE, such as changing the font or designing a mind-map to help wetlab team to build their project. 5. Create an communication platform, in which the users of E' NOTE can share their achievements and communicate with other researchers easily.
Future work
1.Click here to learn how to use E' NOTE: Tutorial of E' note
2.Reading some example of E' NOTE, please click here: Quick Start Guide
 Gold Medal
To earn a Gold Medal, in addition to the Silver Medal requirements, a team must:
1.Have another team utilized the software developed by your team. You must clearly show how your software was used and the results that were obtained?
XMU-China used our software to kee their experimental records and put them on their wiki.
2a. Outline and detail how your software effects Human Practices in Synthetic Biology. Such topics include: safety, security, ethics, or ownership, sharing, and innovation.
OR
2b. In place of requirement two, a team may instead use SBOL in your software documentation.
The sequences, written by SBOL, can be input into Brick Worker to be optimized.
PLUS
3a. Develop and document a new technical standard that supports one of the following:
1. design of BioBrick Parts or Devices 2. construction of BioBrick Parts or Devices 3. characterization of BioBrick Parts or Devices 4. the analysis, modeling, and simulation of BioBrick Parts or Devices 5. the sharing of BioBrick Parts or Devices, either via physical DNA or as information via the internet.
Brick Worker fulfils first 4 tasks with BioBrick Parts.
E' NOTE can share lab journals and other information within a team or a group via the Internet.
OR
3b. Build upon existing software from a previous iGEM competition found on the The Registry of Software Tools
Brick Worker expands the evaluation range of SUSCT-Shenzhen-B, by which we can optimize all kinds of BioBricks.
 Silver Medal
To earn a Silver Medal, in addition to the Bronze Medal requirements, a team must do ONE of the following:
1. Provide a detailed, draft specification for the next version of your software tool
2. Provide a second, distinct (yet complementary) software tools project.
We design two softwares called Brick Worker and E' NOTE.
In addition the team must:
1. Provide a demonstration of their software either as a textual or video tutorial made available on their wiki. This tutorial should explain all the features of the tool as well as provide sample input and output as appropriate.
 Bronze Medal
1. Register the team, have a great summer, and have fun attending the Jamboree.

2. Create and share a description of the team's project via the iGEM wiki.
3. Present a Poster and Talk at the iGEM Jamboree.
4. Develop and make available via The Registry of Software Toolsan open source software tool that supports synthetic biology based on BioBrick standard biological parts (remember, the iGEM judges will be looking for substantial team-based software projects).
Our code can be found on the Registry of Software Tools
Basic Safety Question for iGEM 2013
1. List and describe all new or modified coding regions you will be using in your project. (If you use parts from the 2013 iGEM Distribution without modifying them, you do not need to list those parts.)
| Part number. | Where did you get the physical DNA for this part (which lab, synthesis company, etc) | What species does this part originally come from? | What is the Risk Group of the species? | What is the function of this part,in its parent species ? | |
| Ex | BBa_C0040 | Synthesized, Blue Heron | Acinetobacter baumannii | 2 | Confers tetracycline resistance |
| 1 | BBa_K1070000 | PCR, Dr.Baishan Fang's lab, Xiamen University | Registry of Standard Biological Parts | 1 | The promoter induced by arabinose |
| 2 | BBa_K1070001 | PCR, Dr.Baishan Fang's lab, Xiamen University | Registry of Standard Biological Parts | 1 | The promoter induced by arabinose |
| 3 | BBa_K1070002 | PCR, Dr.Baishan Fang's lab, Xiamen University | Registry of Standard Biological Parts | 1 | The promoter induced by arabinose |
| 4 | BBa_K1070003 | PCR, Dr.Baishan Fang's lab, Xiamen University | Registry of Standard Biological Parts | 1 | The promoter induced by arabinose |
2. Highest Risk Group Listed
1
3. Please describe the chassis organism(s) you will be using for this project. If you will be using more than one chassis organism, provide information on each of them:
| Species | Strain no/name | Risk Group | Risk group source link | Disease risk to humans? If so, which disease? | |
| Ex | E. coli (K 12) | NEB 10 Beta | 1 | www.absa.org/riskgroups/bacteria search.php?genus=&species=coli | Yes. May causes irritation to skin, eyes, and respiratory tract, may affect kidneys. |
| 1 | E. coli (K 12) | DH5α | 1 | http://www.absa.org/riskgroups/bacteriasearch.php?genus=Escherichia | Yes. May causes irritation to skin, eyes, and respiratory tract, may affect kidneys. |
| 2 | E. coli (B) | BL21 | 1 | http://www.absa.org/riskgroups/bacteriasearch.php?genus=Escherichia | Yes. May causes irritation to skin, eyes, and respiratory tract, may affect kidneys. |
4. Do the biological materials used in your lab work pose any of the following risks? Please describe.
a. Risks to the safety and health of team members or others working in the lab?
No. According to the Final Risk Assessment of the U.S. Environmental Protection Agency (EPA) (1997), E. coli K-12 are not likely to pose any risk to human or animal health, to plants or to other microorganisms. In addition, we will use gloves and eye protected glasses during the experiments.
b. Risks to the safety and health of the general public, if released by design or by accident?
No. E. coli K-12 are not likely to pose any risk to human or animal health, to plants or to other microorganisms. Although strains we use in our lab work have antibiotic genes, but they can still be killed by other common antibiotics. We only use E. coli and we will have disinfection after the experiment.
c. Risks to the environment, if released by design or by accident?
No. Since E. coli K-12 are ubiquitous in the environment, they won't endanger any regular species in the environment.We only use E. coli and we will have disinfection after the experiment.
d. Risks to security through malicious misuse by individuals, groups, or countries?
No. We only have the directional optimization of promoters and use GFP to characterize them. GFP won't do any harm to the safety and health of the public and the environment.
5. If your project moved from a small- scale lab study to become widely used as a commercial/industrial product, what new risks might arise? (Consider the different categories of risks that are listed in parts a - d of the previous question.) Also, what risks might arise if the knowledge you generate or the met hods you develop became widely available? (Note: This is meant to be a somewhat open - ended discussion question.)
Using site-specific mutagenesis of genes might bring in safety problems, so strict treatment of waste is required in commercial production. Besides, the methods we use are widely used in the lab, and they won't cause any disadvantages if used properly.
6. Does your project include any design features to address safety risks? (For example: kill switches, auxotrophic chassis, etc.) Note that including such features is not mandatory to participate in iGEM, but many groups choose to include them.
No.
7. What safety training have you received (or plan to receive in the future)? Provide a brief description, and a link to your institution's safety training requirements, if available.
Yes,every member of our laboratory received biosafety training including standard laboratory operation and WHO Biosafety Manual training before the experiments. All members learnt about the "C3H3"which is well known in the college of chemistry and chemical engineering. http://210.34.15.138/rule/10384_2_c_18.pdf
8. Under what biosafety provisions will / do you work?
a. Please provide a link to your institution biosafety guidelines .
http://210.34.15.138/rule/10384_2_c_18.pdf
b. Does your institution have an Institutional Biosafety Committee, or an equivalent group? If yes, have you discussed your project with them? Describe any concerns they raised with your project, and any changes you made to your project plan based on their review.
No, we haven't discussed our project with an Institutional Biosafety Committee, but we discussed the safety problem with our instructors and confirmed that this project is safe enough if experimental rules are strictly observed.
c. Does your country has national biosafety regulations or guidelines? If so, please provide a link to these regulations or guidelines if possible.
http://english.biosafety.gov.cn/Center/200511/t20051101_13462.html
d. According to the WHO Biosafety Manual, what is the BioSafety Level rating of your lab? (Check the summary table on page 3, and the fuller description that starts on page 9.) If your lab does not fit neatly into a category 1, 2, 3, or 4, please describe its safety features [see 2013.igem.org/Safety for help].
Level 1.
e. What is the Risk Group of your chassis organism(s), as you stated in question 1? If it does not match the BSL rating of your laboratory, please explain what additional safety measures you are taking.
Risk group 1.
Faculty Advisor Name:
Fang Baishan
Faculty Advisor Signature:

iGEM Software Division Coding Practices Questionnaire
1. Are you using the iGEM Software repository at github.com/igem software? If you have instead stored your code elsewhere, please explain where and why you have put it there. If your code is not in the iGEM repository, are you using any version control system such as Git, CVS, or SVN?
E' Note is a web software using SVN and Brick Worker is biobrick evaluation software which will use the iGEM Software repository at github.com/igemsoftware.
2.User Data
a. Does your software store any private data supplied by the user? (For example: the user's name and email address, passwords, DNA sequences, circuit designs, etc.) If yes, please describe what kind of data is stored. If no, skip the rest of this question and move on to question 3.
Yes, E' Note stores users' name, email address, passwords and experimental data that they submit. And Brick Worker doesn't store any private data.
b. What is the URL or IP address where the user's private data is stored? Where is the physical computer or hard drive that contains the user's private data?
E' Note's URL is http://sae.sina.com.cn/ that store the user's private data. It is the SinaAppEngine which is a Cloud platform made by sina corporation that contains the user's private data.
c. Please describe any encryption, password protection, etc. that you use to protect the user's data. (It is not mandatory to have such protections, but if you do, describe them.)
Because we rent the SinaAppEngine to make E' Note's application active, the user's private data is wholly stored in its cloud storage which will be protected by a group of safety professionals.
3. Does your software include any other security features? Please describes them here.
No, E' Note is in virtue of SinaAppEngine to make the most powerful protection and Brick Worker is to evaluate and analyze the biobrick sequences and does not include any storage of the user's data.
4. Does your software let the user create a design by choosing parts/genes from a list/database, such as the Registry? If so, which lists/databases are included? Is there any restriction on which parts/ genes the user can choose?
Yes. For Brick Worker, in the primer design part, we allow the user to choose transcription factors and add transcription factor binding sites (TFBS) to the primer sequences, and the TFBS data is derived from RegulonDB.
5. Does your software allow users to write new data into any public lists or databases? If so, do you check the new data for errors before allowing it to be written?
No.
6. Does your software include any other features that encourage the user to create safe designs? Please describe them here.
Yes. Our Brick Worker help user to locate the essential part of promoter and RBS so the user can design mutation in these sites to improve the quality of the biobricks and in the protein coding sequences optimization part our software automatically optimize the protein coding sequences to a higher expression level.
Lectures on Synthetic Biology
We collaborated with the Chemical Society of Fujian province to successfully hold a wide array of activities for a high school' s summer camp in our university. On July, 16th, 2013, lectures themed with synthetic biology and iGEM were made available to all the high school students in the summer camp. The number of high school students is more than three hundred.
The outline of these lectures included the basic concepts of synthetic biology, introduction of iGEM, its safety requirements and other experimental techniques. We tried our best to illustrate what is iGEM in great detail: from the very idea of synthetic biology to a potential and developing subject.
After the formal lectures, interaction part started in which the high school students could learn more biological knowledge with fun. Our team members interacted with the high school students actively: answering questions about synthetic biology, sharing experience of iGEM competition as well as further encouraging them to participate in iGEM.
In addition, we tried to emphasize the aspect of safety from two parts of our activities. One was that we would make. We made sure that the software or the bacteria which we used or created were harmless. The other was the safety of information. Our software which owned the security certificate would protect our users' private information from violating.


During the lectures, we handed out questionnaires pertained to synthetic biology and iGEM to approximately 300 high school students. Contents of the questionnaires were mainly about the iGEM and the safety issues. The surveys indicated that about 82% high school students had a great interest in Synthetic Biology but few of them know this international competition which urges us to do more to extend the influence and promote the development of iGEM in China. Notably, approximately 90% of the students were most concerned about safety issues. Hence, we believed that the first step to the popularization of iGEM among Chinese high schools was illustrating its safety to its potential participants.


Synthetic-Biology-Theme Campus Party
In order to propagate synthetic biology and iGEM, the Synthetic-Biology-Theme Campus Party was held in Guihua Building in our campus on July 17th 2013 from 2 pm to 5 pm oriented to the high school students in the summer camp.
Theme show of synthetic biology was the first section of the party. We introduced the basic conceptions of synthetic biology, its safety issues, as well as iGEM competition to our high school the audience systematically. The attractive presentation won enthusiastic acclaim from the audience as well as a bunch of feedbacks. In the same time, we emphasized the security of synthetic biology and our software again in this introduction. We all believed that the security policy was the cardinal and fundamental thing of iGEM.
The second section of our party was the game which included lantern riddles, finding differences in DNA, Fold-it, and Biological-Sha.
Guessing the lantern riddles was a traditional Chinese game. We handed out some synthetic biology riddles designed for biology education specifically. For example, one of riddles describted the question as 'the bottle which is full of alcohol, not used to light.', and the answer corresponded to an alcohol lamp. Besides, some riddles were about security facilities in labs. We prepared many gifts for students who got the correct answers and tried to recall their memory that we introduce in the first section by this method.
Another game, Finding Differences in DNA, was a challenging game which required both perspicacity and memory. The object of this game was finding out all the tiny differences in a set of DNA pictures as soon as possible. Hard though it seemed, a whole bunch of high school students showed great interest in it. In the meanwhile, the procedure of finding differences helped them to familiarize with DNA sequences.


Fold-it was a computer game in which you can see the structure of a certain protein and fold it in order to make it to achieve the most stable state. The score of this game was measured by the stability of the protein. (link: ) We deem Fold-it a great approach to reverse the current trend that so many high school students were increasingly addicted to electronic games toward a better direction that games can also serve as a vehicle for imparting knowledge. Students could have fun while learning the determining factors of the stability of proteins.


The last but not least game was Synthetic-biology-sha, which was redesigned by us based on an extremely popular card game Sanguosha. The card in this game, for instance Bacterial Quorum Sensing card, was designed on the basis of theory of synthetic biology. While enjoying this card game, high school students actually learned some principles about synthetic biology. As well, some safety rule were introduced as long as playing the card games.
In the end, we took a photo of the autographs of the students. We will keep these busy but happy days on minds for our all lives. It will be a strong pushment for us to be better and do more effort in sharing advanced technology with young people and keeping everything safety and security!


Experience sharing
April 5th, 2013, we had the honor to welcome a former leader of iGEM team of Peking University, Haoqian Zhang to come to Xiamen University with the intention of deepening the communication between our two universities’ iGEM teams. During his visit, Zhang joined our two teams in the brainstorm and provided valuable comments on the team members’ ideas in terms of feasibility, safety, originality. Zhang also gave us a brief introduction about his own iGEM projects from which we benefited greatly.
“That which does not kill us makes us stronger.” Zhang said when he reminisced about the difficulties he confronted during conducting his iGEM project.


June 24th, 2013 witnessed another cheering gathering of communication and collaboration between Nanjing University' s iGEM team and us. After a short sightseeing tour around our unfailingly beautiful campus, we had a meeting during which the projects of both teams of Xiamen University, i.e., the cell oscillation circuit and the brick worker were introduced to Nanjing iGEMers. After that, an intense discussion was started on the feasibility and safety of these projects on which Nanjing iGEMers kindly offered their suggestions. The jubilant gathering ended with genuine blessings and encouragement for each other. Nanjing iGEMers, we hope to see you in the World Championship again!


Do you want to know more about our activities and iGEM? Come to Xiamen and have fun with XMU_Software iGEMers!
E' NOTE effects on Human Practices
In this season, XMU-Software Team successfully created an assessable synthetic software E' NOTE for standardizing the logs of experiments and guiding new iGEMers to the world of synthetic biology.
We modularize the procedure of experiments in this GUI app which provides a series of standard tables of wetlab that investigators could use to record their schedules, graphs and other data easily. According to our design, every team member would be directed by our produce once they started their project. It means that our program largely reduces the difference among new iGEMers from different backgrounds and helps them to catch up with their project quickly. In the meanwhile, E' NOTE is also a communication platform opened to all participants not just in one team but furthermore, in different teams where they could share their electronic journals and experience. This new function dramatically breaks the barrier among countries and encourages students to transcend traditional discipline boundaries to push iGEM and synthetic biology forward. In a word, our project strongly improves the development on different area and field.
Wall painting of Synthetic Biology
One of the Xiamen University' s main tourist attractions, Furong Tunnel which attracted more than 1,000 tourists per day, was chosen as the place for wall painting of the slogan and symbol of our iGEM team. Epitomizing the core elements of iGEM software team -- software and synthetic biology, our wall painting mainly represents a combination of biology and computer language. We believed that the safety needs a good cooperation between wet lab and dry lab. This wall painting had attracted hundreds of passengers to take photos for it. Furthermore, some of them asked us for more information about iGEM when we were painting.

Our Human Practice activities turned out to be a brilliant and unquestionable success. It provided a bridge for communication among domestic iGEM teams, a platform for showcasing the definite charm of synthetic biology, a joyful gathering of all the former, present, and of course future iGEMers.


3.30.2013
Chen: Experimental workspace can automatically decide whether it is a personal account or a business account of networking and the workspace affords the download link of those relevant software. Can we get those software embedded? How to help our customers find out the software they want quickly? (By searching them?) It is also important to process data and generate lab reports and logs in the workspace.
Future plan: We plan to add software in the software library, optimize the software's functions and landscaping interface. Besides, we want to afford real time data while monitoring on different platforms. And how about syncing to the cloud?
Qiu: Easy Express. The software is designed to save time for users. Then they just need to stay on creating new ideas and putting a possible idea into practice. In addition, unified expressions get researchers to understand other's work easily. Its system's function: drawing, display sequences, dynamic display structure of the plasmid and parts of the experiments, shows the meaning of each graph and table, guiding and help. The challenge for us is that whether we can dynamic display the data? If we standardization of the presentation, the software may be rejected by other teams for its boredom standardization separate kinds of efforts may be impossible. This software told you that you don't need to learn MAYA and other magic software, it can include their functions. Will it be possible? (Perhaps unattainable for now) The idea may be realized by attaching the database to the software and affording individuation information search for our users.
Wang: Document management and real time monitoring can help you on scientific literature management, take notes and share your ideas. It can also automatic detection and data recording of streamlined repetition, design shortcut keys to improved operational efficiency. Thus, users can use graph visualization to understand the data easily.
Zhang: She had done a lot of work on directional optimization of BioBricks.
Purpose: Inputing environmental parameters include special loci genes, the expected expression level and chooses candidate BioBricks. Optimize and find out the best sequences under given conditions and setting number of evolutionary (n) chooses the BioBricks, and the system will guide users until the given conditions are met, variation to generate different sequencess. Copy, retain or reject BioBricks according to the matched-degree, this step is parallel to natural selection. Circulation stops after n times circulations, output the best sequences. The problems are how to make sure that the genotype equals its phenotype? How to define the f(x) that we want? And now we need to read some books about the genetic algorithm to get the way.
Summary: Now we have two ideas. One is to build a platform for researchers that focusing on synthetic biology (aim to increase their efficiency). Former researchers have already done some researches about it, so it might be a rat race.
Solve synthetic biology problems with GA. We need to supplement relevant basic knowledge of GA. So, studying CLOTHO developed by Berkeley and other universities and try to find out some flesh ideas and make a research to find out what front-line researchers need. We also need to study pertinent software and GA, protein quaternary structure and knowledge about directional optimization, read more books and literature to make sure the possibility of the idea. GA is too difficult for some of us. We still need to get come up with some novel ideas.
OK, for so many tasks, work in groups and share additional ideas~!
2013.4.7
Zhang had learnt GA. Also, we read the news about Calgary and Newcastle, SUSTC(calculate terminator efficiency by a score system). Code is linked up with fitness, which influences the secondary structure of protein. For example, the changing of a-tail, stem loop and T-tail, we can also find it in the project of SUSTC. Additionally, she also read papers on how to calculate f(x) & take notes when learn new things. SUSTC' fault: Just one function, it may not catch everybody's eyes. She plans to change promoter so as to confirm the system efficiency. Jianxing schedule to learn neural network, after that, he will change the source code to be used on today's system. Huang Xin and Huang Jian now know just a little about Matlab, but they think the code can be changed easily. Wang learned Matlab as well. Tang Chun read some books about system efficiency and downloaded papers to share with others. From N-terminal domain rule, he noticed that choose the parameters is a key point for our project.
Next week's task had been written on the wall. And we suggest everybody to use PowerPoint to explain their ideas.
2013.4.14
Specific our goals: For most of us aren't familiar with GA. We misunderstand the idea at the beginning. We determined to find the best fit BioBricks through genetic recombination and variation inside the BioBricks, and we evaluating them by our algorithm. Compare with other team' work: EbolGENTS (2008, Calgary) and Evolutionary Algorithm (2008, Newcastle University). Both of them had used GA, however, they construct a system with given BioBricks just like build blocks, after which they find the best system in those "structures". As for our group, we focus on genetic recombination and variation inside the BioBricks to make further ones, and search for the best with given conditions.
Reduce the degree of difficulty: it may be a huge project to ensure phenotype and fitness result from mutations of the base sequences in the whole BioBricks. So we decided to narrow down and aim at optimizing the decision of particular bases, promoter, terminator and RBS locus. Yijuan had mentioned that SUSTC had done research on computational efficiency of the Terminator's gene sequences.
Core problem: How to ensure phenotype from genotype? How to find the f(x) meet our goal? Fitness function: three ways had been chosen to solve it: first, search for relevant literatures; read the project offered by Professor Fang named “microorganism’s choice of the optimal conditions"; if possible, our wet lab should give us a hand on affording real time data and experimental simulation to ensure f(x).
Current task: Check the project of iGEM "calculate terminators efficiency by the sequences of the terminators”; all of us need to take a look at SUSTC' work and discuss the next time. Learning Matlab and GA!
Annotations: We had set sail now! All of us need to learn SUSTC's work on ensuring genotype by phenotype and discuss the next time. We are badly in need of professor's help!
Try to find more idea! Stay hungry!
2013.4.21
This week we had a summary of the work we had done before and nowadays we need to fix it. GA as an algorithm can work on several biological questions. And several new ways and improvement had been found out to solve the problem. Take an example, GASCO is a new algorithm that improves the answer of GA.
We start the preparation for the human practice. That may be of great importance. We had to distribute the job and explicit the goal so as to lift efficiency.
Neural network can be used in it.
2013.4.28
Zhang: After reading several papers, she got down to SBOL. She got some new ideas on our program.
Han Tao & Huang Jiang & Huang Xin: They had successly got a software that can simulate the situation. However, software remains some problem to be solved. We had better make a new one, do not use this one, for we can use Matlab. That will be a good idea.
Platform and relevant work went well.
2013.5.5
Most of us take a rest after long hours.
2013.5.12
This week, we will be divided into two groups, one named design group and another one Matlab group. For the first group, they need to finish most of the work on the design. Our logo, clothes and slogan will be their works. What’s more, the platform and the wiki to show our achievement require them to try their best to do it. For the second group, they must continue working on the software and try to improve existing algorithms.
We had got some ideas on human practice and the next step was to check if they can be carried.
2013.5.19
Design group:the wiki has been designed and we are now considering combining wet lab's
Design group: The wiki has been designed and we are now considering combining wet lab's work with ours. Han Chen had done a lot work in the wet lab and found out what problems they met. We will finish the Wiki in the next few days and afford some tools for users.Matlab group: They had already written part of our software and challenging it. We test it and find that its interface is not friendly and difficult for users to master it at the first sight. And we will call for help from the design group. Also, for the semifinals is nearby. We need to take a break.
2013.5.26
Huang Jiang &Huang Xin: They learn C++ and try to make a program. They learn different kinds of arithmetic and compare them to find what we need. GASCO and some additional algorithms are inconsideration.
Zhang: She had already found software that can help us to solve those problems. In additon, she also focuses on SBOL and finds out the way to solve some easy problems we put forward before.
Zhang Shiqi & Wang Chuyue: They had already used GA to make a program and test it. However, we think they need to make more progress so as to up to standard.
Qiu Likai & Chen Yuezeng: The software had been finished and they are designing the wiki and writing codons. That might be finished in two months.
Huang Jianxing: He read and found some papers of Codon usage bias. He should have been better. NCBI is of great importance if we write a software ourselves. And we need to know how to make use of the data in NCBI.
2013.6.2
Lin shen: Codon bias database is important for our works. We need to use Latin to search for the correct sequences for the organisms. NCBI had been downloaded and can be imported.
Chen Han: Everything goes well. He starts to prepare for the human practice.
Zhang Yijuan: She had already explained the meaning of RBS. And figure out the way that how to evaluate it. That idea had been written and be used in our software.
Hon Yuming: He drew something and had got the idea of doing so. The logo design is the handle. And the logo design influences the next step and we shall finish it ASA possible.
2013.6.9
Exam week. So call off.
2013.6.16
Exam week. So call off.
2013.6.23
Zhang Yijuan had distinguish general transcription factors, recognition of inductivity transcription. Improving by similar software. Then she will import the database and check them one by one. So we need to know how to call PWM from the database. On sigma factor, statistic PSFM model by using a neural network will be a good way. We know that the best length requires a certain distance. No ready-made matrix, we had to write one. She will read papers about RBS following. Huang Jianxing & Huang Jiang & Lin shen & Han Tao had read to know the basic knowledge. Cheng Han finds papers on Sigma 70 & do some work on how to build an experience platform that suits user’s need. He improves and redoes the platform to make a new model.
Team member Yijuan Zhang reported our software project (mainly for evaluating of promoters) to Mrs. Wu. We received several suggestions from Mrs. Wu. To enhance the accuracy of our software work, we are supposed to pay attention to the false positives raised during recognition of promoters. And to further improve our promoter-evaluation program, Mrs. Wu suggested that we do some research on some distinct promoters besides E. coli promoters. On the entire Wu applauded progress we had achieved and encouraged our software team to do our wonderful jobs as always.
Summer camp, garden party, Cathedra of synthetic biology, card game, Foldit and lantern riddles will help us to introduce iGEM to people. Monetary reimbursement includes the registration fee. Numberous matters need attention: like travel expense, laboratory items, office supplies, car fare. Printing and copying cost should label the amount of money. Qiu & Chen made the concept map and interface of our software. Huang Xin makes use of the software that we wrote before. Then he will look for more papers of sigma 70.
2013.6.30
Arithmetic software team on evaluating and optimizing BioBricks held a meeting and report our progress and current problems to former iGEMer Youbin Mo. Mo listened to our program with extreme concern and appreciation and taught one of our team members to use an artificial neural network to build weight position matrix for Sigma motifs. We discussed the difficulties in front of us, which is mainly about the refinement of our algorithm and how to store and use data from database to RDB. We decide to concentrate on improving the algorithm. In addition, Mo suggested that we start to present our slides in English and make a summary of our theories so as to post them on our wiki.
Easy Note is the software based on Web, which is designed to convenient biosynthetic researchers to do some experimental record and query information. After registration and login, users can do some rudimentary records, related database and background program and so on.
Because the interface is too monotonous, and the function is too simple, we plan to design a succinctly and naturally interface and add query information, timing function, set, import and export document in the resulting month.
2013.7.7
Han designed small icon so that the interface will be more beautiful. Small icon included addition, delete, document, tool, and set, text, picture and so on.
Qiu had successfully realized login in and registry database. At the same time, he coded the data board. Chen had written code for the interface including addition, delete, document, tool function. Nonetheless, it is still not enough perfect because of various reasons. What to do next will be discussed at tonight’s meeting.
Huang Xin learned that we can deal with the data from the database using Matlab.
Han Tao refined our algorithm to evaluate promoter strength on Java and try to run some existing software designed to improve protein coding sequencess.
Zhang Yijuan started to learn theories on RBS and its prediction. By looking up to literatures, we find several factors which can influence the RBS strength including the SD sequences, spacer length, initiation codon and secondary structure. And we come up with algorithms similar to the algorithms used in the promoter part which take 3 factors, namely, SD sequences, spacer length, start codon into account. And we’ll study the impact of RBS structure on its strength next week.
Rao has built a database in access containing all the transcription factors’ binding sites and we are now discussing how to use this database in our software.
2013.7.14
To improve the login interface and the registry interface, Chen designed a fresh style’s interface which had divided into four sections and had used an irregular design. When clicking one section, this section enlarged so that the interaction effect was better. Kai made the numerous efforts to improve the database. Because the database is problematic, he spent a lot of time for it so he stayed up late sometimes. Next week, we will improve the function and interface.
Zhang figured out the algorithm to calculate the binding free energy between RBS mRNA and 16s rRNA and Han Tao started to write code for it at once. Now we have a simple program for calculating the binding free energy. So far we have worked out two algorithms to evaluate RBS strength.
2013.7.21
Zhang put forward 2 methods to evaluate RBS strength. The basic method is to use the PWM (position weight matrix) of the SD sequences and the spacer length between the SD sequences and start codon to calculate the relative strength. The second is to calculate the binding free energy between the RBS mRNA and the 16s rRNA in the ribosome.
Han Tao, Huang Xin and Rao are working together on the program code.
Qiu had finished the record module that we can add text, photo, table and so on. Because the record interface isn’t too concise, we should improve in the next week. At the same time, import and export function had accomplished. In the process of programming, we met with numerous difficulties. For completing the task better in the subsequences stage, Chen studied the jQuery. Next week, we will continue to work hard.
2013.7.28
HanTao began to deal with the GUI of the promoter evaluation part of our project.
Rao decides to inlay the BioBrick sequences data in our software as a text file.
ZhangYijuan had put forward the problem of how to determine the weight of motif similarity and spacer length score in the strength evaluation algorithm .After consulting with QiuRuosang, Zhang and QiuRuosang began to design experiments for the data needed to modify as well as validate our algorithm to evaluate both the promoter and RBS strength.
After the end of the third semester in this week, we invest a lot of time for the software production. Qiu had finished and modified the function of adding a photograph, table, step and the text. Difficulties in the database exceed we imagine. With increasing a lot of novel effect, login interface had been modified by Chen. Next week, we will tidy up the code for easier to read and improve the existing functionality.s
Before, we have been entangled with the problem that how to get the position frequency matrix of Sigma promoter motifs (we have only obtained the data of sigma 70 and sigma E promoters from literatures). This week, after deliberate discussion, we come up with an idea that we can use the consensus sequences provided in literatures and promoter sequencess in RDB to calculate the matrix by ourselves. Han Tao and Zhang are in charge with this little program and now we have worked out the frame of the program and have tested it using the data of sigma 32. There is more work to be done to refine the program and make our position frequency matrix more reliable.
Members of our software team are doing experiments in the lab this week.
Group of Protein experienced a tough time these weeks. In 21th, July, we decided to apply the algorithm of patent 200780024670.5 in further work. However, concern on sort of using the patent delayed our pace forward.
After communication with Prof. Fang this week, we stick to the direction and all neglected tasks are being undertaken. Unfortunately, things don’t go smoothly as expected.
Jianxing Huang employed data from NCBI (database) and paid enormous efforts on changing sequences files to FASTE files. He exerted himself in making the algorithm programmable by understanding the patient in detail.
Tao Han went home, but he was still making attempts to program the available parts.
Zach Lin went home as well, in which the documents cannot be downloaded, only doing his endeavor to read limited documentary sources online.
Next week:
Jianxing Huang will find out and download all those parameters mentioned in the algorithm from the database.
Examples will be made by Jiang Huang to explain the algorithm and make the main idea of the program possible.
Tao Han tends to begin compiling the computer program.
Zach Lin wants to blend an innovative point into the algorithm by scanning lots of papers.
The week we had finished the elementary function so that user can use our software by registering. We named the software for “E’Note”. User can add and delete an experiment, add step, add text, table, photo and so on.
Qiu had put the software on the line. Chen had finished one of the experiment formwork that the user can utilize directly. However, the tool hadn’t finished which we will work hard next week.
Frist, we had uploaded the wiki of team project descriptions to the iGEM server. It is beautiful but half-baked, so we decide to make the wiki after the platform is done, maybe in mid-August. Second, we designed a series of models of experimental record, and we are adding them to the platform as a different function. Users can add a model for recording experimental data efficiently. Third, the innovative design of platform’s interface is made. We will improve the interface according to it.
Most of the software function had been completed and the users can use it. We will improve some function that not good enough next week. Before the ensuring Wednesday, we will give instruction and the users can use the software more efficient. We plan to make a community post at iGEM official page and received responses from other iGEM teams who use our software.
That was a funny day. We discussed how we can make full use of things to make a mascot. Additionally, we sat around and have a brainstorm, after which we got the idea of how to record the introduction movie. Together we put forward a lot of helpful ideas and funny tips. Hong planned to draw more than 1000 pictures! That was amazing!
And for distinct parts of our wiki, the job was distributed to five members and each one had to draw the scheme quickly. After that, they need to discuss with our designer Hong to know whether the idea can be achieved or not.
For this is the last month for us to prepare for the iGEM. We are now ready to start preparing for our speaking. That was really a hard work. Thus we need to know what other teams had done before. So we downloaded their videos and carefully watching them. That may help us on make a good presentation.
We have got the idea on how to make the PPT for our presentation. Besides, this week, we also made some instruction books for users to use our software. We also worked on the wiki to make sure that we will be able to show it to teams from all over the world. Our designer, Hong, had drew so many graphs to beautify our wiki. There is still so many problems need to be solved in the last two weeks. We need to hurry up! Keep on!
This week, we tried to give a presentation to our guiders. They offered us some good suggestions. We need to beautify our PPT. That’s a hard but interesting work. That’s a challenge for us. And we believe that we can finish the job by our hard working!
This is the last week for us to finish the wiki. We took turns to have a rest and keep on practicing our presentation. On the other hand, all of us were devoted in the work so as to get the gold medal someday in the future. Just like what Jobs had done to the world, we will to change the world with our software. We are too hurry to hear the news that we are given the gold medal in MIT. We are the best and we had change people’s opinion on iGEM. Keep on going, my guys!
General Protocols
1 Stock solution
50 mg/mL Ampicillin
-0.5 g Amp, 10 mL water, filter sterilize with millipore express membrane, freeze in aliquots
50 mmol/L Arabinose
- 0.1876 g Arabinose, 25 mL water, filter sterilize with millipore express membrane.
2 Preparation of Competent Cell
Thaw an aliquot of cells (without any plasmid in them) on ice
- To 20 mL of sterile LB, add 100 μL aliquot of the thawed cells: remember, this LB does not have any antibiotic in it, so work as aseptically as possible (i.e. autoclave all solutions and use sterile pipettes).
- Grow cells in the shaker at 37 ℃ and 200 rpm, until they reach an OD600= 0.3 - 0.4. This usually takes 1.5 - 2 hours.
- Ice down the LB with growing cells for 30 min.
- Aliquot into sterile 1.5 mL tubes and spin down at 1500 xg for 5 min at 4 ℃; discard supernatant.
- Ice down Solution A and Solution B of TaKaRa Competent Cell Preparation Kit during centrifugation.
- Gently resuspend each pellet with 100 μL Solution A.
- Centrifuge 1500 xg for 5 min and discard supernatant.
- Resuspend each pellet on ice in 100 μL Solution B.
3 Transformation
- Add 10 μL of DNA. Swirl gently with pipette.
- Incubate tubes on ice for 30 min
- Heat pulse tubes in 42 ℃ water bath for 90 s.
- Incubate on ice for 5 - 10 min
- Add 400 μL of LB broth to each tube and incubate for an hour at 37 ℃ with shaking.
- Spread 100 μL of each culture on an LB agar plate containing the appropriate antibiotics and incubate overnight at 37 ℃ (spread using beads).
4 Plasmid Purification
- Centrifuge sample in eppendorf tube approximately 1.5 mL at a time, draining off supernatant after each spin and adding more cell solution.
- Resuspend the pelleted cells in 250 μL of the resuspension Solution (mixture with Solution I and RNasa A). The bacteria should be resuspended completely by vortexing or pipetting up and down until no cell clumps remain.
- Add 250 μL of the Lysis Solution (Solution II) and mix thoroughly and gently by inverting the tube 5-6 times, letting it stand for 1-2 min at room temperature until the solution becomes viscous and slightly clear.
- Add 350 μL of the Neutralization Solution (Solution III) and mix immediately and thoroughly by inverting the tube 5 - 6 times.
- Centrifuge for 10 min at 12,000 rpm to pellet cell debris.
- Apply the supernatant to the supplied spin column by decanting. Avoid disturbing or applying the white precipitate.
- Centrifuge for 1 min at 12,000 rpm. Discard flow-through and place the column back into the same collection tube.
- Add 500 μL of the Wash Buffer PB to the spin column. Centrifuge for 1min at 12,000 rpm and discard flow-through. Place the column back into the same collection tube.
- Add 500 μL of the Wash Buffer W to the spin column. Centrifuge for 1min at 12,000 rpm and discard the flow-through. Place the column back into the same collection tube.
- Repeat the step 9 again.
- Discard flow-through and centrifuge for an additional 3 min to remove residual Wash Solution.
- Place the spin column in a clean 1.5 mL centrifuge tube, and pipet 20 μL Elution Buffer TE (prewarm to 60 ℃) directly to the center of the column without touching the membrane. Let it stand for 2 min at room temperature and centrifuge for 1 min at 12,000 rpm.
- Discard the column and store the purified plasmid DNA at -20 °C.
5 Standard BioBrick Assembly
- Digestion of insert: 2 - 5 μg DNA / 100 μL volume, 10× H buffer, EcoR I, Spe I. Digestion and inactivation. Clean up the insert via gel electrophoresis. When cutting the insert out of the gel, try avoiding staining or exposure to ultraviolet light of the insert.
- Digestion of vector: 2 - 5 μg DNA / 100 μL volume, 10× M buffer, EcoR I, Xba I. Digestion and inactivation. Clean up the insert via gel electrophoresis. When cutting the insert out of the gel, try to avoid staining or exposure to ultraviolet light of the insert.
6 Suffix Insertion
- Digestion of insert: 2 μg~5 μg DNA / 100 μL volume, 10× M buffer, Xba I, Pst I. Digestion and inactivation. Clean up the insert.
- Digestion of vector : 2 μg~5 μg DNA / 100 μL volume, 10× H buffer, Spe I, Pst I. Digestion and inactivation. Clean up the vector.
7 Ligation
- After digestion and clean-up, the next step is ligation.
According to the ligation equation of Insert/Vector=3 mol/mol, combine the vector, insert, 10× T4 ligation buffer and 1 μL of T4 ligase in a 10 μL reaction overnight at 4 ℃.
8 Gel Extraction
- Weigh a 1.5 mL centrifuge tube for each DNA fragment to be isolated and record the weight.
- Excise gel slice containing the DNA fragment using a clean scalpel or razor blade. Cut as close as possible to the DNA to minimize the gel volume. Place the gel slice into a pre-weighed 1.5 mL tube and weigh. Record the weight of the gel slice.
- Add Bing Buffer BD at a ratio of 100 μL of solution per 100 mg of agarose gel slices.
- Incubate the gel mixture at 55-65 ℃ for 7-10 min or until the gel slice is completely dissolved. Mix the tube by inversion every few minutes to facilitate the melting process. Ensure that the gel is completely dissolved.
- After the dissolved gel mixture cool down, transfer it to the Spin Columns assembly and incubate for 2 min at room temperature.
- Centrifuge the Spin Columns assembly in a microcentrifuge at 12,000 rpm for 1 min, and discard the flow-through.
- Wash the columns by adding 500 μL of Wash Buffer PE to the Columns. Centrifuge the columns assembly for 1 min at 12,000 rpm, and discard the flow-through.
- Repeat step 7 again.
- Centrifuge the Columns for an additional 3 min to completely remove residual wash buffer.
- Empty the Collection Tube and recentrifuge the column assembly for 1 min with the microcentrifuge lid open (or off) to allow evaporation of any residual ethanol.
- Place the spin column in a clean 1.5 mL microcentrifuge tube, and pipet 20 μL deionized water (pH is 8.0 - 8.5 and prewarm to 60 ℃)directly to the center of the column without touching the membrane. Incubate at room temperature for 2 min.
- Centrifuge for 1 min at 12,000 rpm. Discard the columns and store the microcentrifuge tube containing the eluted DNA at–20 ℃ .
9 Restriction analysis
- Combine H20, 4μL of dNTP Mixture, 10×Ex Taq Buffer, 0.25μL of Ex Taq, 1 μL of VR primer, 1 μL
of VF2 primer and pick the colony in a 25 μL reaction for PCR.
- Gel electrophoresis.
10 Genetic mutations
1. Design the primers with mutation.
2. PCR.
- 0.25 μL of Pyrobest DNA Polymerase (5U/μL).
- 5 μL of 10 x Pyrobest buffer II.
- 4 μL of dNTP Mixture (2.5 mM each).
- 1 μL of Primer 1 (20 uM).
- 1 μL of Primer 2 (20 uM).
- 0.01 – 1 ng Template.
- Add ddH2O up to 50 μL.
3. PCR condition.
- 94 ℃ for 30 s, 55 ℃ for 30 s, 72 ℃ for 5 min . circulate for 24 times.
4. Run the gel and do the gel extraction.
5. Blunting Kination.
- 1 pmol of DNA Fragment.
- 2 μL of 10 x Blunting Kination Buffer.
- 1 μL of Blunting Kination Enzyme Mix.
- Add ddH2O up to 20 μL.
- Reaction under 37 ℃ for 10 min.
- Reaction under 70 ℃ for 10 min.
6. Ligation.
- Take 5 μL reacting solution into a new PCR tube.
- Add 5 μL Ligation Solution I.
- Reaction under 16 ℃ for 1 h.
- Transfor the reacting solution into 100 μL competent cell.
Characterization
Fluorescence Measurements
- The samples to be tested are cultured from plates in 20 mL of the Basal Minimal Medium with appropriate antibiotics and incubated overnight at 37 ℃ at 200 rpm.
- The culture is checked for OD600 next day and then subculture by the same medium with antibiotics at 37 ℃ shaking for 2 h.
- Add corresponding inducer at concentration gradients into the above-mentioned culture and keep on incubating. During the time incubating, every 15 min, take 1 mL bacteria liquid, then centrifuge the cells( 6000 rpm, 10 min ) and resuspend them in 1 mL PBS. At last, pipette to a 96 well plate.
- The plate reader made by Molecular Device then read.
- The program does the following:
- In endpoint reads, following measurements are taken in a time interval of 15 min: absorbance (600 nm filter) and fluorescence (485 nm and 520 nm for GFP).
- The results then transfer to excel sheet and interpret.