 "
"
Team:XMU Software/Project
From 2013.igem.org
YuezhenChen (Talk | contribs) |
|||
| Line 195: | Line 195: | ||
<h4>TFBS Location</h4> | <h4>TFBS Location</h4> | ||
| - | <p>We then | + | <p>We then tested the reliability of our software regarding TFBS location and results show that the correct site prediction rate is 64%. We used the sigma 70 promoter sequences with annotated -35 and -10 region provided by RegulonDB to test the correct prediction rate of the binding site of a specific transcription. We input 89 sigma70 promoter sequencess and ran our program to precisely locate the sigma factor binding site. </p> |
<p>The test results are as follows. The numbers represent the site of actual -35 motif, the actual spacer length, the predicted site and predicted spacer length, respectively.</p> | <p>The test results are as follows. The numbers represent the site of actual -35 motif, the actual spacer length, the predicted site and predicted spacer length, respectively.</p> | ||
<p><a href="https://2013.igem.org/Team:XMU_Software/promoter" target="_blank">Link to the page of results</a></p></br> | <p><a href="https://2013.igem.org/Team:XMU_Software/promoter" target="_blank">Link to the page of results</a></p></br> | ||
| Line 205: | Line 205: | ||
<p>BBa_K1070003:a c a t t g a t t a t t t g c a c g g c g t c a c a c t t t g c t a t g c c a t a g c a a <span class="light">g a t a a t</span> c c a t a a g a t t a g c g g a t c c t a c c t g a c g c t t t t t a t c g c a a c t c t c t a c t g t t t c t c c a t a c c g t t t t t t t g g g c t a g c | <p>BBa_K1070003:a c a t t g a t t a t t t g c a c g g c g t c a c a c t t t g c t a t g c c a t a g c a a <span class="light">g a t a a t</span> c c a t a a g a t t a g c g g a t c c t a c c t g a c g c t t t t t a t c g c a a c t c t c t a c t g t t t c t c c a t a c c g t t t t t t t g g g c t a g c | ||
</p> | </p> | ||
| - | <p>Subsequently, we measured the fluorescence intensity of these promoters and | + | <p>Subsequently, we measured the fluorescence intensity of these promoters and related it to the actual promoter strength. The experimental results are shown in Figure 8.</p> |
<div class="body_photo"><a href="https://2013.igem.org/Team:XMU_Software/FluorescenceOD600" target="_blank"><img src="https://static.igem.org/mediawiki/2013/7/74/XMUSOFTWARE_RFU.png"></a></div> | <div class="body_photo"><a href="https://2013.igem.org/Team:XMU_Software/FluorescenceOD600" target="_blank"><img src="https://static.igem.org/mediawiki/2013/7/74/XMUSOFTWARE_RFU.png"></a></div> | ||
<div class="body_photo">Figure 8 The fluorescence intensity reached a stable stage after 60 min. The fluorescence intensity is measured with the inducer, L-arabinose at 1 mM. The promoter strength is related to the relative fluorescence intensity compared to the control group (K206000 without the inducing of L-arabinose).</div> | <div class="body_photo">Figure 8 The fluorescence intensity reached a stable stage after 60 min. The fluorescence intensity is measured with the inducer, L-arabinose at 1 mM. The promoter strength is related to the relative fluorescence intensity compared to the control group (K206000 without the inducing of L-arabinose).</div> | ||
| - | <p>Then we | + | <p>Then we fitted the actual strength and the predicted strength, as can be seen in figure 9, the coefficient of determination is 0.8924.</p> |
| - | <div class="body_photo"><img src="https://static.igem.org/mediawiki/2013/ | + | <div class="body_photo"><img src="https://static.igem.org/mediawiki/2013/9/92/Xmu-software_profig9.jpg"></div> |
<div class="body_photo">Figure 9 The correlation between experimentally determined strength and the strength predicted by our program.</div> | <div class="body_photo">Figure 9 The correlation between experimentally determined strength and the strength predicted by our program.</div> | ||
</br> | </br> | ||
| Line 308: | Line 308: | ||
<h1>Results</h1> | <h1>Results</h1> | ||
| - | <p>We | + | <p>We used the RBS sequences listed on the iGEM registry with experimentally determined relative strength,<sup>4</sup> and the correlation between the RBS strength predicted by our software and the actual relative strength is strong, with a determination coefficient value 0.8039.</p> |
<div class="body_photo"><img width="800px" src="https://static.igem.org/mediawiki/2013/c/c7/Xmusoftware-RBSfig3.jpg></div> | <div class="body_photo"><img width="800px" src="https://static.igem.org/mediawiki/2013/c/c7/Xmusoftware-RBSfig3.jpg></div> | ||
<div class="body_photo">Figure 3 The correlation between actual RBS strength and predicted strength</div> | <div class="body_photo">Figure 3 The correlation between actual RBS strength and predicted strength</div> | ||
Revision as of 15:21, 28 October 2013

Abstract
In a promoter sequences, the sigma factor binding site and other transcription factor binding site affect the strength of binding significantly. For annotating promoters, some software was developed which mostly focused on the prediction of other transcription factors or one particular type of sigma factors but failed to analyze the promoter with both sigma factors and other transcription factors. 1-2 To solute this problem, a module of our software was designed which can analyze and evaluate promoters.
Our software use PWM method to calculate the similarity between promoter sequencess and the position frequency matrix of transcription factor binding sites (TFBS) to locate the TFBS as well as to predict the relative strength of the promoter. Promoter-Decoder overshadows its counterparts with all-round analysis and the prediction of promoter strength. It enables users to figure out promoter types, predict promoter strength, change it by mutating the key sites and even change the property of certain promoter by adding new TFBS to the promoter sequences.
Background
Sigma Factors
Bacteria encode several thousands of different proteins, which are necessary for normal cell functions or for adaptation to environmental changes.3 These proteins are not required at the same time or in the same amount. Regulation of gene expression therefore enables the cell to control the production of proteins needed for its life cycle or for adaptation to extracellular changes. The various steps during transcription and translation are therefore subject to different regulatory mechanisms.4
The most prominent step in gene regulation is the initiation of transcription in which the DNA-dependent RNA polymerase (RNAP) is the key enzyme. The RNAP or the RNAP core enzyme is the catalytic machinery for the synthesis of RNA from a DNA template. However, RNAP cannot initiate transcription by itself. Initiation of transcription requires an additional polypeptide known as a sigma-factor.5 Sigma-factors are a family of relatively small proteins that can associate in a reversible way with the RNAP core enzyme. Together, the sigma-factor and the RNAP core enzyme form an initiation-specific enzyme, the RNAP holoenzyme.

The sigma-factor directs RNA polymerase to a specific class of promoter sequencess. Most bacterial species synthesize several different sigma-factors that recognize different consensus sequencess.6
This variety in sigma-factors provides bacteria with the opportunity to maintain basal gene expression as well as for regulation of gene expression in response to altered environmental or developmental signals.
The frequency at which the RNAP holoenzyme initiates transcription, also known as the strength of a promoter, is influenced by the promoter sequences and the conformation of the DNA in the promoter region. The sigma-factors recognize two conserved sequencess in the promoter region, known as the promoter consensus sequences. Sigma-factors or fragments of sigma-factors bind specifically to promoter DNA sequences and by specific base pair and amino acid substitutions in the promoter consensus sequencess or sigma factors. Most bacterial species synthesize several different sigma-factors which direct the RNAP holoenzyme to distinct classes of promoters with a different consensus sequences. This variety in sigma-factors provides the bacterium with the opportunity to maintain basal gene expression as well as for regulation of gene expression in response to specific environmental stimuli.
The identification of bacterial promoters is an essential step in the elucidation of gene regulation.7
As a general rule, the more complex the life-cycle and environmental niche of a bacterium, the greater the number of sigma factors with corresponding promoter types. Typically however, the most common promoter type is that which regulates the housekeeping genes and the corresponding major sigma-factor is shared by all bacteria (sigma 70 in the well studied E. coli, and its homologues in other species). The binding site for the sigma70-family of promoters is defined by two consensus hexamers, TTGACA and TATAAT, located at approximately −35 and −10, respectively relative to the transcript start site (TSS) and spaced 15–21 base pairs (bp) apart2. RNA polymerase core enzyme associates with the major sigma-factor to form the holoenzyme which in turn binds to its cognate promoters to initiate transcription.


In prokaryotes, the minimum requirement for RNA polymerase binding is recognition of the promoter by the sigma factor. In general, prokaryotic RNA polymerases can interchange a number of sigma factors which bind and initiate different groups of genes.3
Transcription Factors

Sigma factors are essential for the transcription initiation in E. coli.10
In addition, promoter strengths are not determined purely by the binding of the sigma factor. Other transcription factors can bind specific sequencess surrounding or overlapping the promoter to either activate or repress transcription.4 The mechanism is transcriptional activators and repressors contribute to and detract from the accessibility of DNA by the RNA polymerase. 12
These transcription-regulating nuclear proteins bind to specific binding sites in the regulatory regions (e.g. promoters, enhancers) of the genes thus providing their activation or repression.

Computational methods of predicting TF binding sites in DNA are very important for understanding the molecular mechanisms of gene regulation.
The binding sites of the same transcription factor show a significant sequences conservation, which is often summarized as a short (5–20 bases long) common pattern called a transcription factor binding site (TFBS) or binding consensus. Our software aims to figure out the possible TFBS in promoters and precisely locate the TFBS so that the user may know the exact sites that play a role in regulating the transcription.
In prokaryotes (lower organisms without nuclei), there are fewer TFs, their motifs tend to be relatively long and the strength of regulation for a particular gene often depends on how closely a particular site matches the consensus for the motif. The more mismatches to the consensus in a binding site, the less often the TF will bind and therefore the less control it will exert on the target gene. So our software will calculate the similarity between the possible TFBS in the promoter and the standard motifs so the user will know to which extent the transcription factor will control the promoter transcription
Primer Design
To facilitate the design of PCR primers of various promoters, we've developed an additional function, namely, primer design in this part of our program. After inputting the promoter sequences, the software will figure out the most suitable primers based on the theory of Thomas Kämpke1, Markus Kieninger, and Michael Mecklenburg.13
Data Source
RegulonDB
Genes and operons that are under control of the same TF are members of that TF's regulon. Although methods for the prediction of regulons have been substantially improved, they are still far from perfect.
Comparative genomics tools can be used to predict regulons in bacterial genomes but the procedure can lead to incorrect regulon calling. Despite this drawback, several regulon databases are available that are based on comparative genomics methods and lack experimental evidence.
Probably the extended and accurate databases of regulons for E. coli are RegulonDB which provides the data source for our program.
Algorithm
Experimental results show that these are the strongest promoters that have been characterized in vitro so far and confirm the hypothesis that the consensus promoter sequences is "best". To calculate the similarity between the promoter sequences and the best sequences, we implement the PWM method6 in our program.
PWM (Position Weight Matrix)
Molecular techniques for the identification of promoters are both costly and time consuming, hence in silico methods are an attractive and well explored alternative. The most common in silico method to identify sigma 70 promoters uses position weight matrices (PWMs) and depends on the relative conservation of the transcription factor binding site (TFBS, or motifs ).
The algorithm can be divided into two parts regarding to the difference between the motifs of sigma factors and other transcription factors.

Part 1: the recognition of other transcription factors.7
Other transcription factors are proteins that can bind to a specific DNA sequences (motifs) and regulate the promoter's transcription. To recognize these possible motifs in a given promoter sequences, we calculate the Matrix Similarity Score (MSS) of every possible sites in the promoter sequences using the position frequency matrix of 86 transcription factors published by RegulonDB. The algorithm reports only those matches of a matrix that have got MSS higher than the settled threshold. And MSS for a subsequences x of the length L is calculated in following steps:


fi,Bi , frequency of nucleotide B to occur at the position i of the matrix (B ∈{A, T, G, C})

f imin , frequency of the nucleotide which is rarest in position i in the matrix

f imax , highest frequency in position i.
The information vector

describes the conservation of the positions i in a matrix. Multiplication of the frequencies with the information vector leads to a higher acceptance of mismatches in less conserved regions, whereas mismatches in highly conserved regions are very much discouraged. This leads to a better performance in recognition of TF binding sites if compared with methods that do not use the information vector.
To determine the best threshold of the motif finding algorithm, we test various threshold values and analyze the true negative and false positive rate of each threshold value. The ideal threshold is supposed to have both the least true negative and false positive rates.
| Threshold | 0.5977 | 0.598 | 0.69 | 0.7 | 0.73 | 0.76 | 0.0778 | 0.84 | 0.85 | 0.86 | 0.9 |
| True megtive | 0.1 | 0.11 | 0.21 | 0.23 | 0.3 | 0.45 | 0.5 | 0.63 | 0.7 | 0.72 | 0.77 |
| False positive | 56.4778 | 57.01124 | 31.56962 | 29.15584 | 23.58571 | 20.92727 | 17.90796 | 9.945946 | 10.66667 | 10.17857 | 6.608696 |
The picture above shows part of our test results and to keep both the true negative and false positive rates at a reasonable level, we adopt 3 threshold values, namely, low (0.5977) , median (0.0778) and high (0.85), with a true negative rate at 0.1, 0.5, and 0.7 respectively. And for more flexibility, we also allow the users to set their own thresholds.
Part 2: the recognition of sigma factor motif and the evaluation of relative promoter strength.
In the case of sigma 70 factors, the motifs are the −35 and −10 hexamers. Enclosing a spacer of length 15–19 bp.
Given a promoter sequence, the -10 and -35 hexamers are located by the total MSS of the two hexamers calculated by the position frequency matrices of the sigma factor binding sites, which are derived from Regulon DB. And the calculating process is subject to two constraints:
1. That the spacer length (the number of base pairs between the −35 hexamer and the −10 hexamer) should lie in the range (15–20);

2. The total MSS (our results are the sum of the scores for the −10 and −35 hexamers and therefore lie in the interval [0,2], with a score of 2 corresponding to the joint consensus TTGACA (−35) and TATAAT (−10).
Score(Promoter)=score(-10 box)+score(-35 box)+score(spacer between -10 & -35 boxes)
And the score of spacer length is calculated by algorithms propozed by Ryan K. Shultzaberger.el. in
In prokaryotes, the strength of sigma factor regulation for a particular gene often depends on how closely a particular site matches the consensus for the motif. The more mismatches to the consensus in a binding site, the less often the sigma factor will bind and therefore the less strength the promoter will have. Experiments have confirmed the hypothesis that the consensus promoter sequences is "best". We set the best promoter strength to 100% and calculate the relative strength of a given promoter by the Score (promoter).
Primer design
A primer pair (p, q) is assigned the scoring vector
sc (p, q) = (|p|, |q|, GC (p), GC (q), Tm (p), Tm (q), sa (p), sa (q), sea (p), sea (q), pa (p, q), pea (p, q))T ∈ R12.
All primers are designed to have ideal values of length, GC content, and melting temperature which are specified externally by the designer of the hybridization experiment. These ideal values are to be specified for forward and reverse primers. The ideal score vector or reference vector for the primer pair is
scideal =(lengthf , lengthr , GCf , GCr , Tm,f , Tm,r , 0, 0, 0, 0, 0, 0)T.
All ideal annealing values are set to zero and typically
Tmf = Tm,r as well as GCf = GCr . The final assessment of a primer pair (p, q) can be its deviation from the reference in terms of the l1-distance

Here, we employ a weighted distance

with weights given in the following table.

The formulas for calculating the variations above are provided in Efficient primer design algorithms.13
Results
Sigma factors recognition
Our program has a correctness rate of 56% in recognition various types of sigma factors. We ran our program with 100 various promoters sequencess whose types have already been confirmed experimentally. And we've recognized 56 of them correctly. Specifically, as for sigma 70 promoters, which are the most prevalent, the recogtion correctness rate has reached 92%. The results are showed below.
TFBS Location
We then tested the reliability of our software regarding TFBS location and results show that the correct site prediction rate is 64%. We used the sigma 70 promoter sequences with annotated -35 and -10 region provided by RegulonDB to test the correct prediction rate of the binding site of a specific transcription. We input 89 sigma70 promoter sequencess and ran our program to precisely locate the sigma factor binding site.
The test results are as follows. The numbers represent the site of actual -35 motif, the actual spacer length, the predicted site and predicted spacer length, respectively.
Promoter strength correlation & experiments
To testify our prediction of promoter strength, our team has done a considerable amount of lab work. First, we located the -10 region of the pBAD promoter (BBa _K206000) and accordingly mutated the -10 region into BBa _K1070002, BBa _K1070003, the sequencess of these promoters are given bellow (-10 regions are highlighted):
Pbad Strong (BBa_K206000):a c a t t g a t t a t t t g c a c g g c g t c a c a c t t t g c t a t g c c a t a g c a a g a t a g t c c a t a a g a t t a g c g g a t c c t a c c t g a c g c t t t t t a t c g c a a c t c t c t a c t g t t t c t c c a t a c c g t t t t t t t g g g c t a g c
BBa_K1070002:a c a t t g a t t a t t t g c a c g g c g t c a c a c t t t g c t a t g c c a t a g c a a t a t a g t c c a t a a g a t t a g c g g a t c c t a c c t g a c g c t t t t t a t c g c a a c t c t c t a c t g t t t c t c c a t a c c g t t t t t t t g g g c t a g c
BBa_K1070003:a c a t t g a t t a t t t g c a c g g c g t c a c a c t t t g c t a t g c c a t a g c a a g a t a a t c c a t a a g a t t a g c g g a t c c t a c c t g a c g c t t t t t a t c g c a a c t c t c t a c t g t t t c t c c a t a c c g t t t t t t t g g g c t a g c
Subsequently, we measured the fluorescence intensity of these promoters and related it to the actual promoter strength. The experimental results are shown in Figure 8.

Then we fitted the actual strength and the predicted strength, as can be seen in figure 9, the coefficient of determination is 0.8924.

Future work
Apply our algorithms to more species. Now Pro-decoder is designed expressly for prediction and evaluation of E. coli promoters, in the near future we'll study the transcription regulation mechanism of other species and try to apply our algorithms to an extended range of species.
Enhance promoter strength prediction accuracy. Because our experimental data is so limited, the weight of the spacer length and the motif similarity is roughly determined, which lead to a weak correlation between the promoter strength. In the future we hope to obtain more experimental data with regard to the effect of spacer length and motif similarity having on promoter strength so we can revise the weight coefficients of the two factors and get more reliable results.
The next version of this part of our program will be able to analyze not only the promoters of E. coli, but other species such as Bacillus subtilis, we'll integrate the transcription factor binding site data of more species into our database and use PWM algorithm to predict the TFBS in the promoters.
References
Abstract
The efficiency of translation in bacteria is greatly influenced by the binding affinity between the ribosome and RBS, which can be measured by RBS strength. Experimental work to determine a RBS sequences can be awfully laborious while our software program can solve this problem easily. RBS-decoder is a software tool for evaluating RBS strength and locating SD sequences. This program uses the same method-PWM to calculate the similarity between the RBS sequences and the position frequency matrix of SD sequences and transform the similarity to the relative strength of a RBS sequences.
Background
Translational efficiency in Escherichia coli is generally determined at the stage of initiation. There are several principal mRNA sequences elements which can affect the kinetics of ternary initiation complex formation (30 S-mRNA-fMet-tRNA): SD sequences and the start codon (ATG). The SD sequences base-pairs with a RNA molecule that forms part of the bacterial ribosome (the 16s rRNA), while the start codon base-pairs with the initiator tRNA which is bound to the ribosome. In addition the SD sequences and the start codon being important, the spacer between them also influences the RBS strength, these two sequencess need to be positioned approximately 6-7 nucleotides apart so they can both make contact with the appropriate parts of the ribosome complex1.
Introduction
How do baterial Ribosome Binding Sites work?
The bacterial ribosome binds to particular sequencess on an mRNA, primarily the SD sequences and the start codon (ATG). The SD sequences base-pairs with an RNA molecule that forms part of the bacterial ribosome (the 16s rRNA), while the start codon base-pairs with the initiator tRNA which is bound to the ribosome. In addition to SD sequences and the start codon being important, these two sequences need to be positioned approximately 6-7 nucleotides apart so they can both make contact with the appropriate parts of the ribosome complex.1
The Shine-Dalgarno sequences

The end of the 16s rRNA that is free to bind with the mRNA includes the sequences 5′–ACCUCC–3′. The complementary sequences, 5′–GGAGGU–3′, named the Shine-Dalgarno sequences, can be found in whole or in part in many bacterial mRNA. Very roughly speaking, ribosome binding sites with purine-rich sequencess (A's and G's close to the Shine-Dalgarno sequences will lead to high rates of translation initiation whereas sequencess that are very different from the Shine-Dalgarno sequences will lead to low or negligible translation rates. You can see how common the sequences is by looking at the RBS sequences logo on the right (where the height of a letter indicates the frequency of the letter at that location).
Algorithms
As we know, the RBS strength is greatly influenced by the SD sequences, where the 16s RNA of the ribosome binds to, so the strength can be determined by the binding free energy between the SD sequences and the 16s RNA. So we designed a program calculating the binding free energy but the results show that the correlation between the free energy and the strength of RBS is rather weak (R2=0.5517). So we decide to find other algorithms for better accuracy.
Inspired by the strength prediction algorithms used in promoter part, in which the similarity to the sigma factors' PWM is interlocking with the binding affinity between the protein and DNA sequences. We obtained the Position Frequency Matrix of SD sequences of E. coli and use the PMW method (illustrated in detail in the promoter part) to calculate the similarity between the RBS sequences and the Position frequency sequences, what is different from the promoter is that, the spacer length between the SD sequences and the startcodon and the start codon itself both act as constraints in locating the SD sequences, which is confined to 3-16 bp and ATG/TTG/GTG. And similar to the prediction of promoter strength, the spacer length between the SD sequence also contributes to the RBS strength, the optimal spacer length is 7 bp, and the spacer score is calculated using the same algorithm applied in the promoter part.2 The weight of the influence of the spacer on the strength isderived from the algorithm to predict the promoter strength, in which the weight of the total MSS and the spacer is 0.29:0.71, and since in promoter the total MSS is the sum of two motifs while the SD sequences is only one motif, the weight between the MSS(SD sequences) and the spacer is 0.29:0.355.
| 1 | 2 | 3 | 4 | 5 | |
| T | 0.161 | 0.050 | 0.012 | 0.071 | 0.115 |
| C | 0.077 | 0.037 | 0.012 | 0.025 | 0.046 |
| A | 0.681 | 0.105 | 0.105 | 0.861 | 0.164 |
| G | 0.077 | 0.808 | 0.960 | 0.043 | 0.659 |
Results
We used the RBS sequences listed on the iGEM registry with experimentally determined relative strength,4 and the correlation between the RBS strength predicted by our software and the actual relative strength is strong, with a determination coefficient value 0.8039.
 Figure 3 The correlation between actual RBS strength and predicted strength
Future work
Due to scarcity of experimental data, the relative weight of the SD sequences and the spacer length used currently is roughly determined which may undermine the accuracy of RBS strength prediction. For further improvement of our program, we'll try to obtain more reliable experimental data to accurately determine the weight used in our algorithm and hopefully elevate the accuracy of RBS-decoder.
In the next version of RBS-decoder, the secondary structure of the RBS sequences will be shown on the software and we'll also include the other species' SD sequence data in order to predict the RBS strength of a larger range of species.
Reference
Background
Gene expression in both prokaryotes and eukaryotes is frequently controlled at the level of transcription. This process can be represented as a cycle consisting of four major steps: (1) promoter binding; (2) RNA chain initiation; (3) RNA chain elongation; and (4) termination. Since regulatory controls are exerted at each step, an understanding of the mechanism of each step is of general importance in understanding gene expression.
In the promoter part of our program, we've discussed the mechanism of promoter binding step and how it affects the transcription level. To complete our biobrick evaluation program and to better understanding of transcription process, we integrated the software developed by 2012 iGEM team SUSTC-Shenzhen-B to realize the prediction of transcription termination efficiency.
Introduction
Termination, the last step of the transcription cycle, occurs when the RNA polymerase releases the RNA transcript and dissociates from the DNA template. It is important that transcription is imperfectly terminated at some terminator so that the ratio of the amount of the mRNA transcribed from upstream and that from downstream of the terminator is controlled. This regulation is quantified by the termination efficiency (%T).
Two mechanisms of transcription termination and two classes of termination signals have been described in bacteria: rho-dependent and rho-independent.
Rho-independent (also known as intrinsic) terminators are sequences motifs found in many prokaryotes that cause the transcription of DNA to RNA to stop. These termination signals typically consist of a short, often GC-rich hairpin followed by a sequences enriched in thymine residues.
The conventional model of transcriptional termination is that the stem loop causes RNA polymerase to pause and transcription of the poly-A tail causes the RNA: DNA duplex to unwind and dissociate from RNA polymerase.
Algorithm
In 2011, iGEM team SUSTC-Shenzhen-B developed a software tool TTEC to predict terminator efficiency. It takes DNA sequencess as input and returns the terminator efficiency value.
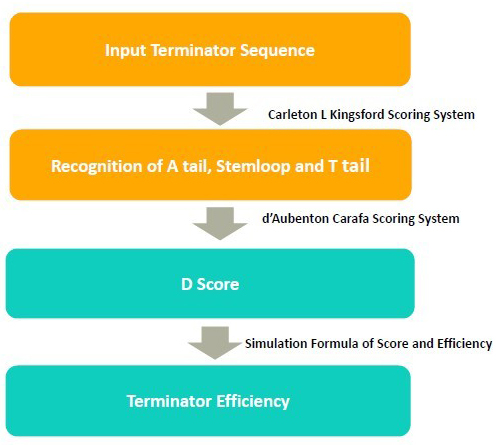
In the algorithm, it takes 3 steps to calculate the terminator efficiency:
1. Use RNA folding algorithm to predict the secondary structure of terminator and and recognize A tail, stemloop and T tail.
2. From the secondary structure, we calculate the free energy of stem loop, and generate a score by considering stem loop free energy and T tail
3. From the score, we predict the terminator efficiency based on the score-terminator equation.
The prediction of secondary and recognition of A tail, stemloop and T tail are achieved by Kingsford scoring system.
Kingsford Scoring System
In 2007, Carleton L. Kingsford et al. described TransTermHP1, a new computational method to rapidly and accurately detect Rho-independent transcription terminators.
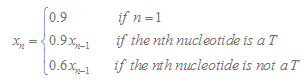
They put forward an algorithm to predict Rho-independent terminators. The first 15 bases of the potential tail sequences are scored using a function:
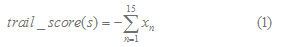
where
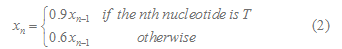
for n=1,2,..,15 and =1.
The energy of potential hairpin configurations adjacent to a reference position can be found efficiently with a dynamic programming algorithm. The table entry hairpin_score[i,j] gives the cost of the best hairpin structure for which the base of the 5' stem is at nucleotide position i and the base of the 3' stem is at position j. The entry hairpin_score[i,j] can be computed recursively as follows:
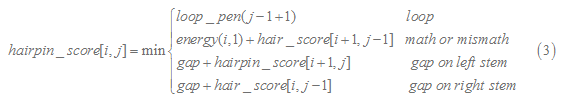
The function energy(i,j) gives the cost of pairing the nucleotide at i with that at j, and loop_pen(n) gives the cost of a hairpin loop of length n. The hairpin's loop is forced to have a length between 3 and 13 nt, inclusive, by setting loop_pen(n) to a large constant for any n outside that range. The constant 'gap' gives the cost of not pairing a base with some base on the opposite stem and thus introducing a gap on one side of the hairpin stem.
Table 1
Parameters used to evaluate hairpins
Pairing Energy
G-C -2.3
A-T -0.9
G-T 1.3
Mismatch 3.5
Gap 6.0
Loop_pen(n) 1•(n - 2)
Parameters used to evaluate the energy of a potential hairpin where n is the length of the hairpin loop
The D score is calculated by Carafa Scoring System.
Carafa Scoring System
Scoring System 2 is based on the model created by d'Aubenton Carafa 2. The score of terminator consists of two parts, the free energy of stemloop and the score of 15 nt poly T tail. The free energy of stemloop is calculated using Loop Dependent Energy Rules 3. The minimization of the free energy also determined the secondary structure of the stemloop. T tail score is calculated by the formula given by d' Aubenton Carafa.
Detailed Calculation of Score
1. Some definitions3
i. Closing Base Pair
For an RNA sequences, we number it from 5' to 3' . If i < j and nucleotides ri and rj form a base pair,we denote it by i.j. We call base ri' or base pair i'.j' is accessible from i.j if i <i' ( <j' ) <j and if there is no other base pair k.l so that i <k <i' ( <j' ) <l <j. We denote the collection of base and base pair accessible from i.j by L(i,j). Then i.j is the closing base pair. Here “L” means loop.
ii. n-loop
If the loop contain n – 1 base pairs, we denote it by n-loop. (Because there is a closing base pair, so we denote it by n-loop even though the closing base pair is not included in the loop.)
Here we can divide loops which may be formed in the terminator secondary structure into two kinds.
1-loop : Hairpin loop(size of loop shouldn't be smaller than 3)
2-loop : Interior Loop(right strand size and left strand size are both bigger than 0.)
Buldge(Size of one strand is bigger than 0 and that of another strand is 0.)Stack(size of the loop is 0.)
2. Calculation of the Minimum Free Energy Change of Stemloop Formation4 Assume i.j is the closing base pair of the loop
G(i,j)= min { GH ( i , j ) , GS( i , j ) + G ( i + 1 , j – 1 ) , GBI( i , j ) } ;
GBI ( i , j ) = min{ gbi( i , j , k , l ) + G( k , l ) } for all 0 < k – i + l – j - 2 < max_size
G(i,j) is the minimum free energy change of stemloop formation. GH is the free energy change to form a hairpin loop. GS is the free energy change to form a stack. GBI is to calculate the minimum free energy change of structure containing 2-loop. gbi(i,j,k,l) is the free energy change to form 2-loop.
3.Calculation of T Tail Score
Here we consider 15 nucleotide in the downstream of stemloop. T tail score nT is calculated as follows :

In our program, if the length of the T tail( n ) is less than 15, we will only consider n nucleotides. If TL is more than 15, we will only consider 15 nucleotides.
4.Calculation of Score
Score = nT * 18.16 + deltaG / LH * 96.59 – 116.87
Here nT is T tail score. deltaG is the minimum free energy change of stemloop formation. LH is the length of stemloop.5,6
References
Abstract
Our team mainly focuses on programming the software by genetic algorithm, evaluating both optimization of single codon and codon pair and hence determining the fittest optimized sequences for expression in heterologous host cell.
In addition, Synoproteiner protects enzyme cutting site. Users can choose corresponding cutting sites, not substituted during the optimization, so that the power of chosen enzyme cutting site won’t fail.
Apart from the optimization, we have two additional functions. One is the statistics analysis, which provides the numbers and the proportion of the codon in the original and optimized sequences, making the optimization easier to understand. The other is the prediction of the protein folding rate. The purpose of the prediction is to seek the law of the folding rate in general, computing a relatively accurate folding rate value of the optimized sequences for the users.
Background
Synonymous codons and the efficiency
Except methionine and tryptophan, all amino acids can be encoded by two to six synonymous codons, resulting from the degeneracy of the genetic code.1 However, unequal utilization of the synonymous condons leads to the phenomenon of codon usage bias, which is mainly due to natural selection, mutation and genetic drift.2 According to related studies, codon usage bias has certain connection with gene expression level.3 The larger the value of codon usage bias is, the higher gene expression will be. So the problem, how to substitute the synonymous codons aimed at raising the efficiency of gene expression and thus increasing the production of recombination protein in heterologous host cell, is expected to be addressed.
Protein folding rate
Protein is an important class of biological macromolecules. It is the main bearer of life activities and occupies a special position in vivo. Each protein has its own unique amino acid composition and sequences. Only when the amino acid chain is folded into the correct three-dimensional structure, will the protein have normal biological functions. Misfolded ones will not only lose its biological function but also even cause diseases such as mad cow disease, Alzheimer's syndrome, etc. The protein folding problem, an important biological question that the central dogma of molecular biology has not solved yet, has been listed as an important topic in twenty-first century. The folding mechanism of the protein is a challenging task, one of which is to determine factor influencing the folding rate. Although the answer can be found in a variety of biological experiments, such as various spectroscopy, mass spectrometry and nuclear magnetic resonance, these methods are time-consuming and costly. With the development of physics, mathematics, especially the progress of computer technology, how to apply a fast and accurate calculation method to predict protein folding rate attracts more and more attention.4
Introduction
Balance with single codon and codon pair
Individual codon usage optimization has been attached importance to, taking Codon optimizer,5 Gene Designer,6 OPTIMIZER7 for example. Subsequently, people found the effect of gene expression optimization cannot be perfect just by single codon optimization. Codon pair, namely the pair of k-th and (k+1)-th codons from the 5’ to 3’ end, is another crucial factor. Due to potential tRNA-tRNA steric interaction within the ribosomes,8 the usage of rare condon pairs, which correlate with translation elongation, decrease protein translation rates.9 Optimization of individual codon has an influence on the corresponding codon pair resulting in maybe-not-the-best codon pair optimization. In the same way, optimizing codon pair merely contributes to maybe-not-the-best single codon optimization. Therefore, it is a challenging way for us to apply a method considering and weighing the effects of single codon and codon pair optimization and thus make the whole best.
Our team focuses on evaluating both optimization of single codon and codon pair and thus selecting the best sequences for expression in heterologous host cell.
Host Cell
Considering E. coli and S. cerevisiae are the ideal hosts for recombinant proteinexpression, and Gram-positive bacterium L. lactis and methylotrophic yeast P. pastoris are also promising candidates for expressing recombinant proteins,10 we attached importance to selecting these four kinds of bacterium as host cell to optimize the sequences.
Enzyme cutting site protection
To avoid deconstruction of enzyme cutting site and therefore incapability during substitution of the base, Synoproteiner succeeds in protecting 14 kinds of commonly used cutting site as the graph shows:
Enzyme cutting site |
Recognition sequence |
ApaI |
5’GGGCC^C’3 |
BamHI |
5’G^GATCC’3 |
BglII |
5’A^GATCT’3 |
EcoRI |
5’G^AATTC’3 |
Hind1II |
5’A^AGCTT’3 |
KpnI |
5’GGTAC^C’3 |
NcoI |
5’C^CATGG’3 |
NdeI |
5’CA^TATG’3 |
NheI |
5’G^CTAGC’3 |
NotI |
5’GC^GGCCGC’3 |
Sa1I |
5’G^TCGAC’3 |
SphI |
5’GCATG^C’3 |
XbaI |
5’T^CTAGA’3 |
XhoI |
5’C^TCGAG’3 |
Users can multi-select the enzyme cutting site that they want to stay unaltered and hence get an optimized sequence without changing selected region.
Method of prediction
In recent years, many researchers have made great efforts to explore the determinants of the folding rate, and various forecasting methods have been proposed. The existed prediction methods can be roughly divided into three categories.11-12 The first one is based on the tertiary structure.13-19 However, it takes lots of molecular experiments, expensive and in long period, to acquire the information of the tertiary structure, which fails to meet the demand of rapid prediction. The second category is based on the secondary structure.20-24 This kind of method requires information of the secondary structure, similarly obtained by molecular experiments, or from the primary sequences prediction, but it will be limited by accuracy of the secondary structure prediction method. The last one is based on the primary structure,25-34 which predicts the folding rate from amino acid sequencess without most structure information.4 And our prediction of the protein folding rate focuses on the last method.
Algorithm
Part I—Optimization
Basic Table
Based on the table below, we calculate function of single codon, function of codon pair and the function of multi-objective codon optimization. The method aims at make the optimization of whole best by calculating the relative effect of single codon and codon pair.
Amino acid abbreviation and synonymous codons.11
| Amino Acid | Abbreviation | Synonymous Codon(s) |
|---|---|---|
| Methionine | M | AUG |
| Tryptophan | W | UGG |
| Cysteine | C | UGC, UGU |
| Aspartate | D | GAC, GAU |
| Glutamate | E | GAA, GAG |
| Phenylalanine | F | UUC, UUU |
| Histidine | H | CAC, CAU |
| Lysine | K | AAA, AAG |
| Asparagine | N | AAC, AAU |
| Glutamine | Q | CAA, CAG |
| Tyrosine | Y | UAC, UAU |
| Isoleucine | I | AUA, AUC, AUU |
| Alanine | A | GCA, GCC, GCG, GCU |
| Glycine | G | GGA, GGC, GGG, GGU |
| Proline | P | CCA, CCC, CCG, CCU |
| Threonine | T | ACA, ACC, ACG, ACU |
| Valine | V | GUA, GUC, GUG, GUU |
| Leucine | L | CUA, CUC, CUG, CUU, UUA, UUG |
| Arginine | R | AGA, AGG, CGA, CGC, CGG, CGU |
| Serine | S | AGC, AGU, UCA, UCG, UCC, UCU |
| (Stop) | * | UAA,UAG,UGA |
Fitness calculation36
Fitness function:

In the function,

cpi is a value larger than zero, ranging from 10-4 to 0.5,fitcp (g) is the fitness function of the codon pair,fitsc (g) is the fitness function of the single codon,w ( (c (k),c (k+1)) is the weight of codon pairs in sequences g,|g| is the length of encoding sequences, c (k) is k-th codon in the sequences, is the target ratio of k-th codon,
  is the actual ratio of k-th codon in the sequences,the best value of cpi is 0.2 in the software.
In the function, the target ratio of k-th codon can be approximated by the equation below:

In the function, weight can be calculated by the equation below:

 stands for the ratio of single codon ck in the complete genome'
 is the number of pair ( ci,cj ) in high-expression genes, and high-expression genes are genes whose copy numbers of mRNA can be detected at least 20 per cell.

syn (ck) stands for the synonymous codon set related to ck, equals to the number of amino acid encoded by ci in the whole protein set.
By this method, there are enough experimental data to prove the sequences optimized works. Xylose isomerase in Bacillus stearothermophilus, Xylose isomerase in Streptomyces olivochromogenes and L-arabinose isomerase in Thermoanaerobacter mathranii all, the optimized ones, were highly expressed in Bacillus subtilis. In addition, the activity of the optimized Aspergillusniger fungal amylase was enhanced to 400% compared with the original sequences in A. niger.36
Calculation of Fitness
NSGA-II algorithm applied35:
1. Randomly initialize a population of coding sequencess for target protein.
2. Evaluate fitsc (g) and fitsp (g) fitness of each sequences in the population.
3. Group the sequencess into nondominated sets and rank the sets.
4. Check termination criterion.
5. If termination criterion is not satisfied, select the “fittest” sequencess (top 50% of the population) as the parents for creation of offsprings via recombination and mutation.
6. Combine the parents and offsprings to form a new population.
7. Repeat steps 2 to 5 until termination criterion is satisfied.
The identification and ranking of nondominated sets in step 3 is performed via pair-wise comparison of the sequencess' fitsc (g) and fitsp (g) fitness. For a given pair of sequencess with fitness values expressed as (fit1cp (g),fit1sc (g)) and (fit2cp (g),fit2sc (g)), the domination status can be evaluated as follows:
• If (fit1sc (g)>fit2sc (g))and (fit1cp (g)>=fit2cp (g)), sequences 1 dominates sequences 2.
• If (fit1sc (g)>=fit2sc (g)) and (fit1cp (g)>fit2cp (g)), sequences 1 dominates sequences 2.
• If (fit1sc (g)<fit2sc (g))and (fit1cp (g)<=fit2cp (g)), sequences 2 dominates sequences 1.
• If (fit1sc (g)<=fit2sc (g))and (fit1cp (g)<fit2cp (g)), sequences 2 dominates sequences 1.
The process is showed in the figure below