|
- Small Phage
- March-April
- May-June
- July-August
- September-October
|
8.2 Modeling Phage Plaque Sizes - Preliminary Experiments
I) Purpose
- To start modeling phage plaque sizes against several variables including, but not limited to phage particle size, agar concentration, and bacterial concentration.
- To determine variables within modeling and make preparation for actual experiments
II) Expected Outcome
- A inverse relationship between phage plaque size and phage particle size/ agar concentration/bacterial concentration.
III) Reagents Used
- LB
- Different stock of E coli strain.
- Stocks of phage
IV) Procedure
1) E coli strain preparation (8.2-8.5)
- We normally use E coli BL21 for our experiments with T7. The large phage group kindly provided the streak of E coli B.
- E coli W3110 and K12 was streaked from frozen glycerol stock and agar stock respectively.
- Because K12 streak from last step didn't work, liquid culture was prepared to amplify bacteria from agar stock. To three test tubes, 1mL of LB was added to each. After this,
- test tube 1: a pipette tip was used to stab the agar stock, after this LB was pipetted up and down to get the agar into LB.
- test tube 2: a wooden stick was used to scrap the agar stock, after which it was submerged in LB
- test tube 3: after preparing test tube 2, the wooden stick used was submerged directly in the LB of test tube 3
2) Phage viability/infection test (8.5)
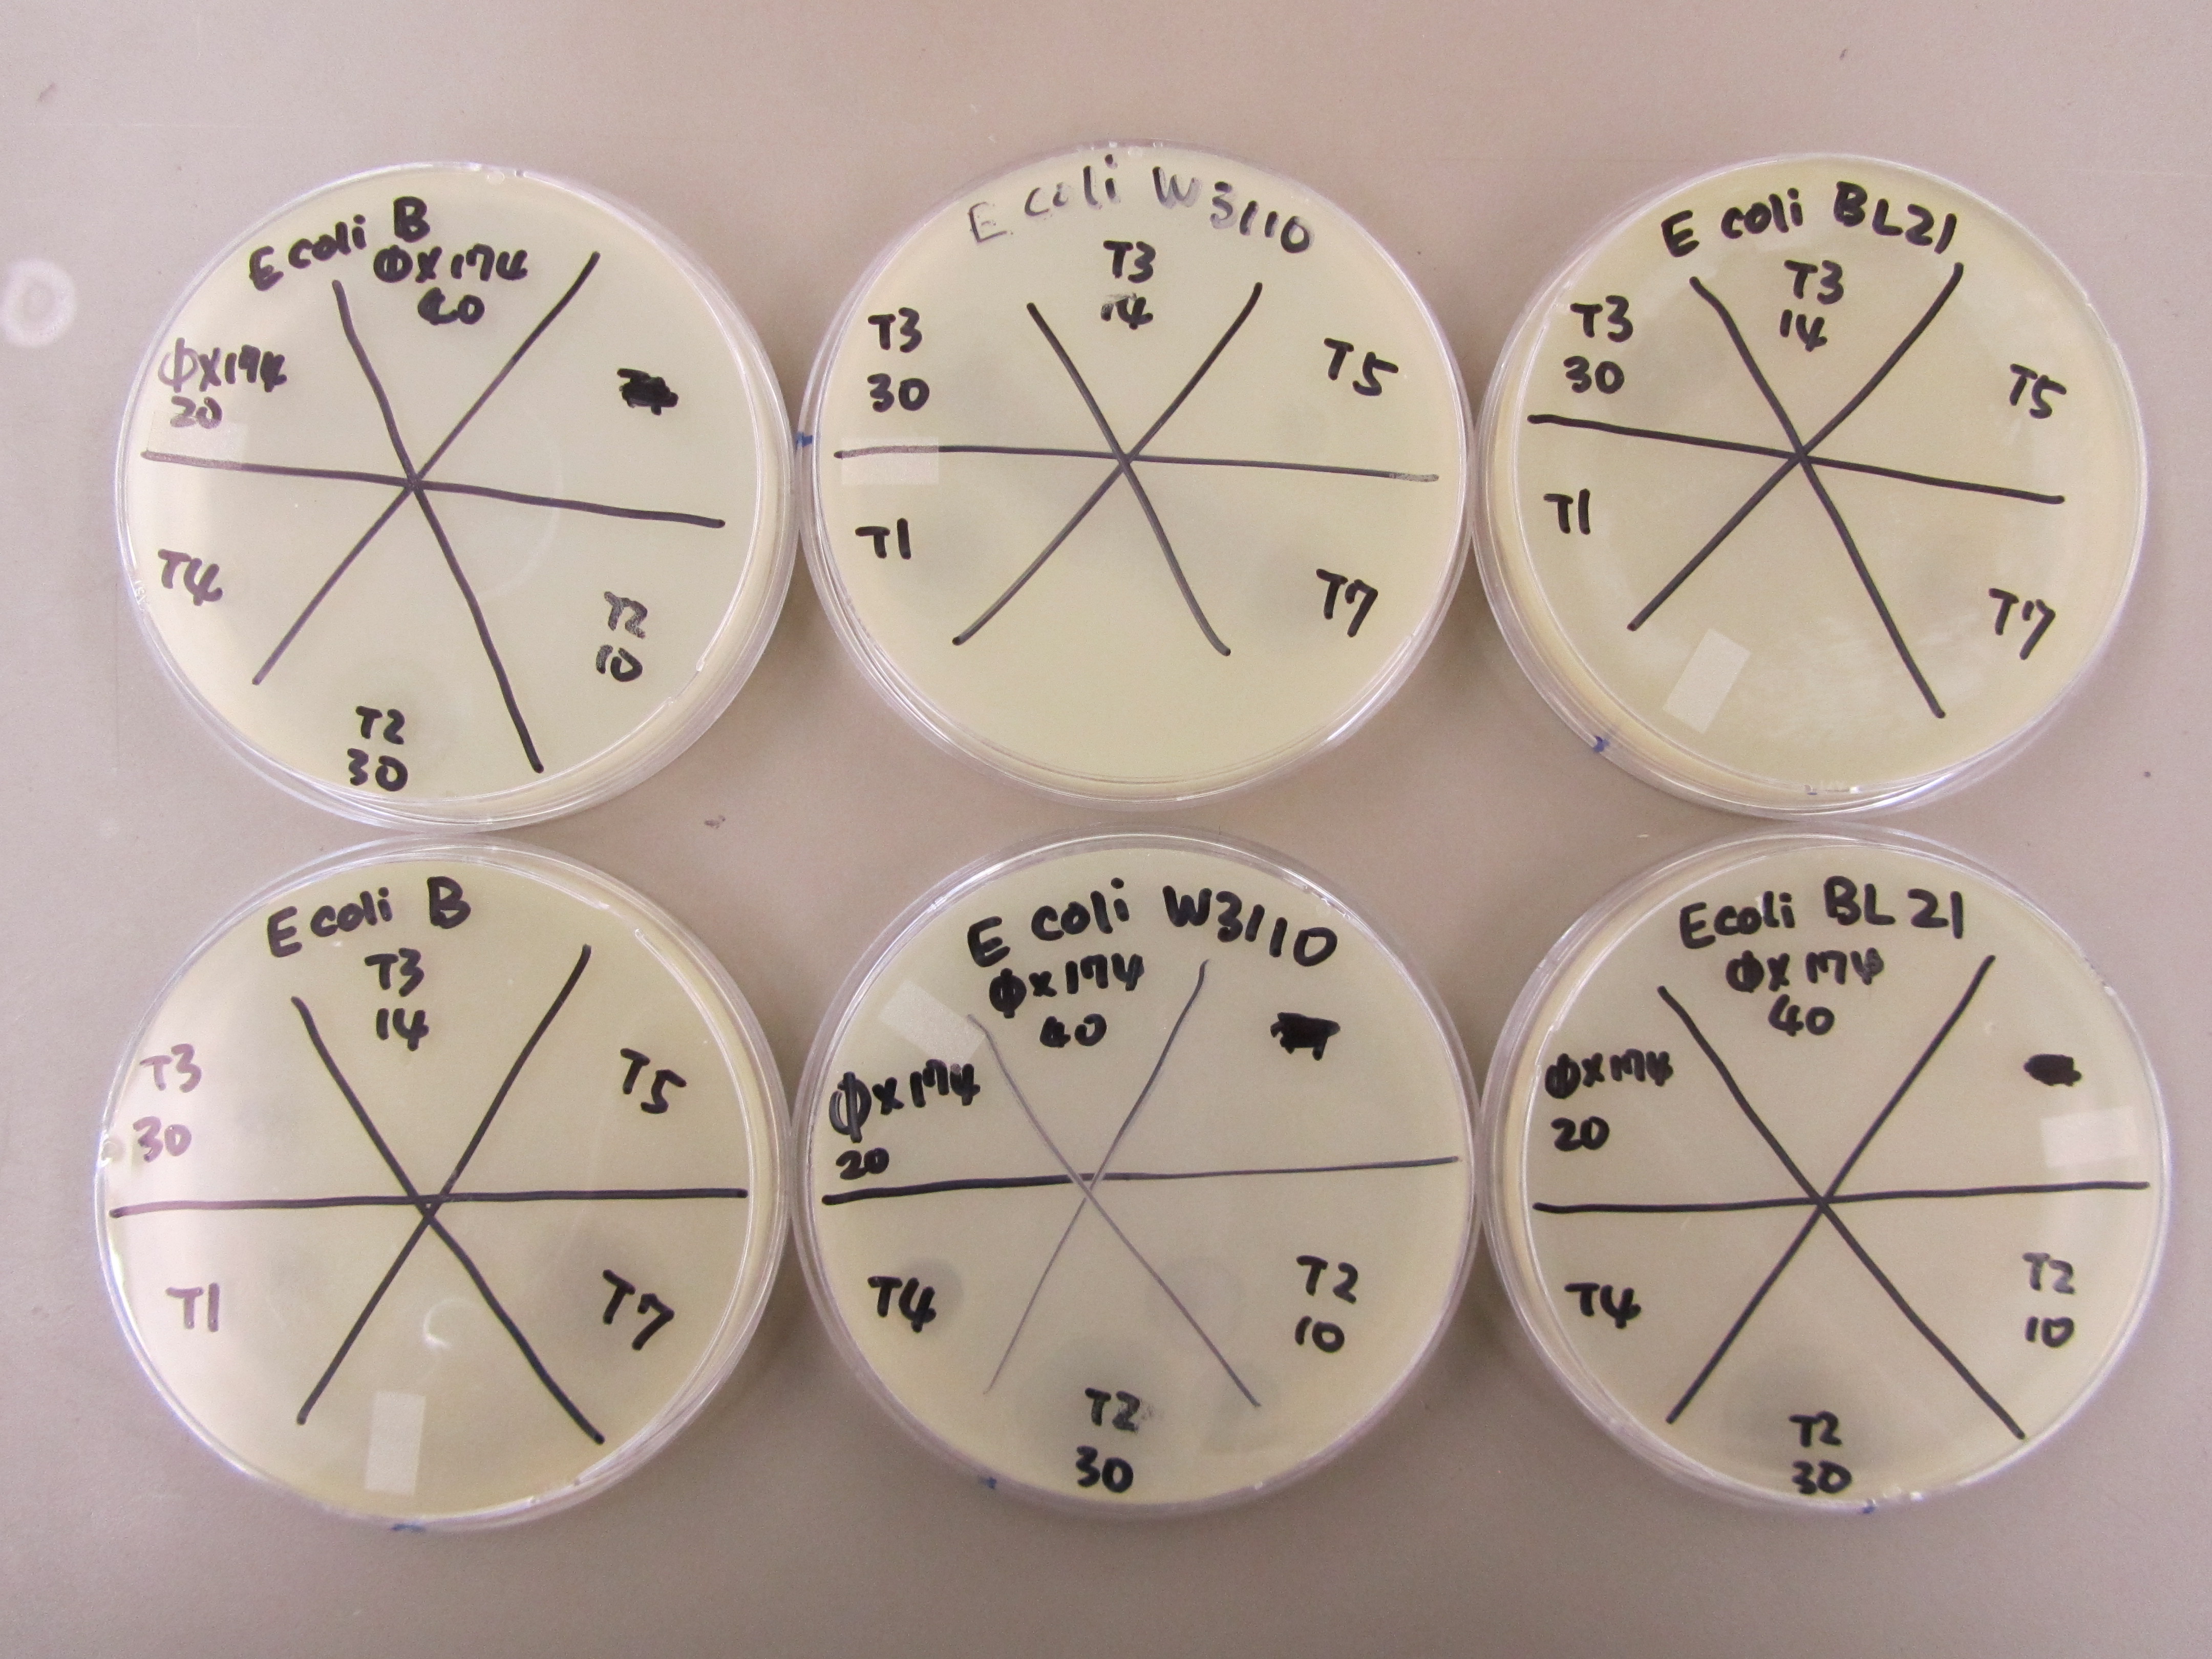
- Prepare 2 plates for a spot test using E. coli BL21 by adding 0.5mL overnight into a tube, mixing it with 5mL of x1 top agar, and then plating it. Repeat for E. coli B and E. coli W3110.
- Spot 5ul each of T1, T3 30, T3 14, T5, and T7 (7.19 10uL stock) onto one plate of each bacteria. Spot T2 10, T2 30, T4 (5E9 pfu/mL as determined by the large phage group), Phi X 174 20, and Phi X174 40 onto the other plate of each bacteria.
3) Spot test to estimate phage titer (8.7)
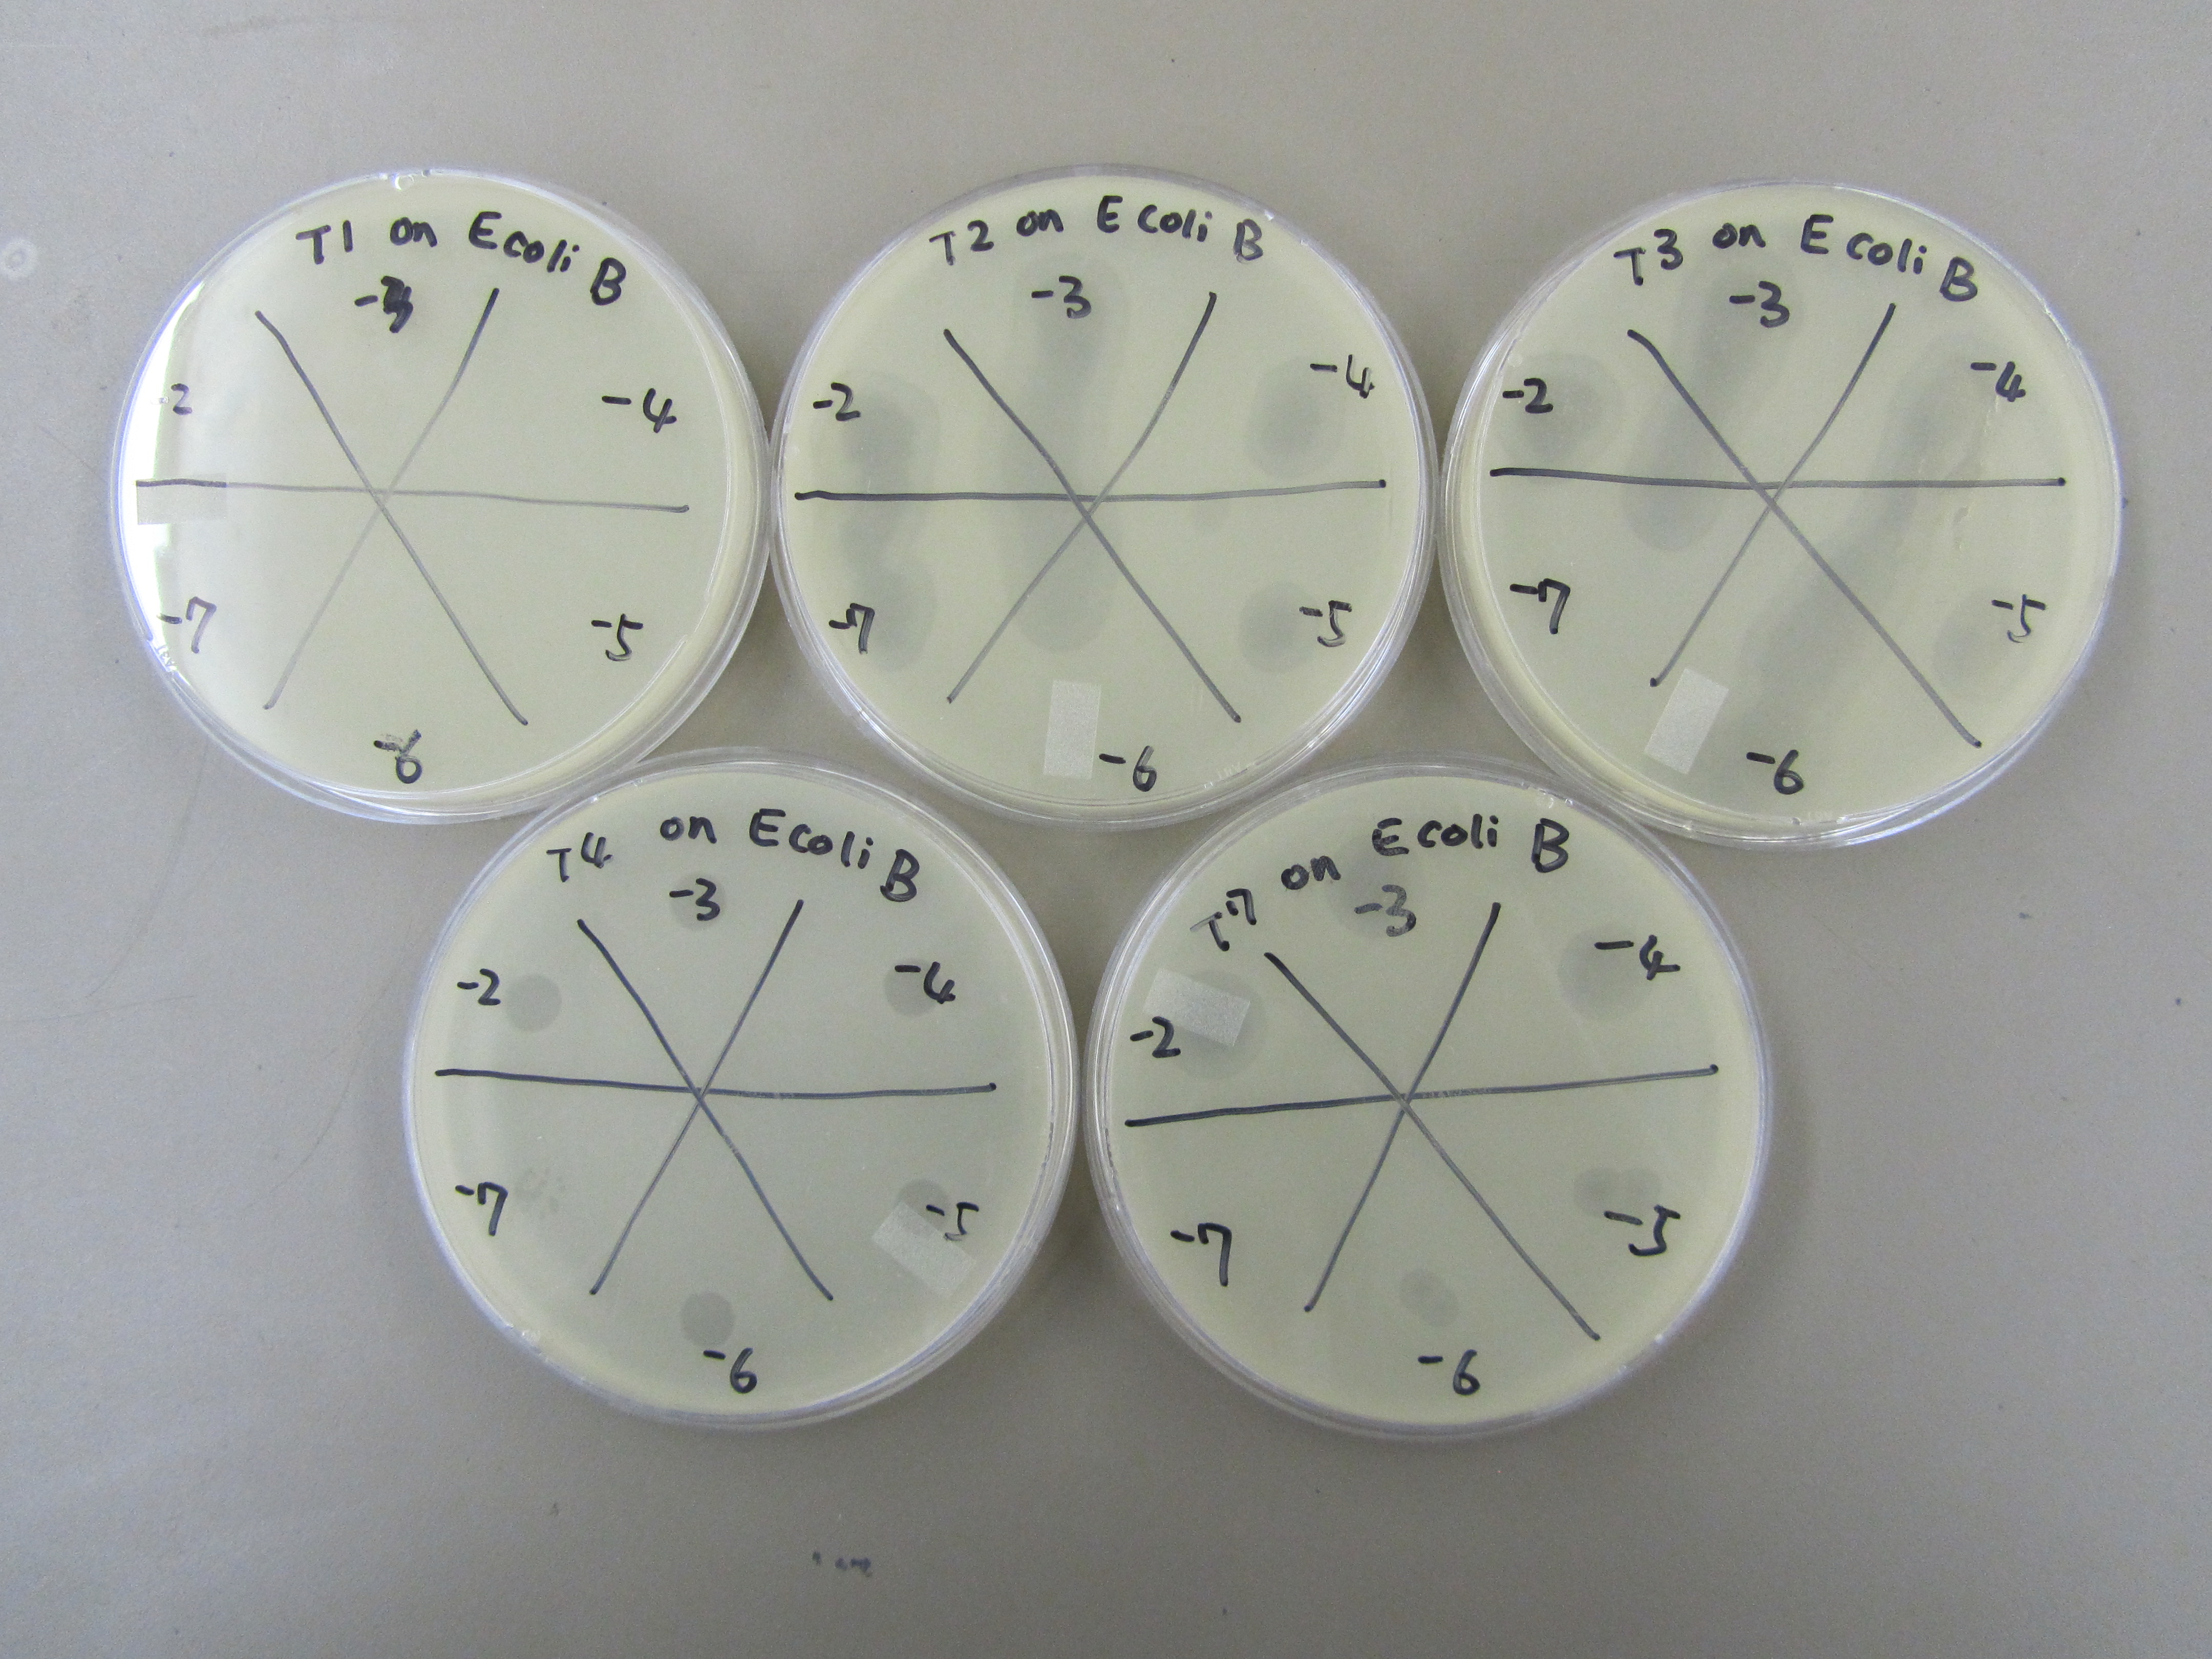
- Five plates, labeled T1, T2, T3, T4, and T7, were prepared for spot tests using E. coli B by adding 0.5mL overnight into a tube, mixing it with 5mL of x1 top agar, and then plating it.
- Dilution series from -2 to -7 was performed for T1, T2, T3, T4, and T7. 5ul of each dilution was spotted onto respective plates.
4) Preliminary titer test (8.10)
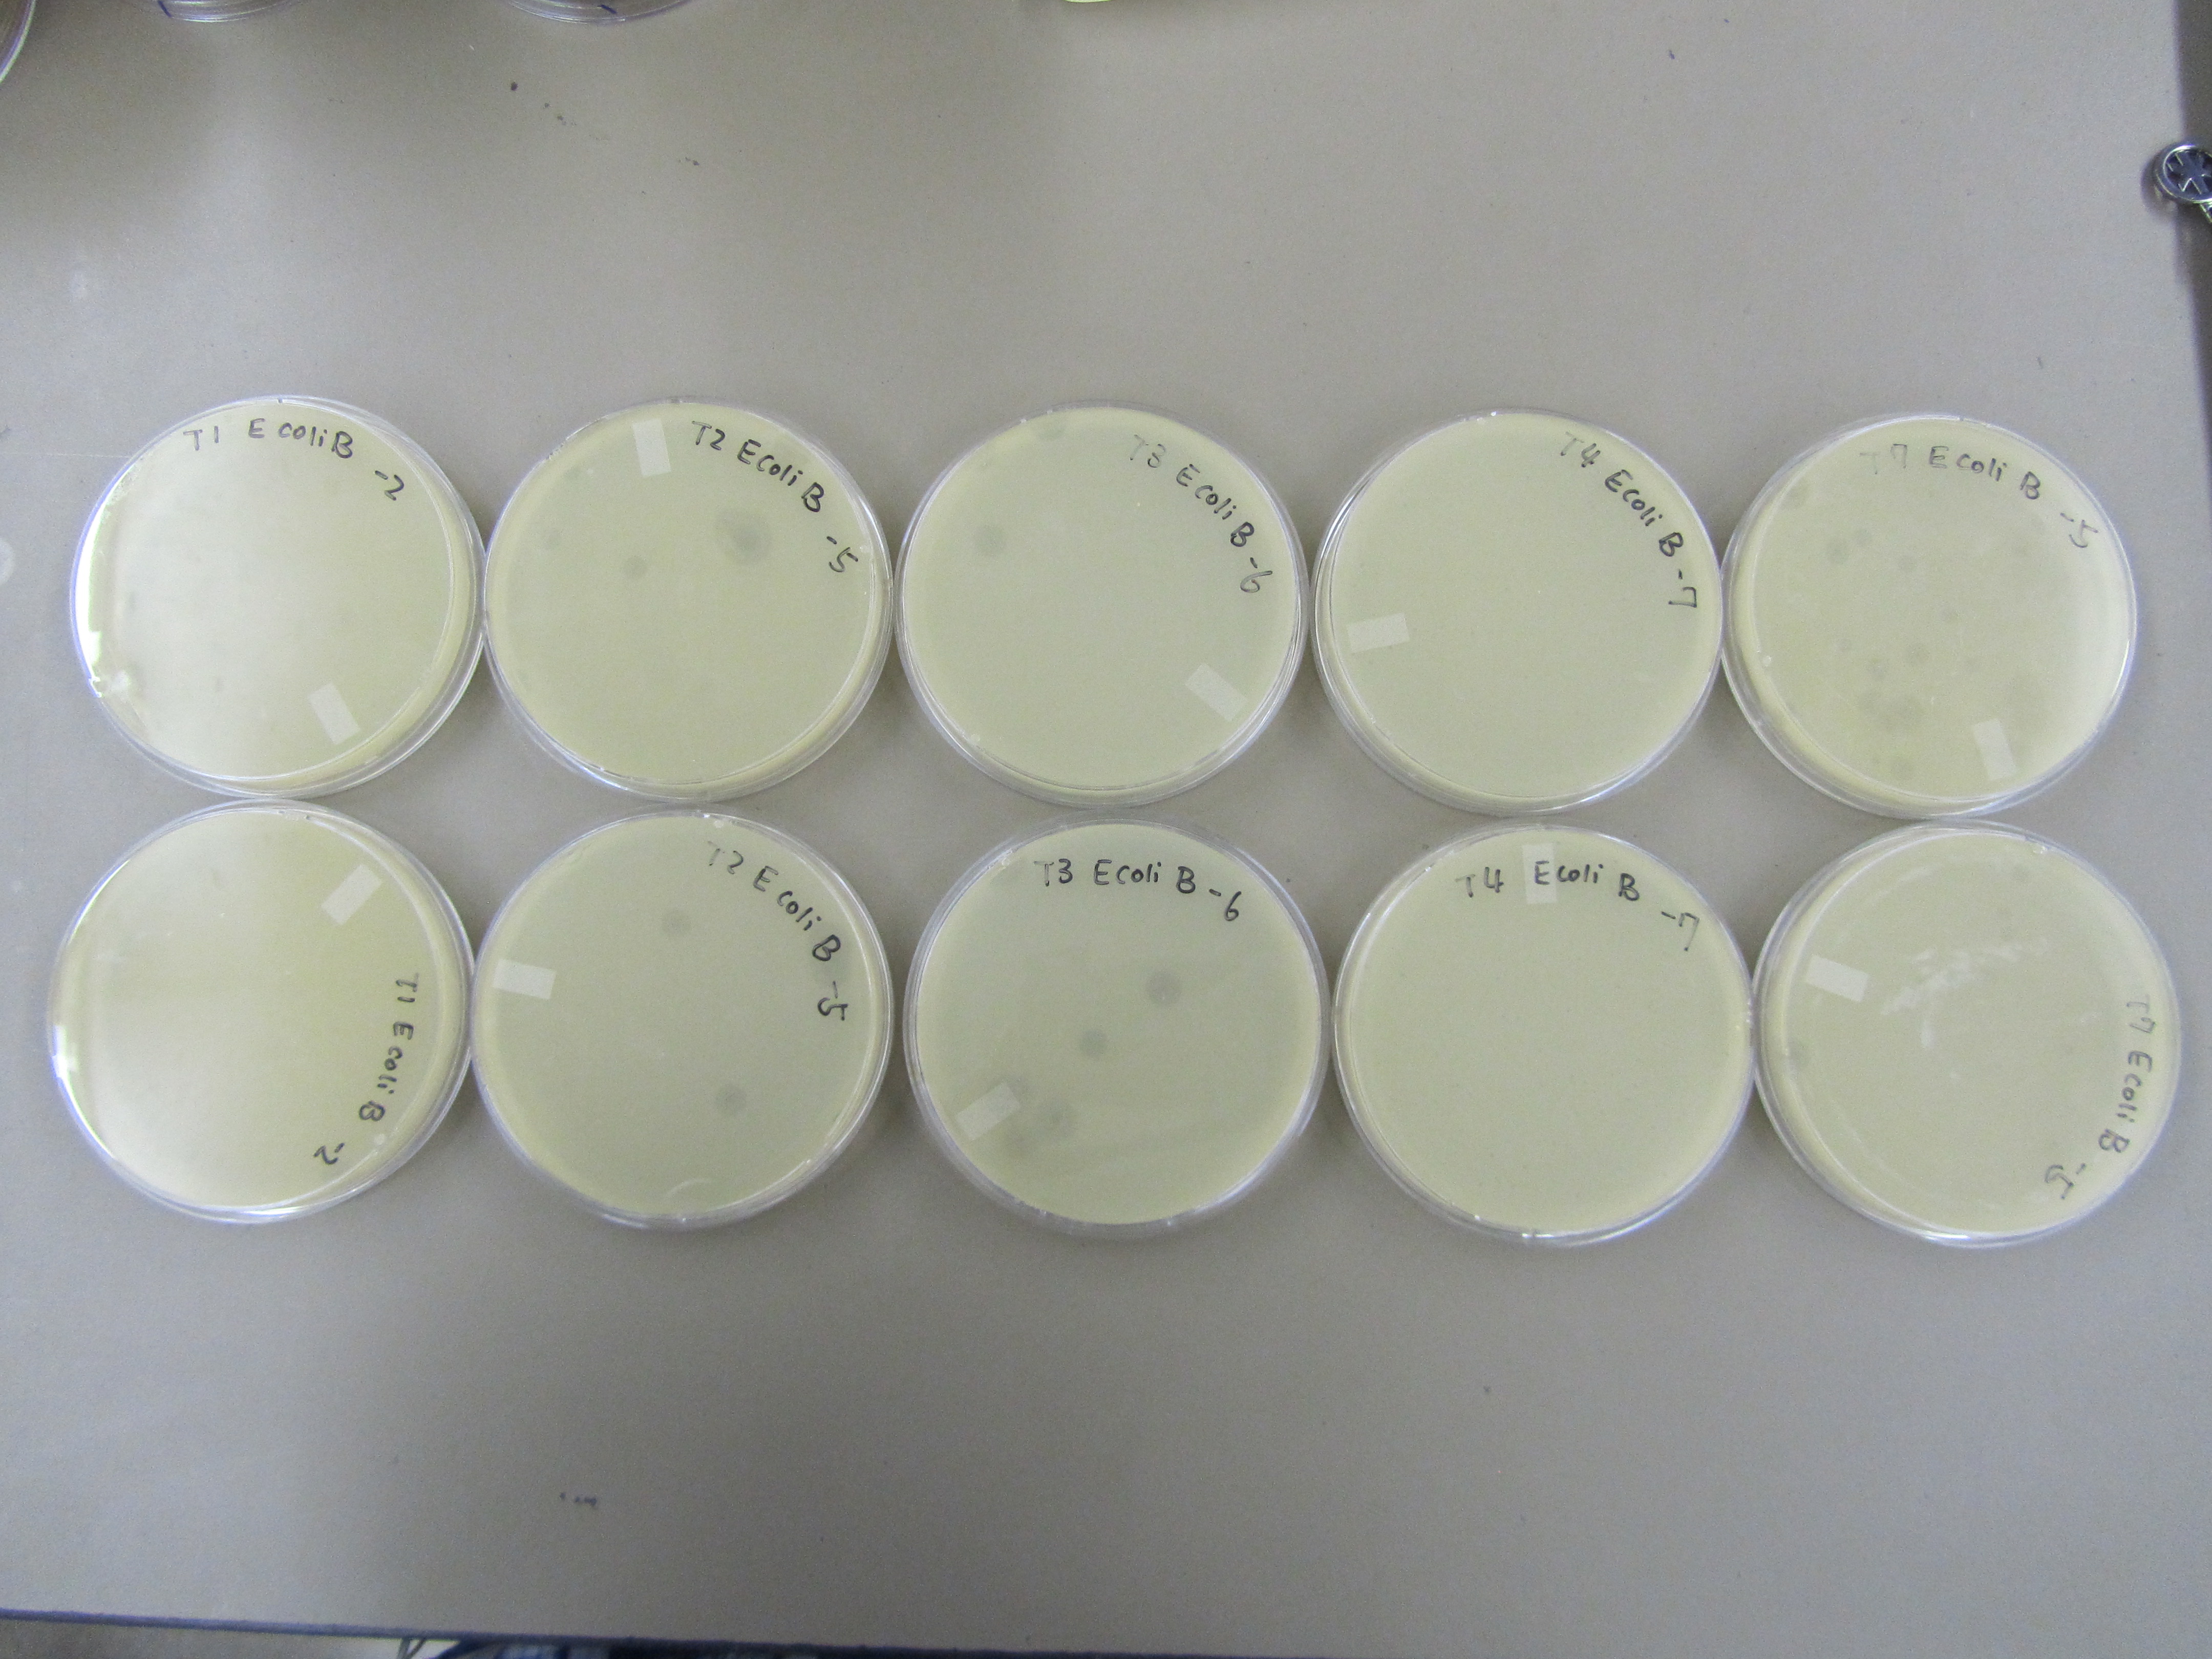
- Titer was performed for T1 -2, -3; T2 -4, -5; T3 -5, -6; T4 -6, -7; and T7 -4, -5 dilution samples.
- Specifically, 0.5mL of E coli BL21 was infected with 20uL of respective phage dilution samples for approximately 15 minutes. 5mL x1 top agar was then added to each test tube, and the content was plated.
- Plates were incubated for approximately 24 hours.
5) Titer repeat (8.12)
- The results form preliminary titer test was used to direct this round of titer. Specifically, only T1 -2, T2 -5, T3 -6, T4 -7, and T7 -5 dilution samples were used.
- Titer were performed using similar procedures as those outlined in Preliminary titer test (8.10), except that E coli B was only incubated with phages for 10 minutes. T1 is a fast lysing phage, incubation for too long may lead to lysis before plating.
V) Results
1) E coli strain preparation
- E coli K12 did not survive on plate or in liquid culture overnight. So we decided to viability/infection of phage with E coli B, BL21, and W3110 instead.
2) Phage viability/infection test
- E coli BL21 supports the growth of bacteriophage T2, T3 30, and T7. On the other hand, E coli B and E coli W3110 support bacteriophage T1, T2 30, T3 30, T4, and T7. Other phage stocks either do not infect the bacteria strains tested or have died during storage in the fridge.
- Because E coli B is the strain routinely used for the Large Phage Group's experiments, we decided to base our modeling on E coli B.
3) Spot test to estimate phage titer
- T1 formed plaques up to -3; T2 -5; T3 -6; T4 -7; T7 -6.
4) Preliminary titer test
- The LB used to dilute x2 top agar was contaminated. Thus, all of the plates were contaminated. Although we were able to see plaques, the results from this round of experiment are not conclusive.
# Plaque per Plate
| Phage
| Dilution 1
| # Plaque 1
| Dilution 2
| # Plaque 2
|
| T1
| -2
| 18 w/ overlap
| -3
| 0
|
| T2
| -4
| 22 w/ overlap
| -5
| 6
|
| T3
| -5
| 33 w/ overlap
| -6
| 7
|
| T4
| -6
| a lot w/ overlap
| -7
| 47
|
| T7
| -4
| a lot w/ overlap
| -5
| 18
|
- An estimate of plaque sizes reveal: T4 < T1 < T7 < T2 < T3. The plaque sizes of T1, T7, T2, and T3 are very similar. Thus, many plaques will be needed to accurately determine a statistical significance.
5) Titer repeat
- No contamination this time. Yay!
- Results are similar to those observed in Preliminary Titer Test. T4 < T1 < T7 < T2 < T3. T2 and T7 are not behaving as expected. As a T4 like phage, T2 is forming plaques that are too big. Based on our experience working with T7, the observed plaques from this time are too small.
# Plaque per Plate on Average
| Phage
| Dilution 1
| # Plaque 1
|
| T1
| -2
| 6
|
| T2
| -5
| 5
|
| T3
| -6
| 5
|
| T4
| -7
| a lot
|
| T7
| -5
| 15
|
VI) Conclusion
- There are multiple variable intrinsic to the design of the modeling experiment that we'll have to control for. These include phage speciation (particle size, infection rate, lysis rate, etc), agar concentration, adsorption time, bacterial density, and incubation time.
- For actual experiments that model phage plaque size against phage particle size we will have to control for all variable apart from phage speciation. This implies that we will have to make top agar solution with a volumetric flask, measure adsorption time, use OD to determine bacterial density, and measure incubation time. It will be easiest if we can standardize adsorption time, bacterial density, and incubation time so that we can compare results between different experiments.
|
 "
"