 "
"
Team:Dundee/Project/MopQuantifying
From 2013.igem.org

Quantifying the Mop
Purification of PP1
In order to quantify the amount of PP1 mops present in the periplasm of an E. coli cell, it was necessary to produce some pure PP1 protein that we could use for quantification.
To achieve this, PP1 was produced as a fusion protein to glutathione-S-transferase (GST). The fusion contains a site for cleavage by PreScission protease so that the GST portion of the fusion protein could subsequently be removed. The plasmid expressing this fusion protein was called pGEX6P-1 PP1 CAT gamma and this was kindly gifted to us by scientists in the Division of Signal Transduction Therapy, College of Life Sciences, University of Dundee.
The plasmid construct was introduced into E. coli BL21 (DE3) cells. 8l cultures of these cells were grown until an optical density at 600nm of 0.4 was reached. At this time, the cultures were supplemented with 1mM IPTG to induce expression of the plasmid-encoded fusion protein (Fig 1A) and the cells were grown overnight at 20°C. The cells were then harvested by centrifugation, washed and the cell pellet resuspended in 25 mM Tris pH 7.5, 0.25 M NaCl, Complete Protease Cocktail (EDTA-free Roche), 0.1 mg/ml DNAse, 1 mg/ml lysozyme. Cells were lysed by sonication and the clarified cell extract was loaded onto GST beads (Qiagen – a kind gift of Professor Daan van Aalten, College of Life Sciences, University of Dundee). The beads were washed thoroughly to remove non-specifically bound proteins and then the tightly bound proteins were eluted with 50 mM glutathione, 25 mM Tris pH 7.5, 250 mM NaCl. At this stage, the eluted protein was highly enriched for the GST-PP1 fusion protein (Fig 1B, left hand lane).
The fusion protein was incubated overnight at 4 °C with 200 µg of GST-tagged PreScission Protease (a kind gift of Professor Daan van Aalten, College of Life Sciences, University of Dundee). The protease recognises the cleave sequence present between the GST and PP1 parts of the fusion protein, liberating un-tagged PP1. To remove the free GST, uncleaved fusim protein and PreScission protease from the sample, it was re-incubated with GST beads, with cleaved protein remaining in the supernatant. The purity of the cleaved PP1 protein was subsequently checked by SDS PAGE (Fig 1B, right hand lane). After this procedure, highly pure PP1 protein was obtained.

To determine the quantity of PP1 protein obtained, its absorption at 280nm was measured. Almost all proteins absorb at 280nm – this is due to the presence of tryptophan and tyrosine amino acids that absorb at this wavelength. An extinction coefficient for each protein can be determined by summing up the number of tryptophans and tyrosines present. We calculated that the extinction coefficient of pure PP1 is 34380 M-1.cm-1.
It is therefore possible to quantify the amount of PP1, in moles, present in the sample using the Beer-Lambert Law: A = εcl, where A is the absorbance at 280nm, ε is the molar extinction coefficient, c is the concentration of the compound in solution ( mol.L-1) and l is the path length of the sample in centimetres.
How many Mops are being made?
Since a known quantity of PP1 had been purified it was possible to carry out quantitative western blotting to elucidate the number of PP1 molecules that are present in the periplasm of each E. coli cell producing TorASP-PP1. When probed with anti-PP1 antibody a whole cell fraction of TorASP-PP1 cells gives two bands (Fig 2). The top band is TorASP-PP1 that is present in the cytoplasmic fraction and therefore has its signal peptide attached, whereas the bottom band is PP1 that has been exported into the periplasm and the signal peptide has been removed. When known quantities of purified PP1 are loaded on the same gel as the TorASP-PP1 cells it allows a direct comparison of a band produced from a known quantity of PP1 with the bands produced from a known number of cells. From this it is possible to correlate the level of PP1 being expressed with a known quantity of cells, allowing the calculation of the number of PP1 molecules present per cell.
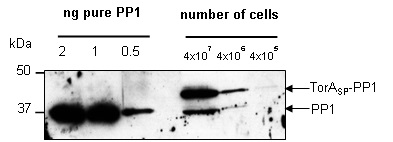
Figure 2. Quantifying the number of molecules of PP1 in the periplasm of each E. coli mop cell. The optical density at 600nm of an overnight culture of E. coli cells producing plasmid encoded TorASP-PP1 was measured and serial dilutions were loaded as indicated, alongside 2, 1 and 0.5ng of pure PP1. Following SDS PAGE (12% acrylamide), samples were transferred to PVDF membrane and probed with anti-PP1 antibody.
Given that the band of pure PP1 at a quantity of 0.5ng has a similar intensity to the 37kDa band of signal peptide-less PP1 from 4x10⁷ cells, it is logical to assume that there is approximately 0.5ng of PP1 present in that band. Assigning the value of 0.5ng of PP1 in being expressed in the periplasm of a total of 4x10⁷ cells then allowed us to calculate the number of PP1 molecules being expressed in the periplasm of each cell:
Theoretical molar mass of PP1 = 37.109 kg per mole
= 3.7109 x 10¹³ ng per mole
Moles in one ng? = 2.6947 x 10⁻¹⁴ moles
Molecules per ng? = 1.622 x 10¹⁰ molecules
In 0.5 ng? = 8 x 10⁹ molecules
At OD600 = 1
E. coli = 0.8 x 10⁹ cells per ml
(Cell number taken from “Gene cloning and DNA analysis: An introduction”, T.A. Brown)
At OD600 = 51 absorbance units per ml = 4.08 x 10¹⁰ cells per ml
In 1µl? = 4.08 x 10⁷ cells loaded
Therefore the number of PP1 molecules in the periplasm per cell
=8 x 10⁹ molecules / 4.08 x 10⁷ cells loaded
= 196.1 molecules of PP1 in the periplasm per cell
The precursor form of TorASP is also present on the blot, migrating above the 37kDa marker. This is PP1 that has not yet been exported to the periplasm In the 4x10⁶ cells lane this band has approximately half the band intensity of the 0.5ng pure PP1. This larger protein band is composed of PP1 still bound to TorASP in the cytoplasm and has therefore not been exported. Considering this it was possible to calculate the number of non-exported PP1 molecules trapped in the cytoplasm.
0.5ng of PP1 = 8 x 10⁹ molecules
0.25ng of PP1 = 4 x 10⁹ molecules
Number of cells expressing 0.25ng of PP1? = 4.08 x 10⁶ cells loaded
Therefore the number of PP1 molecules in the cytoplasm per cell
= 4 x 10⁹ molecules / 4.08 x 10⁶ cells loaded
= 980.4 molecules of PP1 in the cytoplasm per cell