 "
"
Team:Dundee/Project/MopTesting
From 2013.igem.org

Testing the Mop
After confirming that some of the PP1 localises to the periplasm of E. coli when fused to the TorA signal peptide we wanted to test the ability of our mop cells to clean up the toxin. The quantification experiments showed that only about 1/5th of the total PP1 protein was exported to the periplasm, so in our mop-producing cells there will be PP1 present in both periplasmic and cytoplasmic compartments. Since we also wanted to determine whether the cellular location of PP1 was important for the mop to function, we engineered a control plasmid that would produce stable PP1 in the cytoplasm. To achieve this we fused PP1 to the N-terminal 36 amino acids of the E. coli NarG protein. NarG is a cytoplasmic protein that is produced at similar levels to TorA. This plasmid was called pUni-prom NarG-PP1.
Preparing cells for the mop experiment
500 ml cultures of E. coli MG1655 cells carrying either (i) the pUni-prom ‘empty’ vector control, or pUni-prom encoding (ii) TorASP-PP1 or (iii) NarG-PP1 were grown overnight. The following day the cells were harvested and washed, and the cell pellets weighed and re-suspended in TBS buffer to a concentration of 1 g cells/ml. The optical density at 600nm of these cell suspensions was also measured, allowing us to enumerate the number of cells, and therefore mops, present in our experiment.The Mop Experiment
0.5 ml of the re-suspended E. coli cells was incubated with TBS buffer containing microcystin-LR (Enzo Life Sciences), at a final concentration of 5nM, for 1 h at room temperature. The final volume of the reaction was 1ml. After incubation the bacterial cells were removed by pelleting and supernatant was withdrawn, snap frozen, and stored at -80oC.In order to measure the microcystin concentration of the samples the microcystin (ADDA specific) ELISA kit from Enzo was used, according to the manufacturer’s instructions.
TorASP-PP1 cells "Mop" up Microcystin
The ELISA that we used is an indirect competitive ELISA. The sample is placed in a well of a 96 well plate and so is the microcystin (ADDA specific) primary antibody. Microcystin present in the sample competes with microcystin bound at the bottom of the wells for binding of the primary antibody. The secondary antibody is HRP-conjugated and if it binds to primary antibody:microcystin complexes at the bottom of the well this will result in a colour change. The intensity of the colour is inversely proportional to the concentration of microcystin present in the sample. The absorbance was read at 450 nm and by measuring standards of known microcystin concentration, a standard curve was constructed to allow us to calculate microcystin concentration in the samples. As shown in Fig 1, the microcystin concentration in the no cells control sample measured 4.3 nM, whereas, by treating the microcystin contaminated buffer with our TorASP-PP1 ‘Mop’ cells the concentration was reduced to 0.26 nM. Cells expressing an ‘empty’ vector or cytoplasmic NarG-PP1 did not mop up microcystin. Therefore we can conclude that it only PP1 in the periplasm can mop up the microcystin.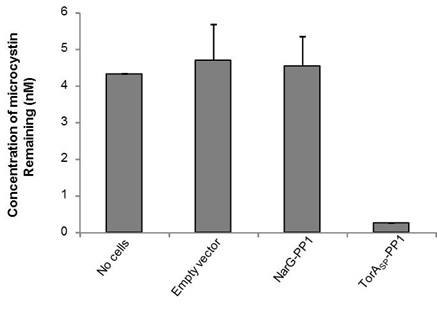
Figure 1: Periplasmically-located PP1 can remove microcystin from solution. E. coli cells (0.5 ml) containing (i) an ‘empty’ plasmid vector, or the same vector producing PPI fused C-terminal to either (ii) the TorA signal peptide (TorASP-PP1) or (iii) the first 36 amino acids of the cytoplasmic protein NarG were incubated with TBS buffer containing 5 nM microcystin for 1 h at room temperature. The concentration of microcystin remaining in solution after pelleting the cells was determined by competitive ELISA.
How efficient were our ‘Mop’ cells at cleaning up microcystin?
We started with 1 ml of a 5 nM solution of microcystin, which is approximately 5 pmoles (5 x 10-12 moles) of the toxin. If we multiply by Avogadro’s number (6.02 x 10²³), this gives us approximately 3.01 x 10¹² molecules of microcystin in the experiment. From measuring the optical density of our re-suspended cells, we determined that we added 2.04 x 10¹⁰ cells to the experiment, and since the counting experiment showed that each E. coli cell has approximately 200 mops in the periplasmic compartment, there would be a total of 4.08 x 10¹² accessible mops in the experiment. We therefore estimate that approximately 70% of the periplasmic mops had bound microcystin during the course of this experiment.How relevant was the concentration of microcystin used in this experiment?
The main route of human exposure to cyanobacterial toxins is through contaminated drinking water. For two drinking-water supplies in Alberta, Canada, levels of microcystin ranged from 0.15 to 4.3 nM (1). The World Health Organization (WHO) has proposed an upper limit for microcystin-LR of 1 nM in drinking water. Our ‘Mop’ cells when exposed to microcystin levels similar to those found in Alberta drinking water successfully reduced the concentration of the toxin to safe levels according to WHO guidelines (2).Developing a prototype ‘Mop’ device for application in freshwater systems
We wanted to trial a device that could be used to clear cyanobacterial toxins from freshwater systems such as Clatto reservoir for example. Our main concern was in ensuring that our genetically engineered bacteria could not escape from our device into the surrounding environment. Therefore we wanted to prevent our ‘Mop’ cells from escaping but it was crucial that contaminated water could still interact with the cells. We decided to contain our cells within dialysis tubing. Dialysis tubing is a semi-permeable membrane composed of cellulose. The tubing is studded with pores and we chose a pore size of 8000 Da, this pore size is too small to allow the passage of whole bacterial cells. Microcystin has a molecular weight of around 1000 Da and so should freely move through the pores. This decision was an attempt to address some of the safety concerns that were expressed to us through our consultation process as the engineered bacteria would not be released into a complex ecosystem. A ‘blueprint’ of our device is shown in Fig 2.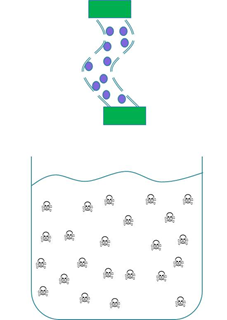
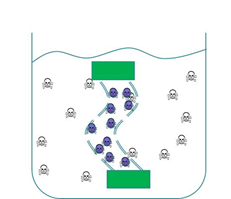
Figure 2: The ‘blueprint’ of our ‘Mop’ Device. Left: The ‘Mop’ cells (shown as purple circles) are contained within dialysis tubing with a pore size of 8000 Da. Each end of the tubing is sealed with a dialysis clip (Green rectangle). Right: The dialysis bag is submerged into a beaker containing microcystin (shown as skull and crossbones). The microcystin should be able to move through the pores as it is much smaller than the pore size. When microcystin interacts with periplasmic PP1 a covalent bond will be formed and the toxin will be pulled out of solution.
Testing the ‘Mop’ device
Cells for trialling our ‘Mop’ device were again grown and prepared as above. A picture of our first ‘Mop’ device is shown in Fig 3. To trial our ‘Mop’ device we put 1 mL of the 1 g per mL ‘Mop’ cell suspension into the dialysis tubing, we also set up devices containing the control cells as described above. The dialysis tubes were placed into individual beakers, each containing 200 mL of 5 nM microcystin in TBS solution. The devices were incubated with stirring at room temperature for 1 h before 1 mL of the microcystin solution was removed, snap frozen and stored at-80OC. The samples were analysed the next day using the ELISA kit as before. Sadly, our Mop device did not successfully reduce the microcystin concentration. We have since repeated the experiment with a longer incubation time (24 h) and still there was no reduction in microcystin concentration. Our final experiment involved using 4 g of the cell suspension, but again the microcystin concentration in our sample was not significantly reduced. However, according to our results from the direct contact experiment, described above, for the ‘Mop’ device to be as effective then we would need 70 g of cells. This is based on the fact that 70% of the mops were occupied in the 0.5 g of cells used. So assuming that cell/microcystin interactions are not inhibited by the dialysis bag then 0.35 g of cells would be sufficient to clean up 1 mL of microcystin to the level that we saw in the direct contact experiment. Since we had 200 mL of contaminated water then we would need 200 x 0.35 g (70 g) of cells to clean the water to the same standard. We are currently working on a number of methods utilising pumps and filtration to increase the number of PP1/microcystin interactions. We are also working on methods to increase the number of PP1 mops in the periplasm by overproducing the Tat transport machinery. We are hopeful that we can develop a device that overcomes these issues since the principle of using our E. coli cells as a mop has been proven.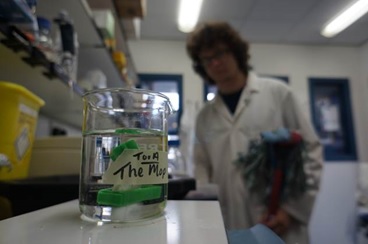
Figure 3: The ‘Mop’ device. The ‘Mop’ was constructed according to the blueprint in Fig 2. In the background you can see our team member John Allan holding a real mop!
References
- Hrudey SE, Lambert TW, et al. (1994). "Health risk assessment of microcystins in drinking water supplies." Toxic cyanobacteria - a global perspective Adelaide, Australian Centre for Water Quality Research: 7-12.
- WHO (2011). "Guidelines for drinking-water quality."