 "
"
Team:BYU Provo/Notebook/SmallPhage/Summerexp/Period2/Exp/7.27 Bacteria Growth Curve After Dilution
From 2013.igem.org
(Difference between revisions)
| (3 intermediate revisions not shown) | |||
| Line 16: | Line 16: | ||
<font color="#333399" size="3" font face="Calibri"> | <font color="#333399" size="3" font face="Calibri"> | ||
| - | : | + | <font size = "4"> |
| + | |||
| + | : <u> '''Small Phage''' </u> </font> | ||
: [[Team:BYU Provo/Notebook/SmallPhage/Winterexp|March-April]] | : [[Team:BYU Provo/Notebook/SmallPhage/Winterexp|March-April]] | ||
| Line 68: | Line 70: | ||
OD600 of the BL21 liquid culture overnight was 1.063. Surprisingly, this is different than our results from [[Team:BYU Provo/Notebook/SmallPhage/Springexp/Period2/Exp/5.13 Determining E coli concentration with spectrophotometer|5.13 Determining E coli Concentration With Spectrophotometer]]. This implies that we'll have to take several more measurements with overnight liquid culture to determine whether the concentration of bacteria in liquid culture is stable. | OD600 of the BL21 liquid culture overnight was 1.063. Surprisingly, this is different than our results from [[Team:BYU Provo/Notebook/SmallPhage/Springexp/Period2/Exp/5.13 Determining E coli concentration with spectrophotometer|5.13 Determining E coli Concentration With Spectrophotometer]]. This implies that we'll have to take several more measurements with overnight liquid culture to determine whether the concentration of bacteria in liquid culture is stable. | ||
| + | |||
| + | <center> | ||
{| class="wikitable" | {| class="wikitable" | ||
| Line 119: | Line 123: | ||
|} | |} | ||
| - | 2. | + | </center> |
| + | |||
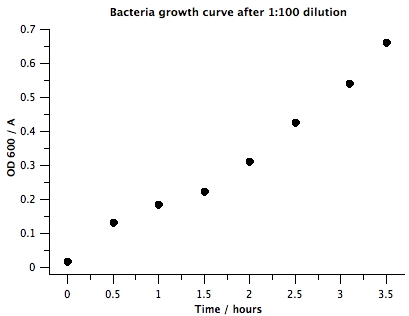
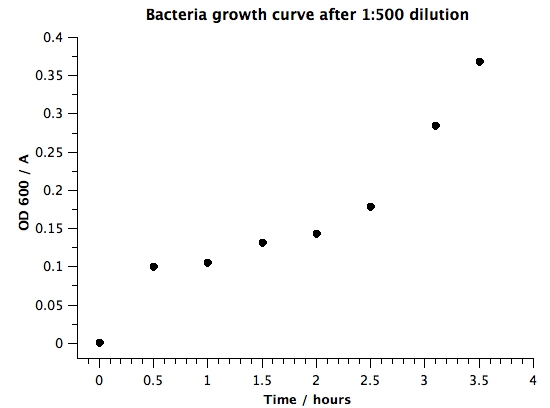
| + | 2. Plots | ||
| + | |||
| + | [[File:BYUSPBacteriaGrowth50.JPG|400px|center|link=]] | ||
| + | |||
| + | |||
| + | [[File:BYUSPBacteriaGrowth100.JPG|400px|center|link=]] | ||
| + | |||
| + | |||
| + | [[File:BYUSPBacteriaGrowth500.JPG|400px|center|link=]] | ||
'''VI) Conclusion''' | '''VI) Conclusion''' | ||
Latest revision as of 15:37, 9 September 2013
| |||||||||||||||||||||||||||||||||||||
|
|
7.27 Bacteria Growth Curve After Dilution
I) Purpose
1. Bacteria preparation
2. Measurements using spectrophotometer
1. Raw data OD600 of the BL21 liquid culture overnight was 1.063. Surprisingly, this is different than our results from 5.13 Determining E coli Concentration With Spectrophotometer. This implies that we'll have to take several more measurements with overnight liquid culture to determine whether the concentration of bacteria in liquid culture is stable.
2. Plots 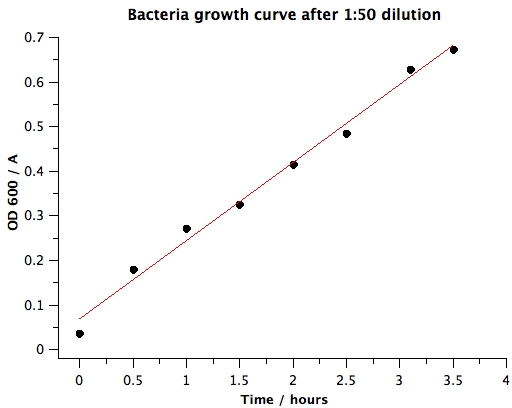
 VI) Conclusion
| ||||||||||||||||||||||||||||||||||||