"
"
Team:Tokyo Tech/Project/Farming
From 2013.igem.org
| Line 33: | Line 33: | ||
<h2> | <h2> | ||
<p> | <p> | ||
| - | We | + | We improved a phosphate sensor part by using the inducible promoter of the alkaline phosphatase gene (<i>phoA</i>) from <i>E. coli</i> (M. Dollard et al., 2003). This promoter is repressed by high phosphate concentrations (Fig. 2-3-4). To know more about the mechanism of this promoter, please click <font size ="5">[https://2013.igem.org/Team:Tokyo_Tech/Experiment/phoA_Promoter_Assay#1._Introduction here]</font size>. We amplified the <i>phoA</i> promoter from <i>E. coli</i> (MG1655) and ligated this promoter into GFP part to construct the new part ([http://parts.igem.org/Part:BBa_K1139201 BBa_K1139201]). We then introduced this new part into <i>E. coli</i> (MG1655). Fig. 2-3-5 shows the result of our induction assay. It shows that the increase in phosphate concentration repressed the <i>phoA</i> promoter. Especially, we see that the <i>phoA</i> promoter is drastically repressed at phosphate concentrations of 100 to 200 microM. |
| + | |||
| + | Though we also assayed OUC-China’s phosphate sensor part including <i>phoB</i> promoter ([http://parts.igem.org/Part:BBa_K116401 BBa_K116401]) by the same method as that for our <i>phoA</i> promoter assay, their part did not respond to the increase in phosphate concentration (Fig. 2-3-6). Thus, we concluded that we improved the phosphate sensor part (Note that the scales of the vertical axis are different between the two results). | ||
| + | |||
| + | |||
| + | |||
| + | To know more about this assay, please see <font size ="5">[https://2013.igem.org/Team:Tokyo_Tech/Experiment/phoA_Promoter_Assay#1._Introduction here]</font size>. | ||
<gallery widths="350px" heights="250px" style="margin-left:auto; margin-right:auto; text-align: center;"> | <gallery widths="350px" heights="250px" style="margin-left:auto; margin-right:auto; text-align: center;"> | ||
| - | Image:Titech2013_farming_Fig_2-3-5_phoa.png|Fig. 2-3-5. Our <i>phoA</i> promoter | + | Image:Titech2013_farming_Fig_2-3-5_phoa.png|Fig. 2-3-5. Our induction assay result for our <i>phoA</i> promoter |
| - | Image:Titech2013_farming_Fig_2-3-6_phob.png|Fig. 2-3-6. OUC-China 2012's <i>phoB</i> promoter | + | Image:Titech2013_farming_Fig_2-3-6_phob.png|Fig. 2-3-6. Our induction assay result for OUC-China 2012's <i>phoB</i> promoter |
</gallery> | </gallery> | ||
| - | From our results explained above, we determined parameters for the induction mechanism. By fitting the results to the following Hill equation (Fig. 2-3-7), we identified m | + | From our results explained above, we determined parameters for the induction mechanism. By fitting the results to the following Hill equation (Fig. 2-3-7), we identified the parameters for the induction mechanism. α denotes the maximum GFP expression rate in this construct. m denotes the phosphate concentration at which the GFP expression rate is half of α. β denotes the hill coefficient. Those parameters (Fig. 2-3-8) can be used in our future modeling. Plants are reported to be in phosphate starvation when its concentration is below 1 mM (D. Hoagland et al., 1950). Our part can sense also the concentration below 1 mM (Fig. 2-3-9). Therefore, our improved part is useful for our farming circuit. Moreover, a sensor for phosphate concentration is valuable for various studies in synthetic biology. |
| - | + | ||
| - | + | ||
</p> | </p> | ||
| Line 50: | Line 54: | ||
<br><br><br> | <br><br><br> | ||
[[Image:Titech2013_farming_Fig_2-3-8.png|240px|thumb|left|Fig. 2-3-8. Determined parameters]] | [[Image:Titech2013_farming_Fig_2-3-8.png|240px|thumb|left|Fig. 2-3-8. Determined parameters]] | ||
| + | |||
<br><br><br><br><br><br><br><br><br><br> | <br><br><br><br><br><br><br><br><br><br> | ||
</h2> | </h2> | ||
Revision as of 08:27, 27 October 2013

Farming
Contents |
1. Introduction

 Fig. 2-3-1. E. ninja turns to farming.

In our story, E. ninja retires from being an undercover warrior, and turns to farming (Fig. 2-3-1). Our improved part for phosphate sensor and a new part for cytokinin synthesis will lead us to our goal, which is to create “Farmer E. coli” that could increase plant growth by synthesizing several plant hormones depending on the soil environment. As for sensing soil nutrients, we focused on phosphate and nitrate because these are known to be especially important for plants. When nutrient levels are low, plants are in danger of withering. Therefore, we are proposing E. coli to produce the plant hormone “auxin,” which promotes the growth of plants’ roots (Fig. 2-3-2). Also, when the soil is rich in nutrients, plants can grow quickly. Therefore, we want to make E. coli produce the plant hormone “cytokinin,” which promotes the growth of plants’ shoots.

Our "Farmer E. coli" can be implemented by combining our improved phosphate sensor part (BBa_ K1139201), our newly constructed cytokinin production part and two pre-existing parts which are the nitrate sensor part (Edinburgh 2009, BBa_K216005) and the auxin production part (Imperial College 2011, BBa_K515100) (Fig. 2-3-2). Since the existing phosphate sensor part (OUC-China 2012, BBa_K116401) does not have sufficient data, we improved the part by using a different promoter. We also learned methods for quantitative analysis for cytokinin through bioassay of cucumber seed sprouts (Fig. 2-3-3) and through using ultra-performance liquid chromatography (UPLC).

In addition, to achieve the natural plants’ temporal pattern for producing plant hormones in E. coli, we introduced an incoherent feed forward loop to our circuit, including a new hybrid promoter part (BBa_K1139150). Our mathematical model for this system predicted that we can create temporal pattern for plant hormone production.
2. Phosphate dependent expression regulation
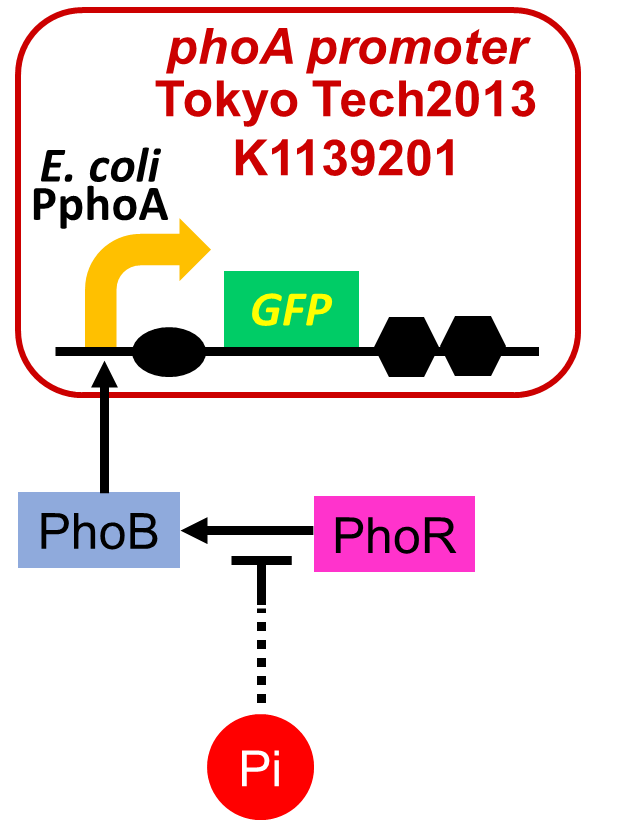 Fig. 2-3-4. Our phosphate sensor part including phoA promoter

We improved a phosphate sensor part by using the inducible promoter of the alkaline phosphatase gene (phoA) from E. coli (M. Dollard et al., 2003). This promoter is repressed by high phosphate concentrations (Fig. 2-3-4). To know more about the mechanism of this promoter, please click here. We amplified the phoA promoter from E. coli (MG1655) and ligated this promoter into GFP part to construct the new part (BBa_K1139201). We then introduced this new part into E. coli (MG1655). Fig. 2-3-5 shows the result of our induction assay. It shows that the increase in phosphate concentration repressed the phoA promoter. Especially, we see that the phoA promoter is drastically repressed at phosphate concentrations of 100 to 200 microM. Though we also assayed OUC-China’s phosphate sensor part including phoB promoter (BBa_K116401) by the same method as that for our phoA promoter assay, their part did not respond to the increase in phosphate concentration (Fig. 2-3-6). Thus, we concluded that we improved the phosphate sensor part (Note that the scales of the vertical axis are different between the two results). To know more about this assay, please see here.
 Fig. 2-3-5. Our induction assay result for our phoA promoter |
 Fig. 2-3-6. Our induction assay result for OUC-China 2012's phoB promoter |
From our results explained above, we determined parameters for the induction mechanism. By fitting the results to the following Hill equation (Fig. 2-3-7), we identified the parameters for the induction mechanism. α denotes the maximum GFP expression rate in this construct. m denotes the phosphate concentration at which the GFP expression rate is half of α. β denotes the hill coefficient. Those parameters (Fig. 2-3-8) can be used in our future modeling. Plants are reported to be in phosphate starvation when its concentration is below 1 mM (D. Hoagland et al., 1950). Our part can sense also the concentration below 1 mM (Fig. 2-3-9). Therefore, our improved part is useful for our farming circuit. Moreover, a sensor for phosphate concentration is valuable for various studies in synthetic biology.


3. Cytokinin synthesis
In order to construct cytokinin production part, we focused on AtIPT, a plant enzyme which catalyzes the synthesis of cytokinin. The mechanisms of cytokinin synthesis are shown in Fig. 2-3-10 (Takei et al., 2001). We ordered two DNA sequences of AtIPT (AtIPT4 and AtIPT7) derived from A. thaliana and are now constructing the part including one of them.

AtIPT, a plant enzyme, catalyzes the synthesis of iPRMP from DMAPP and AMP. According to the previous research, DMAPP, and AMP are provided by authentic metabolism in E. coli . It is also expected in the report that E. coli also has the enzymes which catalyze the synthesis of iP or tZ from iPRMP.
4. Quantitative analysis for cytokinin by bioassay
Before constructing genetic parts for cytokinin synthesis, we learned methods for quantitative analysis for cytokinin through a bioassay of cucumber seed sprouts (Flethcer et al., 1971; Porra et al., 1989) and through using ultra-performance liquid chromatography (UPLC).
In our bioassay of cucumber seed sprouts, we saw how cytokinin acts on plants. We planted the seeds and germinated for 5 days. Then, we cultivated the sprouts in standard cytokinin sample solutions. After 24 hours, we measured the weight of the sprouts and also homogenized them to measure the concentration of chlorophyll (Fig. 2-3-12). Fig. 2-3-11 shows the result that cytokinin increased the weight of the sprouts and the concentration of chlorophyll. The quantitative results are also shown in Fig. 2-3-13, 14 (iP, tZ are both sorts of cytokinin). To know more about this assay, please see here.
 Fig. 2-3-11. Cucumber seed sprouts respond to cytokinin samples |
 Fig. 2-3-12. Chlorophyll extraction |
 Fig. 2-3-13. Quantitative results of bioassay |
 Fig. 2-3-14. Quantitative results of bioassay |
iP : 6-(γ, γ-Dimethylallylamino) purine, tZ : trans-zeatin
The absorbance of the supernatant was read at 663.6 and 646.6 nm. Calculation of concentration of the chlorophyll was carried out as described by Porra et al.,1989.
Through ultra-performance liquid chromatography (UPLC), we plan to confirm that our “Farmer E. coli” actually produce cytokinin. Before completing the system to make E. coli produce cytokinin, we determined the retention times of iP and tZ in UPLC by using authentic samples of iP and tZ. The results are shown in Fig. 2-3-15. To see the detail method of this experiment, please click here.

5. Hybrid promoter for temporal pattern generation
In order to achieve the natural plants’ temporal pattern for producing plant hormones in E. coli, we introduced an incoherent feed forward loop (Mangan S et al., 2006) including a new hybrid promoter part (BBa_K1139150). Plants produce their hormones transiently rather than steadily (Takei et al., 2001). Moreover, continuous overexpression of hormones can be harmful to plants (K. Thiman, 1937). Thus, we thought that it should be important to achieve this transient temporal pattern for producing plant hormones in E. coli. The system of our designed incoherent feed forward loop is shown in Fig. 2-3-16. We newly developed the rm/lac hybrid promoter, which is activated by CI and repressed by LacI (Fig. 2-3-17). We plan to ligate a hormone synthase part downstream of this hybrid promoter. Our mathematical model (Fig. 2-3-18) shows what the temporal pattern for plant hormone production should achieve. While the rm/lac hybrid promoter activation by CI is a single-step reaction, repression by LacI is a two-step reaction. Thus, the activation of rm/lac hybrid promoter is faster than its repression. This time lag between activation and repression is important for generating a temporal pattern of plant hormone production (details about our mathematical model can be found here).
 Fig. 2-3-16. Our designed incoherent feed forward loop |
 Fig. 2-3-17. Our new designed hybrid promoter |

As a first step to achieve this incoherent feed forward loop, we constructed the circuit shown in Fig. 2-3-19 to confirm that our new rm/lac hybrid promoter actually works. We set GFP as the output of rm/lac hybrid promoter and introduced the circuit into E. coli . We have already confirmed that our new rm/lac hybrid promoter is actually activated by CI through an induction assay (Fig. 2-3-20). This part has been submitted (BBa_K1139150 new part). Details about this assay can be found here. We are now assaying induction in response to combinations of CI and LacI.
 Fig. 2-3-19. The circuit we constructed including the new part |
 Fig. 2-3-20. rm/lac hybrid promoter was activated by CI |
6. Applications
Our project will be applied to studying the plants’ response to external plant hormones. We programmed an incoherent feed forward loop to our new device of plant hormone production. By applying the incoherent feed forward loop, we can achieve pulse-generation of the output (Basu. S et al., 2003). Moreover, the pulse wave can be customized with changing the parameters, for example, intensity of promoters and various interactions. Utilizing the incoherent feed forward loop, we aim to construct artificial pulse-generator circuits which can output plant hormones in various pulse waves. Various artificial genetic circuits which can change the output chronologically, including incoherent feed forward loop, have been reported (Elowitz et al., 2000; Eileen et al., 2005). By combining plant hormone synthesis genes to these artificial genetic circuits, we will be able to make E. coli produce plant hormones in chronological patterns. Analyzing the response of plants to plant hormones given in temporal change leads to elucidate not only the sensitivity of plants’ response to plant hormones but also the abilities of plants in signal transduction. Therefore, our project contributes to constructing the pulse-generator for plant hormones using E. coli. Findings in plant science using this strategy must be important for contributing to agriculture and furthermore solving worldwide food shortages. We hope to meet public expectations by realizing agriculture aid by bacteria, though there may be some difficulties.
7. Reference
- Eileen Fung, Wilson W. Wong, Jason K. Suen, Thomas Bulter, Sun-gu Lee & James C. Liao. (2005) A synthetic gene–metabolic oscillator. Nature, Vol 435, 118-122
- Michael B. Elowitz & Stanislas Leibler. (2000) A synthetic oscillatory network of transcriptional regulators. Nature, Vol 403, 335-338
- R. A. FLETCHER, V. KALLIDUMBIL, AND P. STEELE. (1981) An Improved Bioassay for Cytokinins Using Cucumber Cotyledons. Plant Physiol, 69, 675-677
- R. A. FLETCHER and DIANNE McCULLAGH. (1971) Cytokinin-Induced Chlorophyll Formation in Cucumber Cotyledons. Planta (Berl.), 101, 88-90
- FREDERICK C. NEIDHARDT, PHILIP L. BLOCH, AND DAVID F. SMITH. (1974) Culture Medium for Enterobacteria. Journal of bacteriology, Vol 119, 736-747
- R.J. Porra, W.A. Thompson and P.E. Kriedemann. (1989) Determination of accurate extinction coefficients and simultaneous equations for assaying chlorophylls a and b extracted with four different solvents: verification of the concentration of chlorophyll standards by atomic absorption spectroscopy. Biochimica et Biophysica Acta, 975, 384-394
- Yi-Ju Hsieh and Barry L Wanner. (2010) Global regulation by the seven-component Pi signaling system. Current Opinion in Microbiology, 13, 198-203
- Marie-Andre´e Dollard, Patrick Billard. (2003) Whole-cell bacterial sensors for the monitoring of phosphate bioavailability. Journal of Microbiological Methods, 55, 221– 229.
- Subhayu Basu, Rishabh Mehreja, Stephan Thiberge, Ming-Tang Chen, and Ron Weiss. (2003) Spatiotemporal control of gene expression with pulse-generating networks. Proc. Natl. Acad. Sci. USA, 101, 6355-6360.
- HIDEO SHIXAGAWA'I', Kozo MAKINO AND ATSUO NAKATA. (1983) Regulation of the pho Regulon in Escherichia coli K-12 Genetic and Physiological Regulation of the Positive
Regulatory Gene phoB. J. Mol. Biol, 168, 477-488
-
Kenneth V. Thimann. (1938) On the Nature of Inhibitions Caused by Auxin. American Journal of Botany, 24, 407-412
- Kentaro Takei, Hitoshi Sakakibara1, Mitsutaka Taniguchi and Tatsuo Sugiyama. (2001) Nitrogen-Dependent Accumulation of Cytokinins in Root and the Translocation to Leaf: Implication of Cytokinin Species that Induces Gene Expression of Maize Response Regulator. Plant Cell Physiol, 42, 85–93
- Kentaro Takei, Hitoshi Sakakibara, and Tatsuo Sugiyama. (2001) Identification of Genes Encoding Adenylate Isopentenyltransferase, a Cytokinin Biosynthesis Enzyme, in Arabidopsis thaliana. THE JOURNAL OF BIOLOGICAL CHEMISTRY, 276, 26405-26410
- Mangan S, Itzkovitz S, Zaslaver A, Alon U. (2006) The incoherent feed-forward loop accelerates the response-time of the gal system of Escherichia coli. J Mol Biol, 356(5):1073-81