Team:Tokyo Tech/Modeling/Incoherent Feed Forward Loop
From 2013.igem.org
Incoherent Feed Forward Loop Modeling
Contents |
1. Introduction
In order to achieve the natural plants' temporal pattern for producing plant hormones in E. coli, we introduced an incoherent feed forward loop to our circuit, including a new hybrid promoter part ([http://parts.igem.org/Part:BBa_K1139150 BBa_K1139150]).
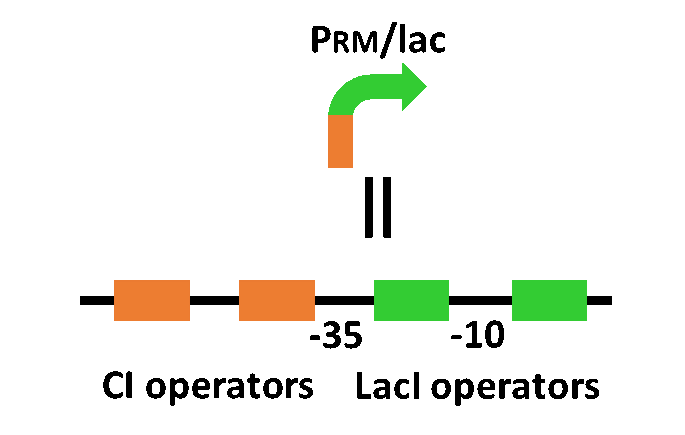
Our designed system with an incoherent feed forward loop is shown in Fig. 4-2-1. We newly developed RM/lac hybrid promoter, which is activated by CI and repressed by LacI (Fig. 4-2-2). We planned to ligate a plant hormone synthase part downstream of this hybrid promoter. While the RM/lac hybrid promoter activation by CI is a single-step reaction, the repression by LacI is a two-step reaction. Thus, the activation of RM/lac hybrid promoter is faster than the repression. This time lag between the activation and the repression is important for generating a temporal pattern of plant hormone production.
By the following mathematical model, we predicted that we can achieve pulse-generation of cytokinin as an output, using nitric acid (NO3-) as an input. In addition, we analyzed the relation between the waveform and the expression level of LacI.
2. Dynamic behavior of our circuit
2-1. Building a mathematical model
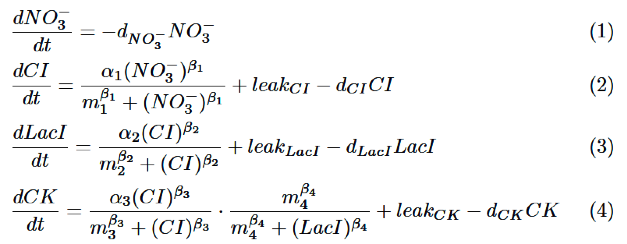
Our model is described by the following differential equations based on Hill equation.
We will explain each equation.
As for NO3-, we only take the degradation into consideration, assuming that NO3- act directly on nitrate promoter.
CI is activated by NO3-, LacI is activated by CI. Behaviors of CI and LacI are described by equation (2) and (3).
Finally, behavior of RM/lac hybrid promoter is shown as multiplication of the activation by CI and the repression by LacI. Therefore, the dynamics of cytokinin is described by equation (4).
We set the parameters as follows:
The values of the parameters are set as follows:
2-2. Simulation results of the incoherent feed forward loop
Fig. 4-2-9 shows the simulation results about the relation between the input (NO3-) and the output (cytokinin) in our circuit. The red line represents the concentration of NO3-, the green line represents the concentration of cytokinin.
As shown in Fig. 4-2-9, we verified the pulse-generation of cytokinin as the output. We will discuss the process of the pulse-generation by looking at the expression level of each substance.
First, NO3- as an input activates CI. CI continues to increase until the input is completely degraded because the expression level of CI depends on the volume of the input (Fig. 4-2-10).
Next, Fig. 4-2-11 shows that LacI and cytokinin are activated by CI. Also, in Fig. 4-2-12, which shows the enlarged view of Fig. 4-2-11 around 0 min., LacI is expressed after the expression of CI.
Finally, Fig. 4-2-11 also shows that cytokinin is repressed by LacI after it is activated by CI. Cytokinin is expressed during this time lag between the activation and the repression.
2-3. Relation between the waveform and the maximum level
of the LacI expression
In 2-2, we confirmed that the expression of LacI is deeply concerned with the expression of cytokinin. Here, we analyzed the waveform of the cytokinin output by changing the maximum level of the LacI expression (α2). Fig. 4-2-13 shows the change in the waveforms of cytokinin depending on the maximum level of LacI expression.
We see that the waveform of the cytokinin output changes depending on the maximum level of the LacI expression. In considering the application of this system, we predict that we can adapt the output waveforms to the circumstances of plants.
2-4. Relation between the output waveform and IPTG
Here, we will predict the activity of LacI by considering the volume of IPTG, which represses LacI. Decrease in LacI activity is described by equation (5) (γ denotes the decay rate constant.).
Substituting equation (5) for equation (4), we obtain equation (6).
Shown in equation (6), the pulse width of the cytokinin expression can be controlled by external IPTG. In the simulation by changing the value of γ, we obtained the result shown in Fig. 4-2-16.
Therefore, we confirmed that the pulse width of the cytokinin expression can be controlled by the volume of IPTG.
 "
"


