Team:DTU-Denmark/Notebook/9 August 2013
From 2013.igem.org
9 August 2013
Contents |
Lab 208
Who was in the lab
Kristian
Procedure
Gel purification
Gel purified AMO with USER endings and Nir1 extraction fragment made in yesterdays PCR.
Lab 115
Main purpose
Run Experiment 2 anaerobically in order to characterize the behavior of E.coli.
Who was in the lab
Ariadni, Helen, Natalia
Procedure
Adjusting the temperature at 37 degrees and calibrating the probes as described in Appendix 5.
Following the protocol Experiment 2
Changing the steps :
6. 3 ml of the overnight culture (from glycerol stock) in 200 ml of medium with OD=0.0317.
7. Then added 3 ml more after 2 hours and the OD was 0.1046. The OD after 1 hour was 0.1340. Afterwards we added glycerol 1g in 10 ml of water and then added in our growing culture. Then after 40 min the OD was 0.2737. (Setup wavelength 600 nm).
12. The OD was measured 0.1324 instead of 0.3.
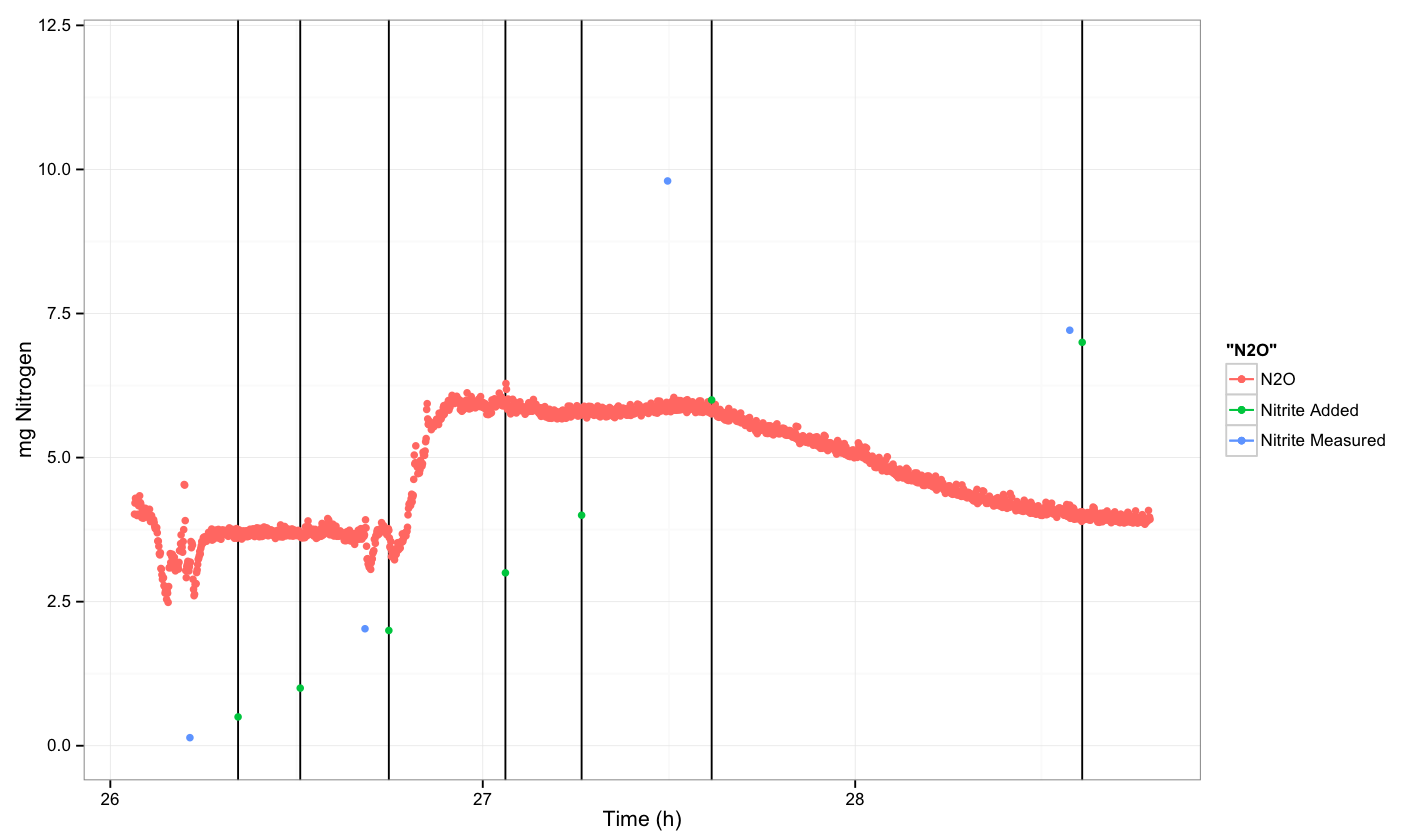
19. Add 0.5 ml of nitrite solution and continue by adding 0.5 ml after 10 minutes then we took 2.2 ml of sample, we added then 1 ml and we saw a slow response after 6 minutes. Afterwards when there was any change in the curve we spiked with 1 ml of nitrite. We continued as there was no response by adding 1 ml more and then by adding 2 ml more. We took 2 ml for sample in the end and another 2 ml for OD measurement where OD=0.1350. One hour after we took 2 ml of sample and then we spiked with 1 ml of NO2. There was no response after 12 minutes. Then we spiked with 0.5 ml of N2O and we show a big response.
Results
Colorimetric results
Ammonium
Measuring range 2-75 mg/L NH4-N
start point- signal <2 mg/L
middle point- signal 2 mg/L
end point- signal <2 mg/L
Nitrate
Measuring range 1-25 mg/L NO3-N
start point- signal <1 mg/L
middle point- signal <1 mg/L but visible pinker
end point- signal <1 mg/L but much visible pinker
Nitrite
Measuring range 0.02-1 mg/L NO2-N
start point- signal <0.02 mg/L
middle point- signal 0.29 mg/L
end point- signal 0.70 mg/L after X2 dilution
Point before spiking with NO2 at the end
measurement 1.03 mg/L (x2 dilution)- 0.5 mg/L (x4 dilution)
N2O measurement
Conclusion
The E.coli didn't grow as usual and the problem might be the minimal medium. Concerning the N2O sensor, after adding for third time 1 ml of nitrite the response was slow and started to get stabilized after 6 minutes. When we continue adding more nitrite there was no other response.
Navigate to the Previous or the Next Entry
 "
"


