Team:Imperial College/mainresults
From 2013.igem.org
Main Results
Resource-full Waste
Plastic Fantastic
We made P3HB bioplastic ▼
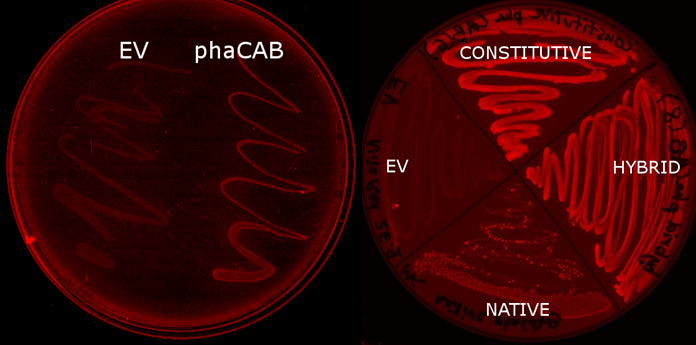
We used E. coli that expresses PhaCAB enzymes to make P3HB bioplastic. P3HB produced in cells were stained with Nile Red for fluorescent microscope imaging, and strong fluorescence was detected at the area where PhaCAB-expressing cells were streaked.
Our model predicts increased PhaB expression boosts P3HB production ▼
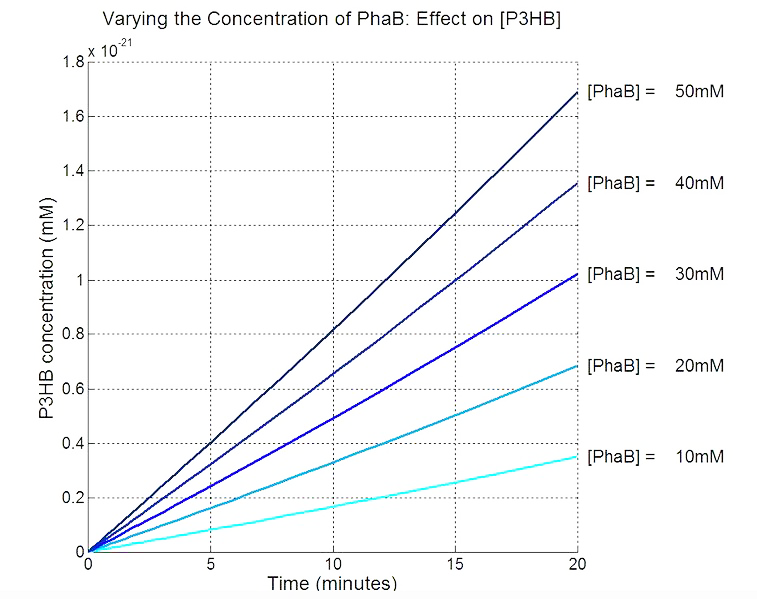
In order to realistically improve our experimental design, we produced P3HB synthesis model with considerations of central metabolic pathway within the cells. Our model predicts that during the synthesis of P3HB, the concentration of PhaB enzymes is an important rate limiting factor that can actually be regulated.
Refresh the page to see our video
Metabolic model preview
We simulated the interactions between metabolism pathways with our synthetic pathway
Preview to our GUI (Please refresh to see video):
'''We made a GUI so that the wet lab people could easily manipulate enzyme concentrations to see their effect on P(3HB) production.'''
We optimised P3HB bioplastic production ▼
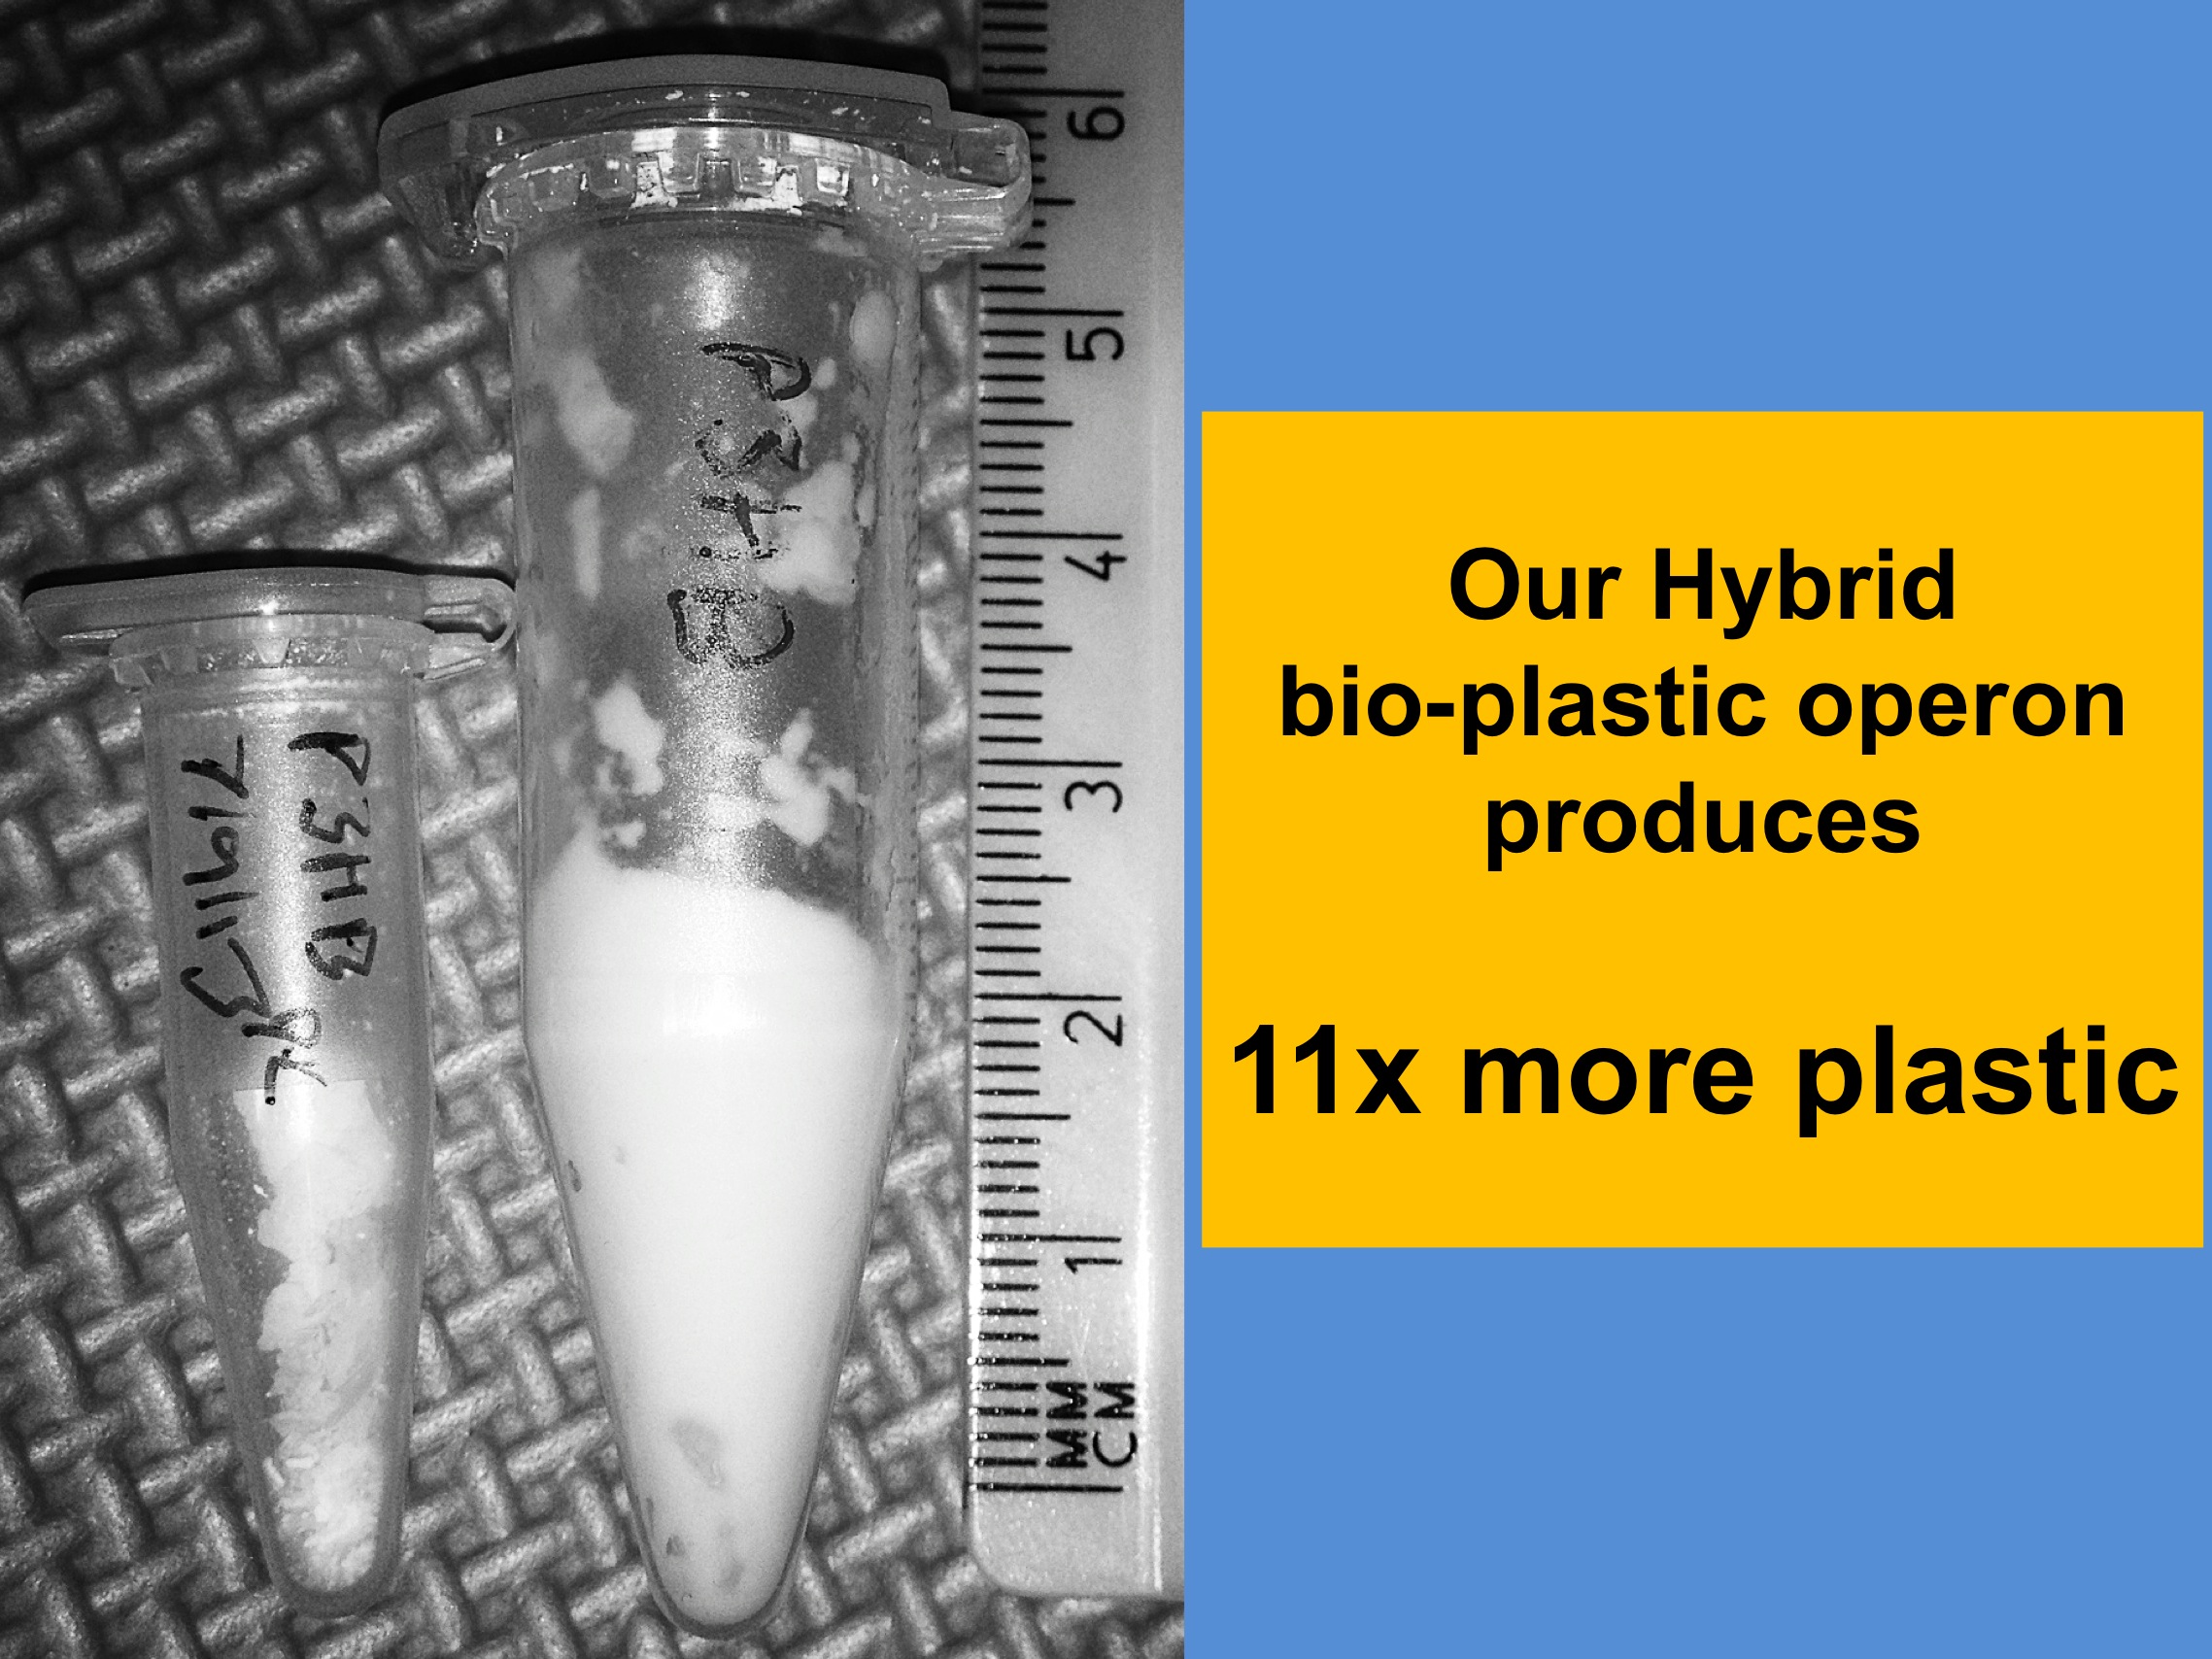
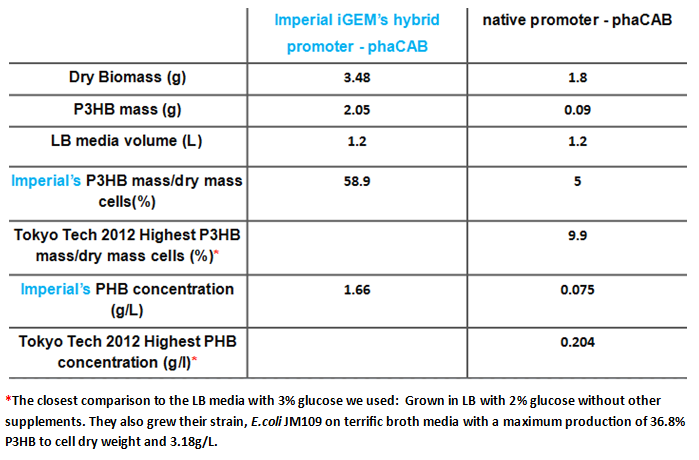
Since our model predicts that P3HB production can be significantly improved by expressing more P3HB polymerase PhaB, we designed a [http://parts.igem.org/Part:BBa_K1149051 hybrid promoter] which, consists of the J23104 constitutive promoter and the native promoter to optimise gene expression. Our results show that we have successfully produced 11-fold more P3HB bioplastic compared with the native promoter.
We made bioplastic from mixed waste ▼
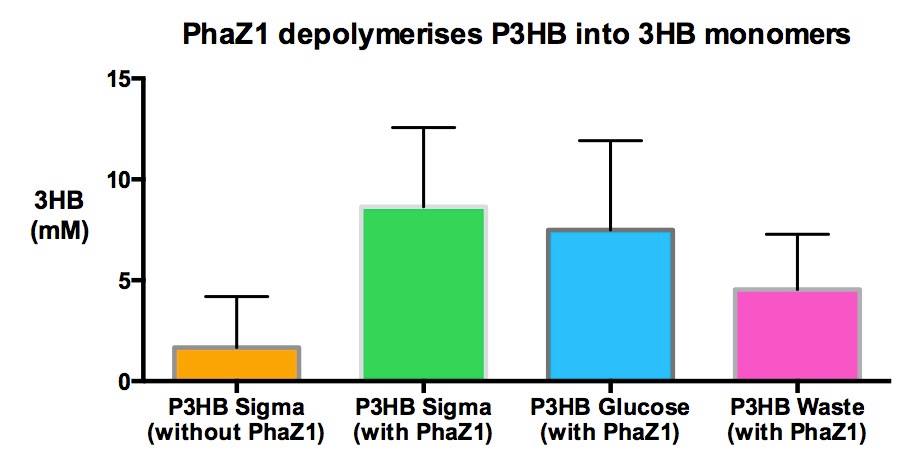
One of the objectives of Module 1 is to produce P3HB bioplastic from waste. We compared P3HB degradation by measuring the concentration of 3HB monomers, using P3HB we bought from sigma, we produced from glucose, and we produced from the waste collected from Powerday. We found that there is no significant difference between P3HB purchased from Sigma and P3HB we made from waste (t-test p= 0.12). Thus we conclude that we have made P3HB bioplastic from waste.
 We have detected 3HB monomers for the chemical analysis of the produced bioplastic. We synthesised P(3HB) using our improved Biobrick part (hybrid promoter phaCAB, BBa_K1149051). Our engineered bioplastic producing E.coli synthesised P(3HB) directly from waste. See data under 3HB assay #2 Imperial iGEM data |
We degraded P3HB ▼
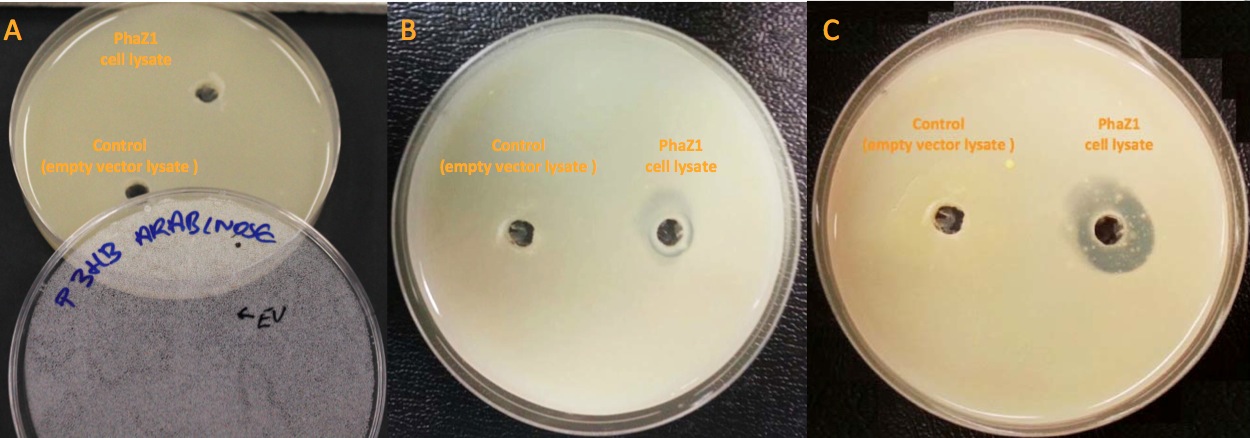
Our clearing zone assay indicates that P3HB depolymerase PhaZ1 started to fairly quickly degrade P3HB from the first day. After 3 days, there is evidently a clear zone around the well containing PhaZ1. We are the first iGEM team to degrade bioplastics!
We degraded P3HB we made from waste ▼
Using 3HB colourimetric assay kit, we have shown that we have degraded the P3HB made from waste into 3HB monomers with our own enzyme, phaZ1. In addition, there is no significant difference in 3HB concentration between different P3HB sources. This result proves that we now have a closed loop for P3HB bioplastic recycling!
3HB permease increases 3HB-uptake ▼

Performed after European Jamboree
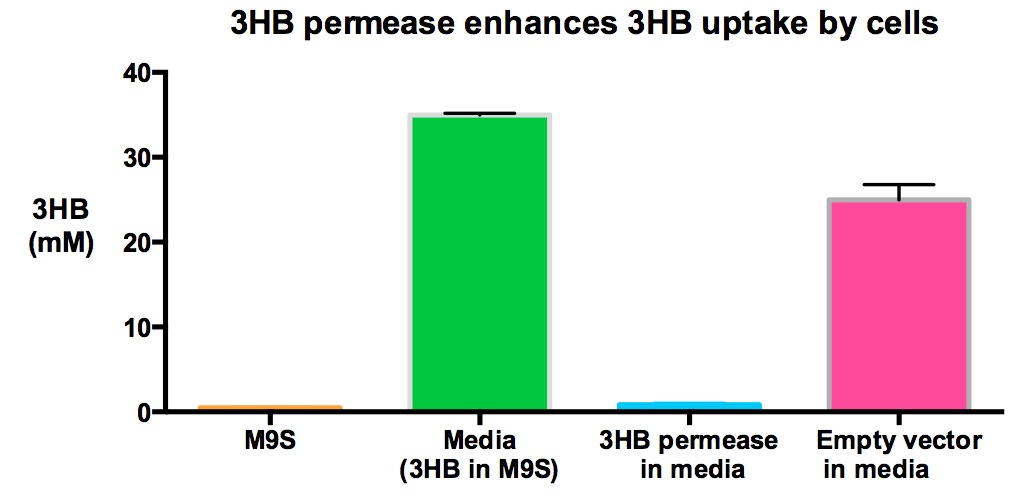
We also tested the concentration of 3HB in 3HB M9 supplement media to investigate if 3HB decreased significantly if cells express 3HB permease. Here we show that MG1655 with 3HB permease used significantly more 3HB in media than MG1655 empty vectors (p<0.01), given that the starting 3HB concentrations in the media are the same.
Performed after European Jamboree
 "
"


