Team:Newcastle/Modelling/L-form Switch
From 2013.igem.org

Contents |
L-form switch
Flux Balance analysis
What is flux balance analysis?
Flux balance analysis is used to analyse the flow of metabolites through metabolic networks whilst bearing stoichiometry in mind. All of the known metabolic reactions in a cell can be considered at one time. It is also surprisingly computationally un-intensive. The metabolic flux of each reaction can be altered. This has knock-on effects throughout the metabolic network as the system shifts to compensate for the change. The levels of a target molecule in the system can be tracked and in this way, reactions that have a large effect on the concentration of that target molecule can be identified.
What were we trying to do with flux balance analysis?
With our flux balance analyses, we sought to identify genes which, when their expression is reduced or when they are knocked out completely, effectively reduce the levels of peptidoglycan and therefore cell wall synthesis.
What we did
A genomic scale metabolic model, encoded in SBML, was taken from Tanaka et al. 2013 and this was used as the basis of the flux model. Python 2.7 was the main programming language used, libsbml was used as the file input/output handler and openCOBRA was used for the flux calculations (Ebrahim et al. 2013).
9 mmol/gDCW was specified as the maximum nutrient uptake rate and biomass maximisation as the primary objective function. Growth in LB was assumed and the composition of LB was as follows:
Heme, CMP, L-Cysteine, GMP, Pyridoxal, Lipoate, Thiamine phosphate, Fe2+, D-Alanine, Adenosine, L-Alanine, L-Arginine, Arsenate, L-Aspartate, Ca2+, Cd2+, chromate, L-Cystine, Deoxyadenosine, Deoxycytidine, fe3, Folate, D-Glucose, L-Glutamate, Glycine, H+, H2O, Hg2+, L-Histidine, HYXN, L-Isoleucine, Inosine, K+, L-Leucine, L-Lysine, L-Methionine, Mg, Na+, Niacin, L-Phenylalanine, Phosphate, PAN, L-Proline, Riboflavin, L-Serine, Sulfate, L-Threonine, Thymidine, L-Tryptophan, L-Tyrosine, Uracil, Uridine, L-Valine, Zn2+, O2, Cu2+, Co2+, Mn2+.
For each of the wild-type reactions whose fluxes that were greater that 1mmol/gDCW (Dry Cell Weight), the following computation was carried out:
1, The flux was reduced by 1mmol/gDCW and the resulting flux of peptidoglycan biosynthesis was calculated.
2, The difference in the flux of peptidoglycan biosynthesis before and after the above reduction in the flux was recorded.
3, An objective score was associated with each of these reductions. This score was calculated by dividing the difference in peptidoglycan synthesis flux by the wild-type peptidoglycan synthesis flux.
4, If the original reduction of flux reduced the biomass less than 90%, or if the objective score was >0.7 then that reaction was recorded as qualifying
5, These qualifying reactions were then sorted in descending order of their objective scores.
The results of flux balance analysis
The following ordered list of qualifying reactions are in quadruples as defined by: [reaction id, wild-type flux of the current reaction, flux reduction amount, score].
['rxn01241', 1.000618499350297, 1.0, 1616.8165730812357],
['rxn13568', -1.0185632326868364, 1.0, 53.869927553573405],
['rxn05299', 1.1180288321167855, 1.0, 8.472506099276947],
['EX_cpd00119_e', -1.1180288321167855, 1.0, 8.472506099276947],
['rxn05214', 1.2966240875912378, 1.0, 3.371270378345159],
['EX_cpd00254_e', -1.2966240875912378, 1.0, 3.371270378345159],
['rxn00295', 1.3347673357664207, 1.0, 2.987149262070587],
['rxn05213', -1.3844616788335349, 1.0, 2.60103946649253],
['rxn10199', 1.3899990875912378, 1.0, 2.564108562859282],
['rxn07466', -1.3899990875912378, 1.0, 2.564108562859282],
['rxn03901', 1.3899990875912378, 1.0, 2.564108562859282],
['rxn03904', 1.3899990875912378, 1.0, 2.564108562859282],
['rxn03408', 1.3899990875912378, 1.0, 2.564108562859282],
['rxn03164', 1.3899990875912378, 1.0, 2.564108562859282],
['rxn03086', -1.3899990875912378, 1.0, 2.564108562859282],
['rxn03030', 1.3899990875912378, 1.0, 2.564108562859282],
['rxn02929', -1.3899990875912378, 1.0, 2.564108562859282],
['rxn02286', 1.3899990875912378, 1.0, 2.564108562859282],
['rxn02285', 1.3899990875912378, 1.0, 2.564108562859282],
['rxn02011', 1.3899990875912378, 1.0, 2.564108562859282],
['rxn02008', 1.3899990875912378, 1.0, 2.564108562859282],
['rxn01974', 1.3899990875912378, 1.0, 2.564108562859282],
['rxn01972', 1.3899990875912378, 1.0, 2.564108562859282],
['rxn01644', 1.3899990875912378, 1.0, 2.564108562859282],
['rxn01643', 1.3899990875912378, 1.0, 2.564108562859282],
['rxn00461', 1.3899990875912378, 1.0, 2.564108562859282],
['rxn00337', 1.3899990875912378, 1.0, 2.564108562859282],
['rxn00193', 1.3899990875912378, 1.0, 2.564108562859282],
['rxn01516', 1.42347947080184, 1.0, 2.3613895571054333],
['rxn05514', -1.425287408760542, 1.0, 2.3513510614254978],
['rxn05301', 1.51649835766423, 1.0, 1.9361145784128309],
['EX_cpd00069_e', -1.51649835766423, 1.0, 1.9361145784128309],
['rxn05437', 1.6032601578065062, 1.0, 1.6576596134511288],
['rxn05435', 1.6032601578065062, 1.0, 1.6576596134511288],
['rxn05436', 1.6032601578065062, 1.0, 1.6576596134511288],
['rxn05434', 1.6032601578065062, 1.0, 1.6576596134511288],
['rxn05433', 1.6032601578065062, 1.0, 1.6576596134511288],
['rxn05376', 1.6032601578065062, 1.0, 1.6576596134511288],
['rxn05377', 1.6032601578065062, 1.0, 1.6576596134511288],
['rxn05372', 1.6032601578065062, 1.0, 1.6576596134511288],
['rxn05373', 1.6032601578065062, 1.0, 1.6576596134511288],
['rxn05375', 1.6032601578065062, 1.0, 1.6576596134511288],
['rxn05371', 1.6032601578065062, 1.0, 1.6576596134511288],
['rxn05369', 1.6032601578065062, 1.0, 1.6576596134511288],
['rxn05368', 1.6032601578065062, 1.0, 1.6576596134511288],
['rxn05367', 1.6032601578065062, 1.0, 1.6576596134511288],
['rxn05361', 1.6032601578065062, 1.0, 1.6576596134511288],
['rxn05363', 1.6032601578065062, 1.0, 1.6576596134511288],
['rxn05364', 1.6032601578065062, 1.0, 1.6576596134511288],
['rxn05365', 1.6032601578065062, 1.0, 1.6576596134511288],
['rxn05360', 1.6032601578065062, 1.0, 1.6576596134511288],
['rxn05359', 1.6032601578065062, 1.0, 1.6576596134511288],
['rxn05358', 1.6032601578065062, 1.0, 1.6576596134511288],
['rxn02934', 1.6032601578065062, 1.0, 1.6576596134511288],
['rxn02933', -1.6032601578065062, 1.0, 1.6576596134511288],
['rxn02270', -1.6032601578065062, 1.0, 1.6576596134511288],
['rxn01996', 1.6032601578065062, 1.0, 1.6576596134511288],
['rxn01355', 1.6032601578065062, 1.0, 1.6576596134511288],
['rxn00676', 1.6032601578065062, 1.0, 1.6576596134511288],
['rxn00602', -1.6032601578065062, 1.0, 1.6576596134511288],
['rxn01515', -1.7368672445244668, 1.0, 1.3570965563075672],
['rxn00416', 2.0256136861313823, 1.0, 0.9750259903141532],
['rxn10201', 2.0587092180882935, 1.0, 0.9445464183316505],
['rxn05306', 2.407450182481746, 1.0, 0.7105047215502205],
['EX_cpd00066_e', -2.407450182481746, 1.0, 0.7105047215502205]
Each of these reactions have associated enzymes which catalyse them, and these of course have associated genes. We looked at the function of these genes and their involvement in metabolic pathways in order to choose a gene to control in order to control peptidoglycan biosynthesis.
For example, details of the enzyme of for the top ranked reaction to have an effect on peptidoglycan biosynthesis are as follows:
rxn01241: pdhD, yqiV involved in Carbon metabolism [http://www.genome.jp/kegg-bin/show_pathway?bsu01200+BSU14610 KEGG pathway]; Glycolysis / Gluconeogenesis [http://www.genome.jp/kegg-bin/show_pathway?bsu00010+BSU14610 KEGG pathway]; Citrate cycle (TCA cycle) [http://www.genome.jp/kegg-bin/show_pathway?bsu00020+BSU14610 KEGG pathway]; Pyruvate metabolism [http://www.genome.jp/kegg-bin/show_pathway?bsu00620+BSU14610 KEGG pathway]; Glycine, serine and threonine metabolism [http://www.genome.jp/kegg-bin/show_pathway?bsu00260+BSU14610 KEGG pathway]; Valine, leucine and isoleucine degradation [http://www.genome.jp/kegg-bin/show_pathway?bsu00280+BSU14610 KEGG pathway]
It can be seen that this gene is involved in too many and too important cellular processes for its expression to be modulated, as this would likely cause harm to the cell.
Many of the genes which were highlighted, by this model, to decrease peptidoglycan biosynthesis if their expression was changed, were involved in too many cellular functions or were too essential for normal cell functioning for their expression to be altered drastically. Altering the flux of the reactions facilitated by the proteins encoded by the genes murC, murF, murG and murE were all shown to reduce peptidoglycan biosynthesis. The [http://www.genome.jp/kegg-bin/show_pathway?map00550 relevant KEGG pathway] was consulted and it was rationally decided that murE would be the best gene to target, as it is upstream of the other Mur proteins in the metabolic pathway which were shown to be good targets for removing peptidoglycan synthesis. murE is also not involved in many other metabolic pathways and thus would be least likely to disrupt other aspects of cellular function.
BioNetGen Modelling
Although it has been documented that L-forms can be produced by a specific mutation in the murE gene, we strongly suspected that preventing the expression of the entire murE operon would have the same effect. However we were not certain, and therefore modelled the biosynthesis of peptidoglycan, the primary component of the cell wall, using BioNetGen. Modelling was based on the [http://www.genome.jp/kegg-bin/show_pathway?map00550 KEGG pathway] for peptidoglycan synthesis in B. subtilis. The model put the operon under the control of a xylose inducible promoter, and demonstrated that at low xylose concentrations (and thus no expression of the murE operon) no peptidoglycan was produced. In the presence of xylose peptidoglycan synthesis did occur. As we were not worried about the quantity of peptidoglycan that was produced, just whether it was, arbitrary units were used for peptidoglycan production. This was also because quantifying peptidoglycan is non-trivial. These results gave the team confidence that the switch BioBrick we designed would work as desired. Experimental results later validated this.
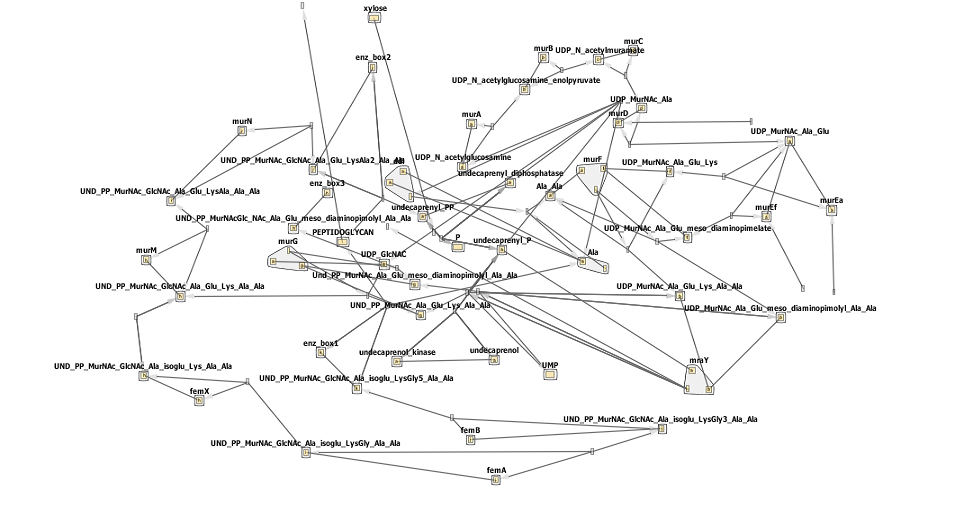
The biosynthesis of peptidoglycan is quite complicated, with one initial pathway splitting into 3, each fork results in peptidoglycan being formed. This can be seen by the network below- don't worry if it looks confusing! Synthesis can be broadly defined in a few steps steps.
- In the first step fructose 6-phosphate is converted to glucosamine-6-phosphate.
- Then an acetyl group is donated, creating N-acetyl-glucosamine-6-phosphate.
- This is subsequently isomerized to N-acetyl-glucosamine-1-phosphate.
- UTP reacts with this N-acetyl-glucosamine-1-phosphate forming UDP-N-acetylglucosamine. This is where the KEGG pathway, and our model, starts.
- UDP-N-acetylglucosamine is converted to UDP-N-acetylmuramic acid, and this undergoes multiple rounds of amino acid addition. It is these steps, indicated on the pathway below, that are governed by a few of the murE operon genes- murD, murE, murF,murG and mraY. The switching off of these genes prevents the addition to UDP-MurNAc-L-Ala of more amino-acids and thus prevent peptidoglycan biosynthesis.
- With a functional murE UDP-MurNAc pentapeptide is formed.
- This precursor then passes from the cytosol to the cytoplasmic membrane, and is converted to the lipid PP-MurNac penta.
- After a few more reactions a disaccharide is formed and added to a long glycan chain. One transglycoslyation later and peptidoglycan has been increased.
Results
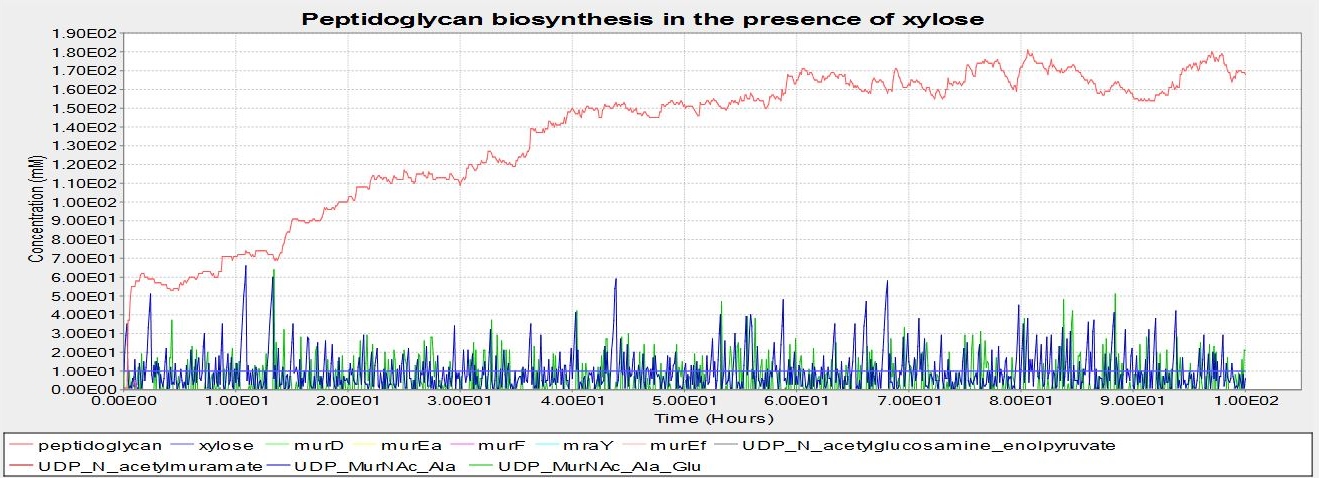
These are the results of simulating the model. The units of concentration on the y-axis are arbitrary, as are the units of time on the x-axis. These results suggest that B. subtilis cells that have been transformed with our BioBrick will be able to grow a cell wall if there is xylose present, but not without.
The model below represents peptidoglycan biosynthesis with xylose present:
The graph is below is from the simulation at 0mM xylose. No peptidoglycan is synthesised, suggesting that the BioBrick we have designed will function as desired. Note that, unlike the graph above, no UDP_murNAc_Ala_Glu_Lys is being synthesised. This is the product of the reaction murE catalyses- this suggests that it is the switching off of the murE operon genes causing the lack of peptidoglycan synthesis.
The circled enzymes are coded by genes found in the murE operon. As can be seen from the [http://www.genome.jp/kegg/pathway/map/map00550.png KEGG pathway] above these enzymes are at a branching point, with both subsequent sub-pathways synthesising peptidoglycan. So the switching off of a specific enzyme further along the pathway wouldn't prevent synthesis. Many of the enzymes upstream of murE are involved in other pathways, so preventing the synthesis of these enzymes would have other, potentially harmful side-effects. Therefore the murE operon is the perfect area to target for controlling cell wall synthesis.
This model is comprised of a vast number of reactions and substrates/enzymes, many of which have not been characterized. We were able to find parameters for the catalytic rates of murD, murE and murF, although not for B. subtilis. As these rates are similar, we extended these values to other enzymes in the pathway. Whilst this may not be fully accurate we aren't attempting to intricately quantify the amount of peptidoglycan, and so should not be a problem. Substrates involved in but not formed by the peptidoglycan biosynthesis pathway were kept high so as not to be rate limiting, and were chosen as the concentrations at which the enzymes best functioned in vivo as described by [http://link.springer.com/article/10.1007/s13238-010-0132-9?no-access=true Bhakta et. al].
Enzyme concentrations were set to a few millimolar and the simulation was done as an differential equations, as we were mostly interested in the model's qualitative behaviour. The The BioNetGen file (in .txt format, if you'd like to try it out just change the extension to .bngl)
Below is the network diagram for this model. It is very complicated so don't worry if you don't understand all of it!
References
[http://link.springer.com/article/10.1007/s13238-010-0132-9?no-access=true Basavannacharya C., Moody P., Munshi T., Cronin N., Keep N., Bhakta S. (2010) Essential residues for the enzyme activity of ATP-dependent MurE ligase from Mycobacterium tuberculosis. Protein & Cell 11,1011-1022]
[http://www.plosone.org/article/info%3Adoi%2F10.1371%2Fjournal.pone.0060143 Munshi T, Gupta A, Evangelopoulos D, Guzman JD, Gibbons S, et al. (2013) Characterisation of ATP-Dependent Mur Ligases Involved in the Biogenesis of Cell Wall Peptidoglycan in Mycobacterium tuberculosis. PLoS ONE 8(3): e60143. doi:10.1371/journal.pone.0060143]
[http://www.ncbi.nlm.nih.gov/pubmed/19212404 Leaver M., Dominguez-CuevasP., Coxhead J.M., Daniel R.A. and Errington J. (2009) Life without a wall or division machine in Bacillus subtilis. Nature, 457, 849-853.]
[http://www.ncbi.nlm.nih.gov/pmc/articles/PMC3592452/ Tanaka K., Henry C.S., Zinner J.F., Jolivet E., Cohoon M.P., Xia F., Bidnenko V., Ehrlich S.D., Stevens R.L and Noirot P. (2013) Building the repertoire of dispensable chromosome regions in Bacillus subtilis entails major refinement of cognate large-scale metabolic model. nucleic acids research, 41, 687-699]
[http://www.biomedcentral.com/1752-0509/7/74/abstract Ebrahim A., Lerman J.A (2013) Palsson B.O and Hyduke D.R,COBRApy: COnstraints-Based Reconstruction and Analysis for Python. BMC Systems Biology, 7, 74]
 "
"


