Team:SydneyUni Australia/Modelling Validation
From 2013.igem.org


Contents[hide] |
Constructing a model for the metabolic pathway
The rate of change for the intracellular concentration of metabolites (β, γ, δ and ε) is purely determined through the relative activity (described by MM equations) of the enzymes creating or removing the metabolite.
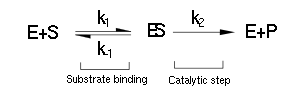
Luckily the enzymes of our metabolic pathway are accurately described by MM kinetics and all constants were available in the literature. The system is based on the forward and reverse kinetic rate (k1 and k-1 respectively) of substrate-enzyme binding followed by the irreversible catalytic step of product formation (k2) as depicted in the figure below:
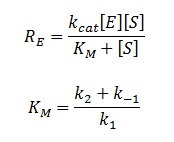
The rate of catalysis for an enzyme is a function of the enzyme and substrate concentration and incorporates the catalytic constant kcat and the Michaelis constant KM, which are given in most enzyme kinetics studies.
The symbol RE denotes the reaction rate: i.e. the rate of product formation (which is equal to the rate of substrate removal).
So, by observing:
i) that the rate at which a substrate is removed is directly equal to the rate at which the associated product is created (e.g. the rate at which γ is removed is the rate at which δ is formed),
ii) and how each intermediate simultaneously acts as a substrate and product (e.g. how an enzyme D creates a metabolite δ, and enzyme E uses δ to create another metabolite ε),
it is easy to see how this process gives rise to a connected system of ODEs.
DCA Diffusion Across the Plasma Membrane
We were presented with a scenario where it was necessary to model how DCA would move from the solution into the cell where it’s metabolised: i.e. linking αout and αin.
This was tackled by modelling the rate of DCA diffusion across a cell membrane through Fick’s first law of diffusion:
Fick’s first law of diffusion is justified since 1,2-DCA is non-polar and the cellular membrane is thin. The law states that the flux, J, of DCA across the membrane is equal to the permeability coefficient, P, times the concentration difference of DCA across the cell membrane. The flux has units m2 s-1. The permeability coefficient of DCA is not reported in the literature, so it had to be estimated from the definition of the permeability constant.
Where D is the diffusion constant for DCA diffusion across the plasma membrane and d is the length of the membrane. The partition coefficient for DCA across a plasma membrane is not documented, but can be estimated to be similar to the octanol-water partition coefficient (Kow). This constant determines the equilibrium ratio of DCA in octanol and water. Like many properties of DCA, the diffusion constant, D, is not documented in the literature. It was determined through the famous Stokes-Einstein equation:
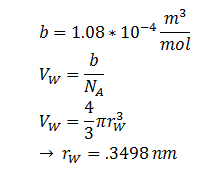
Where kB, T, η & r represent the Boltzmann constant (1.3806488 × 10⁻²³ m2 kg s-2 K-1), temperature, viscosity of the membrane and radius of DCA respectively. Here we must assume DCA is spherical. The ‘radius’ of DCA isn’t described in the literature. But the van der Waal constant, b, can be used to calculate the van der Waal volume, VW, and hence the van der Waal radius, rW3. Note DCA is not spherical, and this method is used to calculate atoms.
By combining all of the above, the flux can be described as:
| Symbol | Name | Value (units) | Ref |
|---|---|---|---|
| η | Cellular Membrane Viscosity | 1.9 kg/m/s | [6] |
| S | E. coli Membrane Surface Area | 6x10-12 m2 | [7] |
| d | Length of Cellular Membrane | 2 nm | [7] |
| r | DCA radius | 0.3498 nm | [8] |
| Kow | Octanol-water Partition Coefficient for DCA | 28.2 | [8] |
Extending the System to Cell Cultures
The model describes the process of DCA diffusion and metabolism of a single cell. So given a concentration of our engineered cells in solution one can calculate the rate at which the DCA concentration in solution (αout) decreases by simply multiply the flux rate of DCA across the membrane by the total concentration of cells in the solution. Letting Ψ represent the concentration of cells in solution, the overall rate of decrease of DCA in solution is:
Since the latter portion of the system of ODEs describes the intracellular concentrations within a single cell, the rate at which the DCA comes into the cell and is metabolised (dαin/dt) is simply:
The motivation for doing this is that it seems more natural to consider the intracellular metabolite concentrations of a single cell, rather than averaged across many. It also allows one to gauge whether chloroacetaldehyde reaches cytotoxic levels. The assumption made here is that all the cells in the solution are exactly the same.
Factoring in Cell Growth
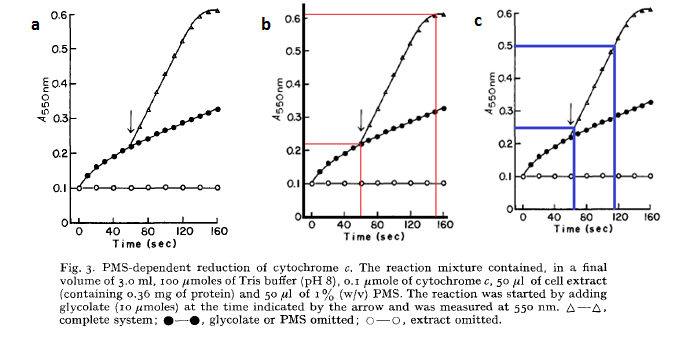
The cells are expected to grow due to the production of glycolate (used as a carbon source for growth). This means we can model the rate at which the cell concentration, Ψ, increases. Ideally one would want to experimentally determine the cell growth as function of time, but unfortunately we did not have enough time to do this. The growth of E. coli over time due to the presence of glycolate was initially described by Lord [9]:
It must be noted that this analysis is highly approximate, and is used only to obtain a very rough estimate of the growth rate as a function of glycolate produced.
By using the approximation that an OD550 of 0.1 = 1 x 10⁸ cells/mL one can use the above graph to generate rates of E. coli growth due to glycolate production. From graph a, it can be seen that 2.2 x 10⁸ cells use 3.33 mM of glycolate in 95 seconds. Or in other words, 1 cell uses 1.5789 x 10⁻¹⁰ mM of glycolate per second:
This assumes that only the original cells existing in solution from the graphs above (the 2.2 x 10⁸ cells) use glycolate for growth. From the graph b, the OD550 increases at a rate of 0.25 per 50 seconds (gradient of graph 2) which shows that the cells increase at a maximum rate of 5 x 10⁶ cells / mL / s when growing in saturated glycolate.
From the graphs it can be seen that the point where maximal growth no longer occurs (where the straight line becomes curved) is when glycolate is at a very low concentration. We will take it that the saturation point is so small that it is negligible – i.e. the growth rate is always maximal when in the presence of glycolate. So the cellular growth rate can be described as:
Using this approach, the model for growth rate is most appropriate for cell concentrations in the range of 2 x 10⁸ to 6 x 10⁸ cells/mL.
Estimating Protein Concentration
The accuracy of this model is strongly dependent on the intracellular enzyme concentrations; these cannot be determined theoretically as there is a weak correlation with the level of gene expression and protein abundance.
Ishihama et al. [10] profiled the protein concentration in E. coli as:
The enzyme-encoding-genes are under the regulation of an artificial promoter termed Psyn. The promoter is designed to be constitutive and drive high expression of the enzymes. We estimated the protein concentration as 10,000 protein units per cell - the upper quartile limit in the ‘Highly abundant group’ box in the figure above.
By taking the cell volume as 0.65 µm3 = 0.65 x 10⁻¹⁸ m3 [7]:
the intracellular concentration for all proteins is predicted to be 25.55 mM.
 "
"


