Team:Newcastle/Project/L forms
From 2013.igem.org
| Line 79: | Line 79: | ||
===L-form division=== | ===L-form division=== | ||
| - | The following videos and figures display the various methods through which L-forms actually divide. As mentioned above, as L-forms have lost their cell wall they divide independently of FtsZ-ring - a structure that most walled bacteria rely upon for division. Consequently, growth and division undertaken by L-forms occurs differently than the same process in cell walled bacteria. | + | The following videos and figures display the various methods through which L-forms actually divide. As mentioned above, as L-forms have lost their cell wall they divide independently of FtsZ-ring - a structure that most walled bacteria rely upon for division. Consequently, growth and division undertaken by L-forms occurs differently than the same process in cell walled bacteria. |
| + | |||
| + | Video 1 shows the simple increase in size of L-form cells over a period of time. This highlights the difference between L-forms and protoplasts (which neither grow or divide) and suggests the l-forms visible are taking up and metabolising materials. The L-form cells in this video are tagged with HBsu-GFP to make them more visible. | ||
<html> | <html> | ||
Revision as of 12:13, 25 September 2013

Contents |
L-forms
Overview
We propose the use of L-form bacteria as a chassis for synthetic biology. L-form strains are derivatives of common cell-walled bacterial strains; however, L-forms are cell wall deficient. Many modern bacteria have the capacity to switch into L-form state, though specifically we are investigating L-forms in the model Gram-positive bacteria Bacillus subtilis. Unlike protoplasts, L-forms are still able to propogate and grow like their cell-walled counterparts. This growth and division does not occur in the same way as walled cells - L-forms have been described to undertake [http://www.ncbi.nlm.nih.gov/pmc/articles/PMC3603455/ membrane blebbing, tubulation and vesiculation].
As a result of their cell wall-deficiency L-forms are restricted by osmolarity much more then walled bacteria. L-forms require incubation for many generations in specific osmotically balanced conditions with enzymes and antibiotics that prevent invasion by walled contaminant cells. However, these specific osmotic demands of L-forms can also be seen as a kill-switch. Any bacteria that escape will no longer be in a maintained and osmotically balanced environment and will consequently not survive.
For conventional cell-walled bacterial strains to switch into wall-deficient L-form state the synthesis of the peptidoglycan cell wall must be disrupted. In B. subtilis this disruption can be achieved through controlling the expression of murE. The murE gene is responsible for the synthesis of a number of enzymes that are involved in the synthesis of a peptidoglycan precursor. When murE expression is down-regulated, this has a cascade effect leading to the down-regulation of peptidoglycan synthesis. It has been found that a mutation that spontaneously occurs in L-form B. subtilis cells is also necessary for the [http://www.ncbi.nlm.nih.gov/pubmed/19212404 survival of stable L-forms]. After selection for wall-deficient cells, survivors exhibit a mutation within the yqiD gene, which is similar to the Escherichia coli gene ispA. This mutation allows [http://www.ncbi.nlm.nih.gov/pubmed/23452849 for stabilisation of L-forms that are undergoing shape modulation due to excess of cell membrane].
The B. subtilis strain [http://www.ncbi.nlm.nih.gov/pubmed/23452849 LR2] - an L-form derivative of B. subtilis 168 created by the Errington research group at Newcastle University - contains a xylose-controlled promoter PxylR upstream of the murE gene on its chromosome. This allows for xylose-mediated control over murE expression. This strain also contains a chloramphenicol acetyl-transferase (cat) gene close to the locus of the PxylR promoter. This gene confers resistance to chloramphenicol and allows for selection for B. subtilis LR2 when in rod form. It is this region in the LR2 strain - containing the PxylR promoter and the cat gene - that has been utilised and altered to create the L-form switch BioBrick [http://parts.igem.org/Part:BBa_K1185000 BBa_K1185000].

Uses of L-forms in Synthetic Biology
The applications and research potential afforded to synthetic biology through employment of L-forms are numerous. All of these areas benefit from the removal of the cell wall from cells - as occurs when cells adopt the L-form state.
Easier export of cellular products
L-forms, characteristically, have no cell wall. With one of the main barriers which stands in the way of adding or removing things from cells gone, it is easier to add or remove things from cells. B. subtilis is a popularly used organism in biotechnology, in part because of its ability to export proteinaceous products. Bacteria in L-form state secrete more proteins than their cell-walled counterparts. This means that proteins that cannot usually be secreted due to the barrier of the cell wall can now be secreted and that proteins can be secreted at increased rates. These characteristics may make L-forms useful candidates for the industrial synthesis of cellular products.
Gene fusion, shuffling and directed evolution
Bacteria in L-form state are able to fuse together. When they do this, their genomes can recombine or “shuffle”. Some of the bacteria, which result from genome shuffling will show more useful characteristics than the original bacteria. By selecting improved bacteria and forcing them to recombine their genomes, even more useful bacteria can result. Repeated iterations of this is termed “directed evolution”.
Antibiotic advances
Cell wall-deficient L-forms also provide a great research candidate for antibiotic discovery and progression. It is suggested that bacteria are able to adopt L-form state to avoid threats to their cell wall. As many antibiotics target the cell wall, the adoption of L-form state provides bacteria resistance to many antibiotics. Research undertaken with L-forms can allow for greater in-depth understanding of the mechanisms through which antibiotic resistance can be achieved. Further knowledge in this area can only give antibiotic development a ‘leg-up’ in the arms race against antibiotic-resistant pathogens. Furthermore, through trialing against L-forms, novel antibiotics that work through non-cell wall-targeted means, may be discovered.
Helping plants
L-forms have been shown to form symbiotic relationships with some plants. L-forms help protect the plants from fungal infections and the plants provide a suitable environment for the L-forms to grow. If L-forms could be engineered to deliver useful substances to the plant then agriculture could really benefit.
Purpose
The purpose of this key area of our project was to create a BioBrick that enables the conversion of cell-walled B. subtilis cells into L-form cells that are cell wall deficient. L-forms should be able to be maintained in wall-less state once conversion from walled form is successful. The BioBrick should also facilitate the reversion back to walled cells when desired.
Our Objectives
- Design a BioBrick which places murE under the control of a controllable promoter.
- Have this designed BioBrick synthesised.
- Integrate the designed BioBrick into B.subtilis.
- Determine the functionality of the BioBrick in removing the cell wall.
Characterisation of Growth and Division
With the removal of the cell wall, growth and division undertaken by L-forms occurs differently than the same process in cell walled bacteria. L-forms have been described to undertake membrane blebbing, tubulation and vesiculation as forms of division. Proliferation of B. subtilis L-forms occurs [http://www.ncbi.nlm.nih.gov/pubmed/22122227 entirely independent of the FtsZ-ring] that is necessary for division in almost all walled bacteria. Because of this different process of growth and division, we investigated the rate of growth of populations of B. subtilis L-forms over a period of time. To achieve this the optical density of L-form cell cultures was taken, as a measure of population growth (higher optical density occurs with higher population size), and growth curve produced. Growth curves were also produced for B. subtilis BSB1 and 168 rod cells that maintained a cell wall for comparison.
Growth rate of L-forms
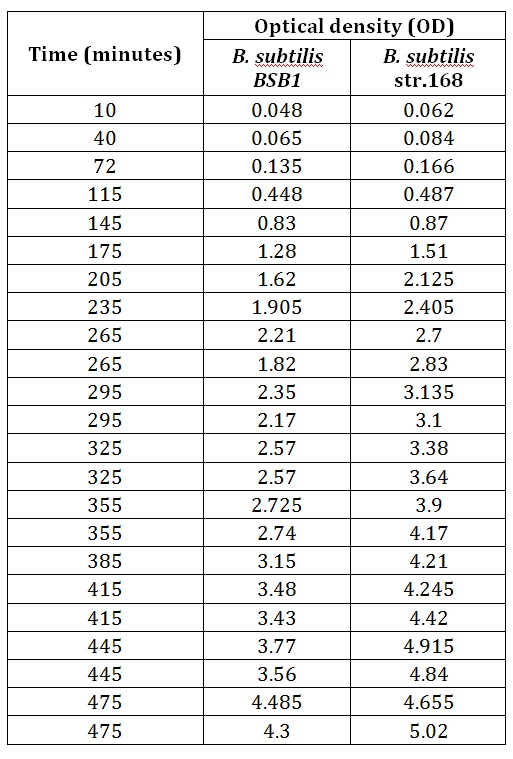
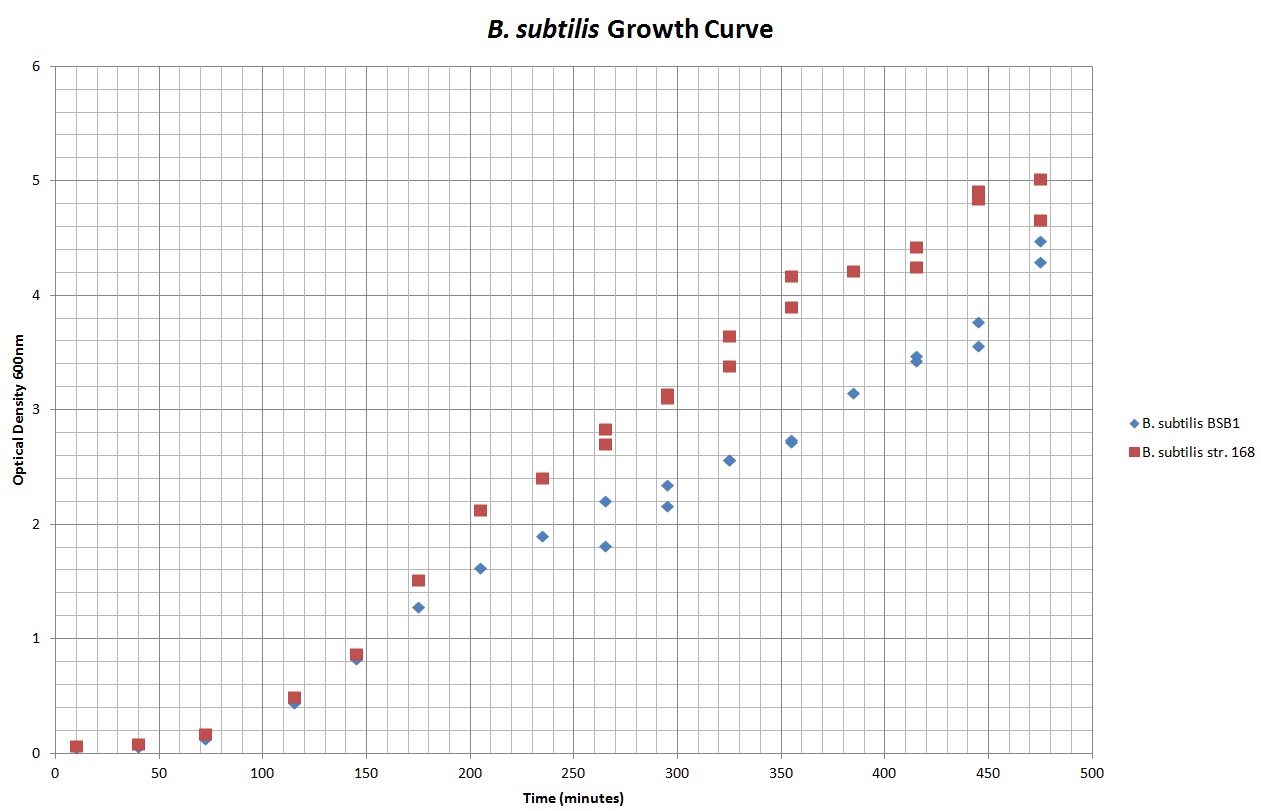
Table 1 summarises the change in optical density at 600nm absorbance (as a result of increasing number of cells) of a cell culture of B. subtilis str. BSB1 and 168. Figure 1 shows the growth curves plotted from this data. A slow increase in the optical density (and thus number of cells in the culture) of both cultures is noticeable in the early stages of observation. This corresponds to the expected lag phase of a growth curve. After roughly 100 minutes the growth rate increases, which can be seen as a steepening of the curve in Figure 1. The cell cultures are in their exponential phases of growth here. As both cultures approach 500 minutes of incubation, the growth rate no longer appears steady as the cell populations approach the stationary phase.
Table 1. This table shows the change in optical density at 600nm absorbance, with time, as B.subtilis str. BSB1 and 168, in their rod form, are left to grow at 30oC.
Figure 1. This graph shows the change in optical density at 600nm absorbance, with time, as B.subtilis str. BSB1 and 168, in their rod form, are left to grow at 30oC.
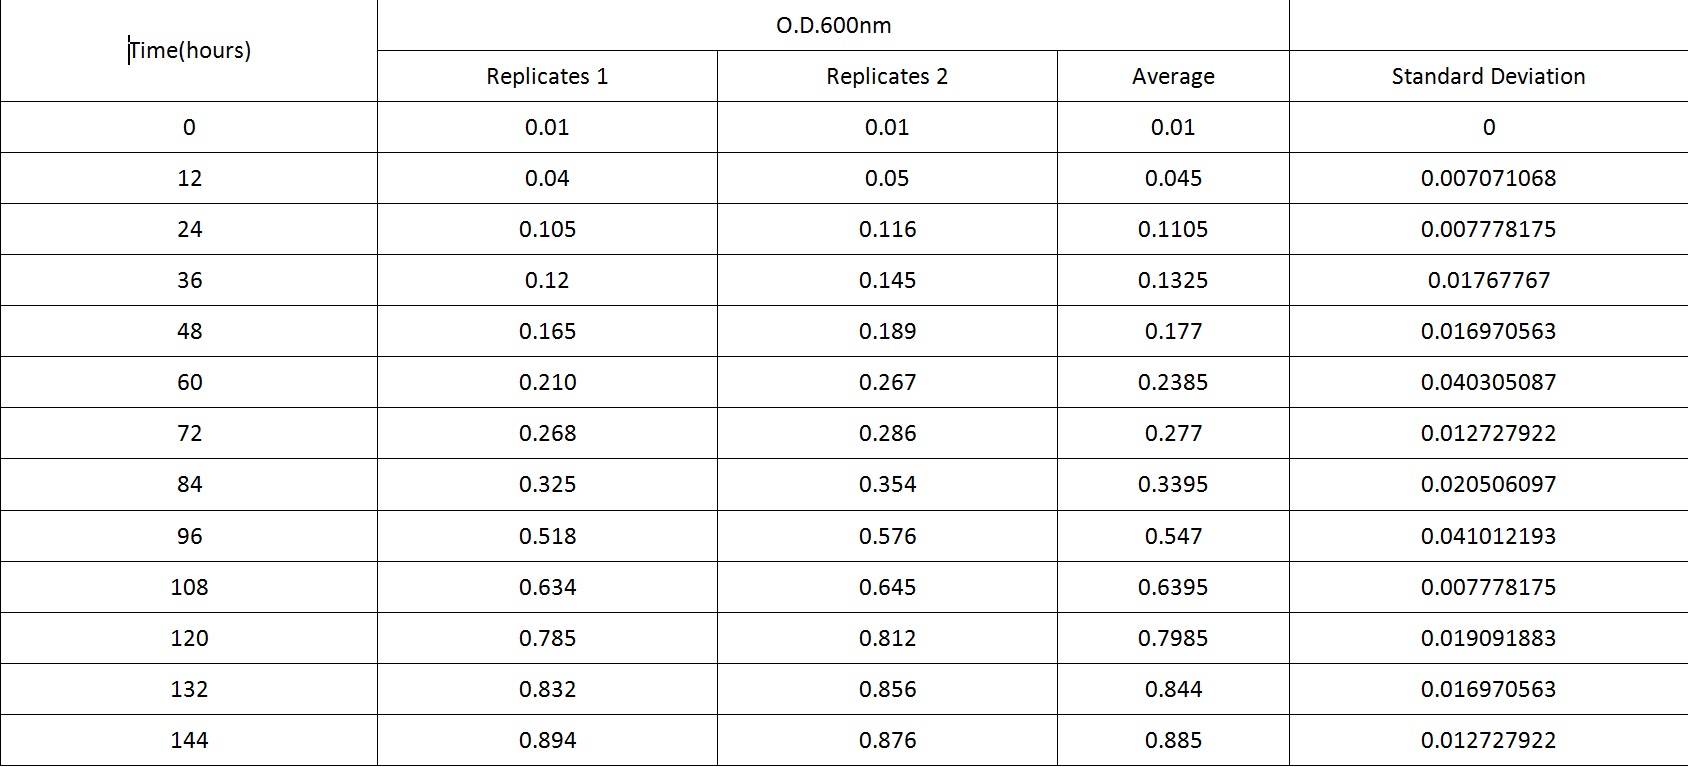
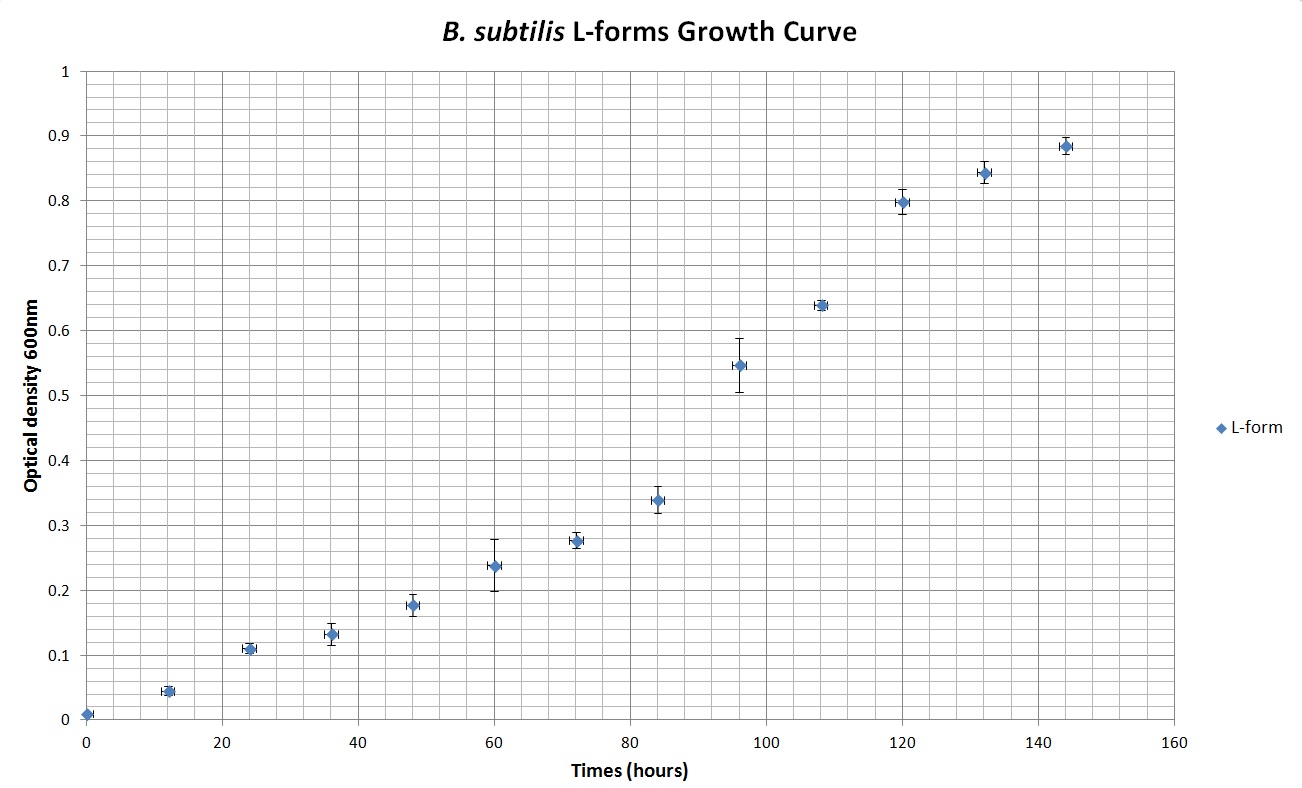
Table 2 summarises the change in optical density at 600nm absorbance (as a result of increasing number of cells) of cell cultures of B. subtilis L-forms. Figure 2 shows the growth curves plotted from this data. As with the cell culture of the walled B. subtilis an expected growth curve is produced - with lag, exponential and stationary phases visible on the curve in Figure 2. However, what is also noticeable is the great difference in time-frame. The optical density of B. subtilis rod cell cultures was measured over hundreds of minutes. These cultures approached stationary phase at around 500 minutes (just over 8 hours). The L-form cell cultures required incubation for around 140 hours before approaching stationary phase. Also noticeable is the much lower optical densities of the L-form cell culture than the rod cell culture throughout the observed time period. As the L-form bacteria have lost their cell wall they produce a relatively much lower optical density.
Table 2. This table shows the change in optical density at 600nm absorbance, with time, as L-forms of B.subtilis are left to grow at 30oC.
Figure 2. This graph shows the change in optical density at 600nm absorbance, with time, as L-forms of B.subtilis are left to grow at 30oC.
L-form division
The following videos and figures display the various methods through which L-forms actually divide. As mentioned above, as L-forms have lost their cell wall they divide independently of FtsZ-ring - a structure that most walled bacteria rely upon for division. Consequently, growth and division undertaken by L-forms occurs differently than the same process in cell walled bacteria.
Video 1 shows the simple increase in size of L-form cells over a period of time. This highlights the difference between L-forms and protoplasts (which neither grow or divide) and suggests the l-forms visible are taking up and metabolising materials. The L-form cells in this video are tagged with HBsu-GFP to make them more visible.
Video 1. Showing L-forms with HBsu-GFP tag growing in size from around <2um up to 6um, suggesting they actually take up and metabolise cellular materials.
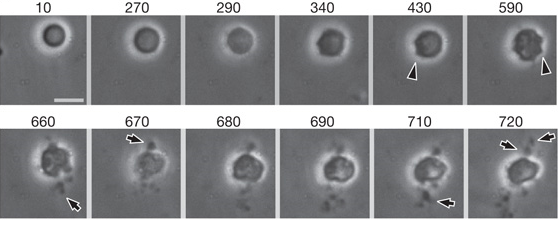
Video 2. Showing larger size L-forms (3.5um - 6um) dividing through forming transient bulges around the cell membrane, followed by a series of small bodies erupting from the membrane forming apparent progeny.
Figure 3. As shown in Video 2, this figure shows larger size L-forms (3.5um - 6um) dividing through forming transient bulges around the cell membrane, followed by a series of small bodies erupting from the membrane forming apparent progeny. This form of division is known as blebbing. Each window shows the cell at a different time-frame in incubation. Time is given in minutes. Scale bar 5um.
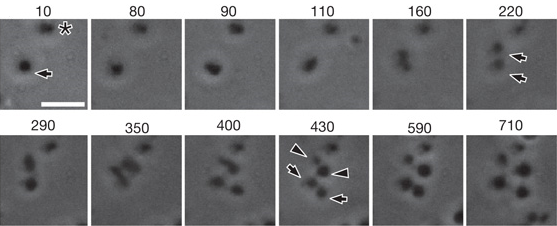
Video 3. Showing the common division mechanism that L-forms around 2um in diameter undergo. Initially a series of disruptions can be seen on the membranes, which is characterised as a blunt protrusion. This protrusion retracts and re-emerges before being resolved into multiple progeny.
Figure 4. As shown in Video 3 this figure shows the common division mechanism that L-forms around 2um in diameter undergo. Initially a series of disruptions can be seen on the membranes, which is characterised as a blunt protrusion. This protrusion retracts and re-emerges before being resolved into multiple progeny. This form of division is known as tubulation. Each window shows the cell at a different time-frame in incubation. Time is given in minutes. Scale bar 5um.
Video 4. An often-used method of division by L-forms <2um. They undergo a similar process as larger L-forms, the only difference is that they usually gave rise to progeny of equal sizes.
Figure 5. As shown in Video 4, this figure shows An often-used method of division by L-forms <2um. They undergo a similar process as larger L-forms, the only difference is that they usually gave rise to progeny of equal sizes. This form of division is known as vesiculation. Each window shows the cell at a different time-frame in incubation. Time is given in minutes. Scale bar 5um.
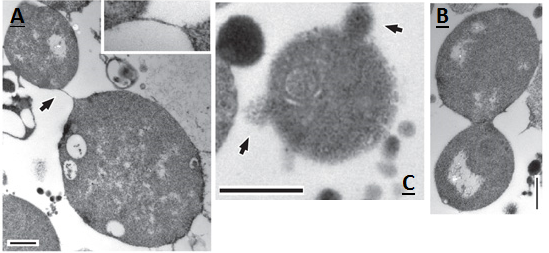
Figure 6. a-c, Transmission electron micrographs of dividing L-forms. a, showing two cells connected by a thin strand (arrow, and inset at 3times magnification). b, a cell at late stage of resolution. c, a cell with surface blebs and possible progeny (arrows). Scale bars, 500 nm.
Characterisation of Osmotic Instability
One way that L-forms differ from their cell walled counterparts is in their inability to survive in a wide range of osmotic pressures. This adds biosecurity that any L-forms that escape into the environment will not survive. This is one reason that genetically modified L-forms could be used in the agriculture industry as an alternative to other engineered bacteria. We conducted experiments to decipher what osmotic pressures are suitable for our B. subtilis L-forms. This included growing L-forms in 50/50 NB/MSM media with a variety of sucrose concentrations. A soil sample was also taken from outside the centre for bacterial cell biology, water was extracted. This was used to test the ability of L-forms to survive in soil water, in the event that they escape from a laboratory or a host plant.
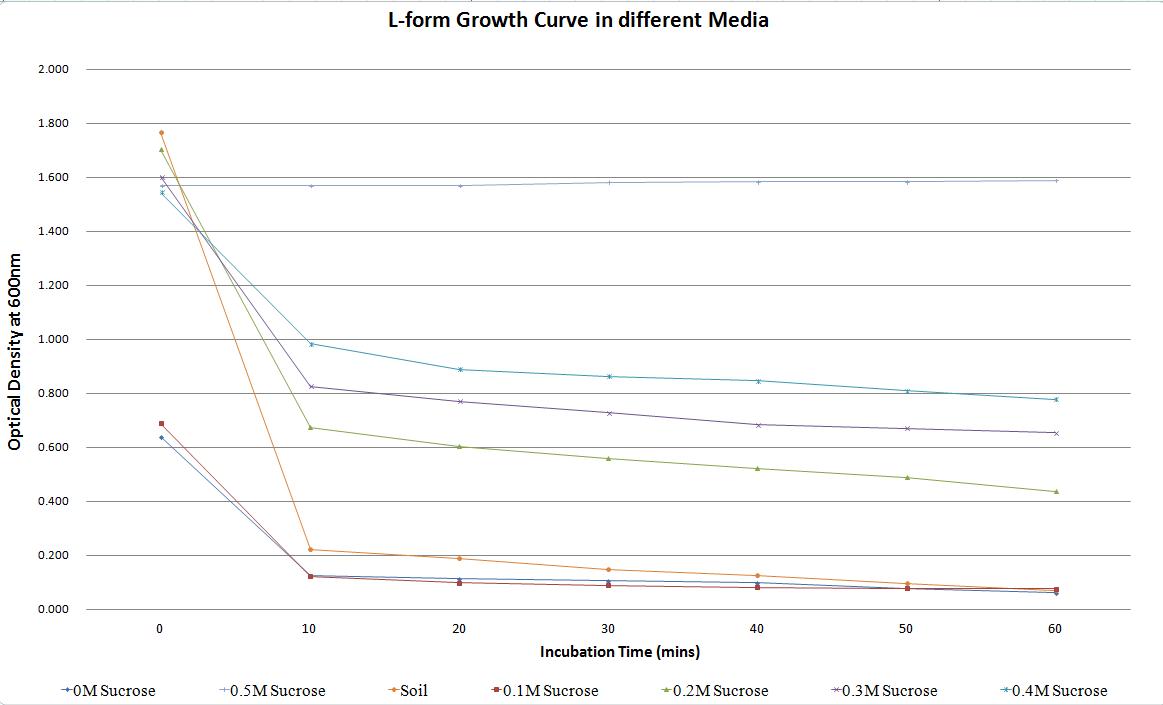
Table 1 summarises these changes in optical density. The rate of decrease in L-form growth(%)in one hour drops as the sucrose concentration increases. In media with 0M sucrose the rate of decrease is over 90%. This drops to less than 50% in media containing 0.4M sucrose. In soil water the rate of decrease is over 95% highlighting the unlikelyhood of L-forms surviving if they escaped the environment. The rate of decrease in the 0.5M sucrose media is -1.28 (2.d.p.) as rather than the L-forms bursting in large numbers, the L-forms are actually able to proliferate.
| Sucrose Concentration (M) | Time (mins) | O.D (600) | Rate of Decrease (%) |
|---|---|---|---|
| 0 | 0.640 | ||
| 10 | 0.126 | ||
| 20 | 0.114 | ||
| 0 (positive control) | 30 | 0.106 | 90.31 |
| 40 | 0.100 | ||
| 50 | 0.080 | ||
| 60 | 0.062 | ||
| 0 | 0.691 | ||
| 10 | 0.123 | ||
| 20 | 0.100 | ||
| 0.1 | 30 | 0.091 | 88.71 |
| 40 | 0.083 | ||
| 50 | 0.080 | ||
| 60 | 0.078 | ||
| 0 | 1.705 | ||
| 10 | 0.676 | ||
| 20 | 0.605 | ||
| 0.2 | 30 | 0.559 | 74.25 |
| 40 | 0.523 | ||
| 50 | 0.491 | ||
| 60 | 0.439 | ||
| 0 | 1.604 | ||
| 10 | 0.828 | ||
| 20 | 0.772 | ||
| 0.3 | 30 | 0.729 | 59.16 |
| 40 | 0.685 | ||
| 50 | 0.672 | ||
| 60 | 0.655 | ||
| 0 | 1.546 | ||
| 10 | 0.984 | ||
| 20 | 0.891 | ||
| 0.4 | 30 | 0.865 | 49.55 |
| 40 | 0.847 | ||
| 50 | 0.810 | ||
| 60 | 0.780 | ||
| 0 | 1.768 | ||
| 10 | 0.222 | ||
| 20 | 0.190 | ||
| Soil | 30 | 0.150 | 95.93 |
| 40 | 0.128 | ||
| 50 | 0.096 | ||
| 60 | 0.072 | ||
| 0 | 1.569 | ||
| 10 | 1.569 | ||
| 20 | 1.569 | ||
| 0.5 (negative control) | 30 | 1.583 | -1.28 |
| 40 | 1.584 | ||
| 50 | 1.584 | ||
| 60 | 1.589 |
Table 1. Change in the optical density of L-forms in media with different sucrose concentrations and also soil water, over time. This highlights how a change in osmotic pressure can affect the propensity of L-forms to survive.
The results are also summarized in Graph 1, which shows the number of cells plummeting in all the media except the one containing 0.5M sucrose. This highlights that L-forms require an environment with a high osmolarity to survive. The L-forms were also unable to survive in the soil water sample as expected. Figure 1 shows microscopy of samples taken from each of the cultures. Clear and intact L-forms are only visible in the sample taken from the culture grown in 0.5M sucrose media.
Graph 1. Change in the optical density of L-forms in media with different sucrose concentrations and also soil water, over time. This highlights how a change in osmotic pressure can affect the propensity of L-forms to survive.
 |
 |
 |
 |
 |
 |
 |
Figure 1. Microscopy of L-forms after being left in NB/MSM media with varying sucrose concentrations for 60 minutes. There is also an image of L-forms that have been left in NB/MSM media + soil water for 60 minutes. |
Video 1 shows fluorescing L-forms appearing to disappear. They are actually bursting due to the microfluidics chip they are contained in being flooded with soil water.
Video 1. Showing L-forms with HBsu-sfGFP and L-forms with HBsu-RFP tag inside microfluidics chamber dying in soil water.
References
[http://www.ncbi.nlm.nih.gov/pubmed/22122227 Domínguez-Cuevas P, Mercier R, Leaver M, Kawai Y, Errington J. (2012) The rod to L-form transition of Bacillus subtilis is limited by a requirement for the protoplast to escape from the cell wall sacculus. Molecular Microbiology, 83, 52-66.]
[http://www.ncbi.nlm.nih.gov/pmc/articles/PMC3603455/ Errington J. (2013) L-form bacteria, cell walls and the origins of life. Open Biology, 3, 120143.]
[http://www.ncbi.nlm.nih.gov/pubmed/19212404 Leaver M., Dominguez-CuevasP., Coxhead J.M., Daniel R.A. and Errington J. (2009) Life without a wall or division machine in Bacillus subtilis. Nature, 457, 849-853.]
[http://www.ncbi.nlm.nih.gov/pubmed/23452849 Mercier R., Kawai Y. and Errington J. (2013) Excess membrane synthesis drives a primitive mode of cell proliferation. Cell, 152, 997-1007.]
[http://www.ncbi.nlm.nih.gov/pubmed/11849491 Walker R., Ferguson CM., Booth NA and Allan EJ.(2002) The symbiosis of Bacillus subtilis L-forms with Chinese cabbage seedlings inhibits conidial germination of Botrytis cinerea. Letters in Applied Microbiology. 34, 42-45.]
 "
"
