Team:Dundee/Project/MathOverview
From 2013.igem.org
Kyleharrison (Talk | contribs) |
|||
| Line 45: | Line 45: | ||
<div class="span6" style="text-align:justify"> | <div class="span6" style="text-align:justify"> | ||
<h2 style="margin-top:-10px;"> PP1 Capacities </h2> | <h2 style="margin-top:-10px;"> PP1 Capacities </h2> | ||
| - | <p> The | + | <p> The PP1 capacities of <i>E. coli</i> and <i>B. subtilis</i> were investigated in order to determine which chassis could host the greatest number of PP1 molecules. This analysis indicated that <i>E. coli</i> has the capacitive potential to be a more efficient mop than <i>B. subtilis</i>. </p> |
</div> | </div> | ||
<div class="span6" style="text-align:justify"> | <div class="span6" style="text-align:justify"> | ||
<h2 style="margin-top:-10px;"> Production & Export</h2> | <h2 style="margin-top:-10px;"> Production & Export</h2> | ||
| - | <p> | + | <p>We developed a Production & Export model to help us predict the number of PP1 we could transport into the periplasm of our ToxiMop cells. The model allowed us to optimise the construction of our prototype ToxiMop.</p> |
| - | + | ||
</div> | </div> | ||
</div> | </div> | ||
| Line 72: | Line 71: | ||
<div class="span6" style="text-align:justify"> | <div class="span6" style="text-align:justify"> | ||
<h2 style="margin-top:-10px;"> Mop Simulation </h2> | <h2 style="margin-top:-10px;"> Mop Simulation </h2> | ||
| - | <p> | + | <p>Visualisation tools investigating the biological processes which take place in the ToxiMop bacteria allow a user to alter the key properties of the transport mechanisms and provide instant feedback on the results of such changes. |
| - | + | ||
</p> | </p> | ||
</div> | </div> | ||
| Line 79: | Line 77: | ||
<div class="span6" style="text-align:justify"> | <div class="span6" style="text-align:justify"> | ||
<h2 style="margin-top:-10px;"> Detection Comparison</h2> | <h2 style="margin-top:-10px;"> Detection Comparison</h2> | ||
| - | <p> | + | <p>With current detection methods, time delays between the sampling and obtaining of results induces an increase in the microcystin concentrations. Therefore, an effective biological detector must reduce the detection time. </p> |
| - | + | ||
</div> | </div> | ||
</div> | </div> | ||
Revision as of 13:02, 2 October 2013
Modelling Overview
If the presentation does not appear, refreshing the page will fix this. In compliance with the wiki freeze, Google Drive places an unalterable timestamp on the document. Access granted upon request as this requires a specific email address. Click here for access to the document click here
Presentation too small to read, Want it bigger? Simply click the button between the slide number and cog to make the presentation full screen.
PP1 Capacities
The PP1 capacities of E. coli and B. subtilis were investigated in order to determine which chassis could host the greatest number of PP1 molecules. This analysis indicated that E. coli has the capacitive potential to be a more efficient mop than B. subtilis.
Production & Export
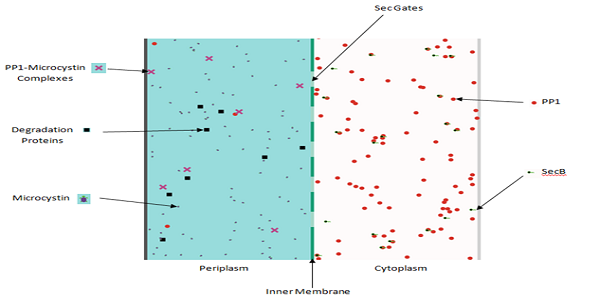
We developed a Production & Export model to help us predict the number of PP1 we could transport into the periplasm of our ToxiMop cells. The model allowed us to optimise the construction of our prototype ToxiMop.

Mop Simulation
Visualisation tools investigating the biological processes which take place in the ToxiMop bacteria allow a user to alter the key properties of the transport mechanisms and provide instant feedback on the results of such changes.
Detection Comparison
With current detection methods, time delays between the sampling and obtaining of results induces an increase in the microcystin concentrations. Therefore, an effective biological detector must reduce the detection time.

 "
"
