Team:Imperial College/Modelling PLAdeg
From 2013.igem.org
| Line 8: | Line 8: | ||
<p>1. With the defined kinetic properties of Proteinase K. The model can predict the time needed to degrade a certain amount of PLA. The information is important as it estimates the efficiency of the MAPLE system when degrading the large amount of plastic.Therefore, further improvements can be made if the system is not efficient.</p> | <p>1. With the defined kinetic properties of Proteinase K. The model can predict the time needed to degrade a certain amount of PLA. The information is important as it estimates the efficiency of the MAPLE system when degrading the large amount of plastic.Therefore, further improvements can be made if the system is not efficient.</p> | ||
<p>2. The model also involves the gene expression model of the Proteinase K with an inducible promoter. Therefore, gene expression can be regulated by adjusting the inducer concentration. The overall plastic degradation can be regulated by the gene expression. </p> | <p>2. The model also involves the gene expression model of the Proteinase K with an inducible promoter. Therefore, gene expression can be regulated by adjusting the inducer concentration. The overall plastic degradation can be regulated by the gene expression. </p> | ||
| - | <p>3. The secretion model is also contained in the model which assumes the efficiency of enzyme secretion to the culture. | + | <p>3. The secretion model is also contained in the model which assumes the efficiency of enzyme secretion to the culture. </p> |
| - | <h2> | + | <h2>Specifications of the model</h2> |
<p align="justify">Polylactic acid (PLA) degradation involves proteinase K:</p> | <p align="justify">Polylactic acid (PLA) degradation involves proteinase K:</p> | ||
<table border="2" bgcolor="#efefef"> | <table border="2" bgcolor="#efefef"> | ||
| Line 25: | Line 25: | ||
</tr> | </tr> | ||
</table> | </table> | ||
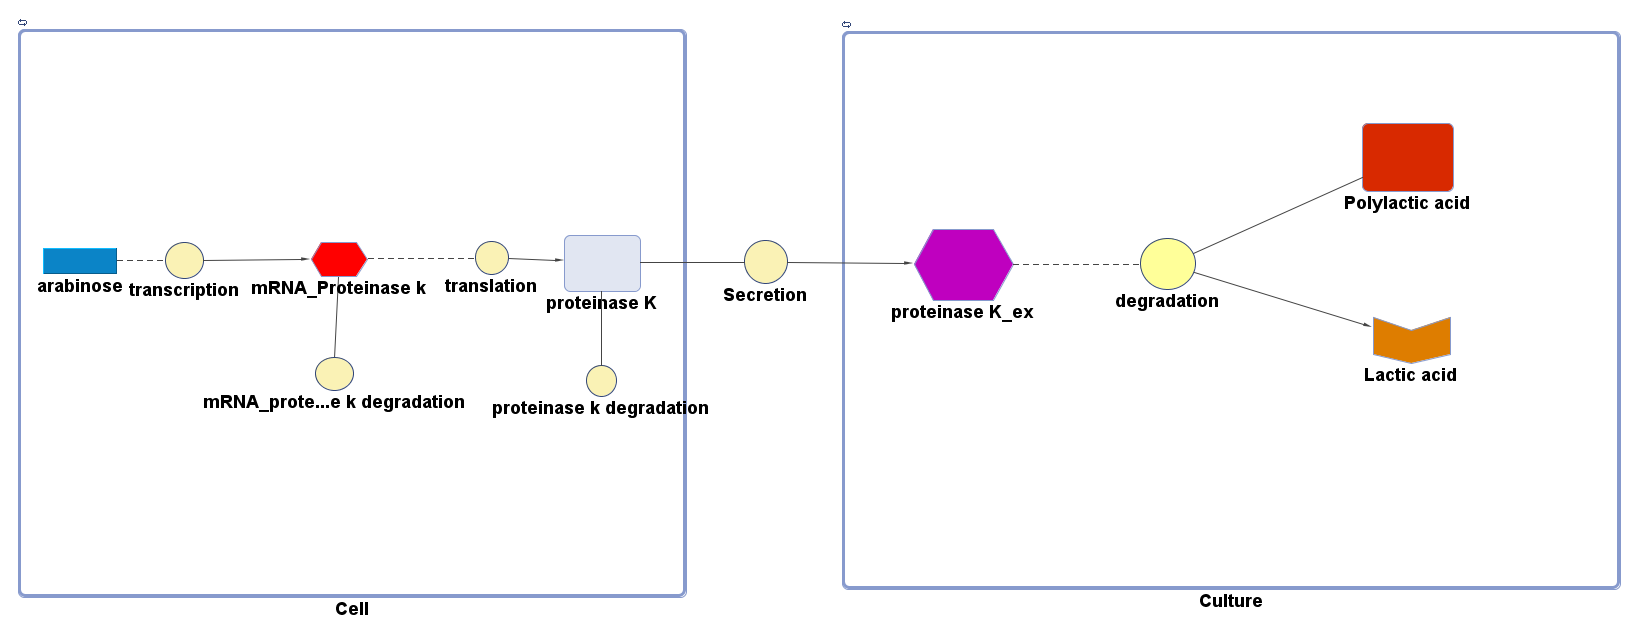
| + | <p>The overall PLA degradation model is shown as below:</p> | ||
| + | [[File:PKPLA.png]] | ||
| + | <p>There are two compartments which represents cells and the culture from left to right. The "cell" compartment contains the gene expression module whereas the "culture" compartment contains the degradation module. The "secretion" block that connects two compartments is the secretion module.</p> | ||
| + | <h3>Parameters and assumptions </h3> | ||
| + | <h4>Gene expression module of PudA</h4> | ||
| + | <table border="2" bgcolor="#efefef"> | ||
| + | <tr> | ||
| + | <th>Parameter</th> | ||
| + | <th>Description</th> | ||
| + | <th>Value</th> | ||
| + | <th>Units</th> | ||
| + | <th>Sources</th> | ||
| + | <th>Assumptions</th> | ||
| + | </tr> | ||
| + | <tr> | ||
| + | <th>β</th> | ||
| + | <td>maximum rate of transcription</td> | ||
| + | <td>0.032</td> | ||
| + | <td>mM/min</td> | ||
| + | <td>Please see derivation 1 below.</td> | ||
| + | <td>Please see derivation 1 below.</td> | ||
| + | </tr> | ||
| + | |||
| + | <tr> | ||
| + | <th>K</th> | ||
| + | <td>Activation coefficient</td> | ||
| + | <td>0.0031</td> | ||
| + | <td>mM</td> | ||
| + | <td>[http://parts.igem.org/Part:BBa_K206000:Characterization]</td> | ||
| + | <td>Taking the "switch point" as the activation coefficient</td> | ||
| + | </tr> | ||
| + | <tr> | ||
| + | <th>d<sub>mRNA</sub></th> | ||
| + | <td>mRNA degradation rate</td> | ||
| + | <td>0.10</td> | ||
| + | <td>1/min</td> | ||
| + | <td>[http://www.ncbi.nlm.nih.gov/pmc/articles/PMC420366/pdf/07X.pdf]</td> | ||
| + | <td>Taking the value of mRNA half-life in E.coli strain MG1655 as 6.8min. rate = ln2/half-life = ln2/6.8 = 0.10</td> | ||
| + | </tr> | ||
| + | <tr> | ||
| + | <th>d<sub>protein</sub></th> | ||
| + | <td>Protein degradation rate</td> | ||
| + | <td>0.050</td> | ||
| + | <td>1/min</td> | ||
| + | <td>[http://jb.asm.org/content/189/23/8746.full]</td> | ||
| + | <td>There is no active degradation pathway and that dilution is the dominant way by which the protein level decreases in a cell. Rate = 1/doubling time, where doubling time = 20min. Assuming steady-state growth in LB broth as presented in paper.</td> | ||
| + | </tr> | ||
| + | <tr> | ||
| + | <th>k<sub>2</sub></th> | ||
| + | <td>Protein production rate (Proteinase K)</td> | ||
| + | <td>4.7</td> | ||
| + | <td>1/min</td> | ||
| + | <td>Please see derivation 2 below.</td> | ||
| + | <td>Please see derivation 2 below.</td> | ||
| + | </tr> | ||
| + | |||
| + | <tr> | ||
| + | <th>[Arabinose]</th> | ||
| + | <td>Concentration of arabinose</td> | ||
| + | <td>Initial: 0.008</td> | ||
| + | <td>mM</td> | ||
| + | <td></td> | ||
| + | <td></td> | ||
| + | </tr> | ||
| + | <tr> | ||
| + | <th>[mRNA]</th> | ||
| + | <td>Concentration of mRNA</td> | ||
| + | <td>-</td> | ||
| + | <td>mM</td> | ||
| + | <td>-</td> | ||
| + | <td>-</td> | ||
| + | </tr> | ||
| + | <tr> | ||
| + | <th>[Proteinase K]</th> | ||
| + | <td>Concentration of Proteinase K</td> | ||
| + | <td>-</td> | ||
| + | <td>mM</td> | ||
| + | <td>-</td> | ||
| + | <td>-</td> | ||
| + | </tr> | ||
| + | |||
| + | |||
| + | </table> | ||
| + | <p>'''1.Derivation of the maximal expression rate,β''' | ||
| + | *Average molecular weight (Mw) of a base pair = 660g/mol[http://www.geneinfinity.org/sp/sp_dnaprop.html][http://www.lifetechnologies.com/uk/en/home/references/ambion-tech-support/rna-tools-and-calculators/dna-and-rna-molecular-weights-and-conversions.html] | ||
| + | *Average mass of a base pair = 660g/mol x 1.66x10<sup>-24</sup> = 1.1x10<sup>-21</sup>g | ||
| + | *Volume of an E.coli cell = 1µm<sup>3</sup>[http://kirschner.med.harvard.edu/files/bionumbers/fundamentalBioNumbersHandout.pdf] = 1x10<sup>-15</sup>L | ||
| + | **∴Mass concentration = [[File:Imperial College Mass conc cal beta.JPG|200px]] | ||
| + | **∴Molar concentration of 1 base pair in the volume of E.coli = [[File:Imperial College Molar conc cal beta.JPG|300px]] = 1.66x10<sup>-6</sup> mM | ||
| + | *BioBrick assembly plasmid pSB1C3 is a high copy number plasmid (100-300 copies per cell)[http://parts.igem.org/Part:pSB1C3?title=Part:pSB1C3] | ||
| + | **assume 200 copies per cell | ||
| + | *∴ concentration of the gene per cell = N x 200 x 1.66x10<sup>-6</sup>mM, where N = number of base pairs | ||
| + | **∴ concentration of the gene BDH2 (N = 768) in the volume of an E.coli cell is = 0.25mM | ||
| + | *Transcription rate in E.coli = 80bp/s[http://kirschner.med.harvard.edu/files/bionumbers/fundamentalBioNumbersHandout.pdf] = 80 x 1.66x10<sup>-6</sup>mM/s = 80 x 1.66x10<sup>-6</sup> x 60mM/min = 7.97x10<sup>-3</sup>mM/min | ||
| + | *∴ Rate of mRNA_Proteinase K production under the control of pBAD = 7.97x10<sup>-3</sup> ÷ 0.25 = '''0.032/min''' | ||
| + | '''2.Protein production rate of Proteinase K, k<sub>2</sub>''' | ||
| + | *Average molecular weight(Mw) of an amino acid(aa)= 110g/mol[http://www.genscript.com/conversion.html][http://www.promega.com/~/media/Files/Resources/Technical%20References/Amino%20Acid%20Abbreviations%20and%20Molecular%20Weights.pdf] | ||
| + | *Average mass of an amino acid = 110g/mol x 1.66x10<sup>-24</sup>=1.83x10<sup>-22</sup>g/L | ||
| + | **∴Mass concentration of one aa in the volume of an E.coli = [[File:Imperial College Mass conc cal beta aa.JPG|130px]] = 1.83x10<sup>-6</sup>g/L | ||
| + | **∴Molar concentration of one aa = [[File:Imperial College Molar conc cal aa.JPG|150px]] = 1.66x10<sup>-5</sup>mM | ||
| + | *Translation rate = 20aa/s = (20 x 1.66x10<sup>-5</sup> x 60)mM/min = 0.020mM/min | ||
| + | *BDH2 comprises of 256aa[http://www.uniprot.org/uniprot/Q2PEN2&format=html] | ||
| + | **∴concentration of BDH2's aa in the volume of an E.coli = 1.66x10<sup>-5</sup>mM x 256 = 4.25x10<sup>-3</sup>mM | ||
| + | *∴ Rate of protein production = 0.020 ÷ 4.25x10<sup>-3</sup> = '''4.7/min''' | ||
| + | </p> | ||
{{:Team:Imperial_College/Templates:footer}} | {{:Team:Imperial_College/Templates:footer}} | ||
Revision as of 00:35, 3 October 2013
Contents |
Polylactic acid (PLA) Degradation Module
Introduction
The efficiency of Polylactic acid is important for the performance of MAPLE. Therefore, we chose a strong enzyme Proteinase K which is suggested by many literature as an efficient PLA degrading enzyme. We performed several assays in order to determine the kinetic properties of Proteinase K. The PLA degradation model was then built based on the experimental results.
Objective and Design
1. With the defined kinetic properties of Proteinase K. The model can predict the time needed to degrade a certain amount of PLA. The information is important as it estimates the efficiency of the MAPLE system when degrading the large amount of plastic.Therefore, further improvements can be made if the system is not efficient.
2. The model also involves the gene expression model of the Proteinase K with an inducible promoter. Therefore, gene expression can be regulated by adjusting the inducer concentration. The overall plastic degradation can be regulated by the gene expression.
3. The secretion model is also contained in the model which assumes the efficiency of enzyme secretion to the culture.
Specifications of the model
Polylactic acid (PLA) degradation involves proteinase K:
| enzyme | source organism | biobrick | reference |
|---|---|---|---|
| Proteinase K | Engyodontium album | [http://parts.igem.org/Part:BBa_K1149002 BBa_K1149002] | [http://www.ncbi.nlm.nih.gov/nuccore/X14689.1] |
The overall PLA degradation model is shown as below:
There are two compartments which represents cells and the culture from left to right. The "cell" compartment contains the gene expression module whereas the "culture" compartment contains the degradation module. The "secretion" block that connects two compartments is the secretion module.
Parameters and assumptions
Gene expression module of PudA
| Parameter | Description | Value | Units | Sources | Assumptions |
|---|---|---|---|---|---|
| β | maximum rate of transcription | 0.032 | mM/min | Please see derivation 1 below. | Please see derivation 1 below. |
| K | Activation coefficient | 0.0031 | mM | [http://parts.igem.org/Part:BBa_K206000:Characterization] | Taking the "switch point" as the activation coefficient |
| dmRNA | mRNA degradation rate | 0.10 | 1/min | [http://www.ncbi.nlm.nih.gov/pmc/articles/PMC420366/pdf/07X.pdf] | Taking the value of mRNA half-life in E.coli strain MG1655 as 6.8min. rate = ln2/half-life = ln2/6.8 = 0.10 |
| dprotein | Protein degradation rate | 0.050 | 1/min | [http://jb.asm.org/content/189/23/8746.full] | There is no active degradation pathway and that dilution is the dominant way by which the protein level decreases in a cell. Rate = 1/doubling time, where doubling time = 20min. Assuming steady-state growth in LB broth as presented in paper. |
| k2 | Protein production rate (Proteinase K) | 4.7 | 1/min | Please see derivation 2 below. | Please see derivation 2 below. |
| [Arabinose] | Concentration of arabinose | Initial: 0.008 | mM | ||
| [mRNA] | Concentration of mRNA | - | mM | - | - |
| [Proteinase K] | Concentration of Proteinase K | - | mM | - | - |
1.Derivation of the maximal expression rate,β
- Average molecular weight (Mw) of a base pair = 660g/mol[http://www.geneinfinity.org/sp/sp_dnaprop.html][http://www.lifetechnologies.com/uk/en/home/references/ambion-tech-support/rna-tools-and-calculators/dna-and-rna-molecular-weights-and-conversions.html]
- Average mass of a base pair = 660g/mol x 1.66x10-24 = 1.1x10⁻²¹g
- Volume of an E.coli cell = 1µm3[http://kirschner.med.harvard.edu/files/bionumbers/fundamentalBioNumbersHandout.pdf] = 1x10-15L
- BioBrick assembly plasmid pSB1C3 is a high copy number plasmid (100-300 copies per cell)[http://parts.igem.org/Part:pSB1C3?title=Part:pSB1C3]
- assume 200 copies per cell
- ∴ concentration of the gene per cell = N x 200 x 1.66x10-6mM, where N = number of base pairs
- ∴ concentration of the gene BDH2 (N = 768) in the volume of an E.coli cell is = 0.25mM
- Transcription rate in E.coli = 80bp/s[http://kirschner.med.harvard.edu/files/bionumbers/fundamentalBioNumbersHandout.pdf] = 80 x 1.66x10-6mM/s = 80 x 1.66x10-6 x 60mM/min = 7.97x10⁻³mM/min
- ∴ Rate of mRNA_Proteinase K production under the control of pBAD = 7.97x10⁻³ ÷ 0.25 = 0.032/min
- Average molecular weight(Mw) of an amino acid(aa)= 110g/mol[http://www.genscript.com/conversion.html][http://www.promega.com/~/media/Files/Resources/Technical%20References/Amino%20Acid%20Abbreviations%20and%20Molecular%20Weights.pdf]
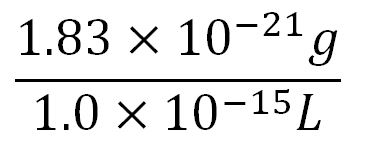
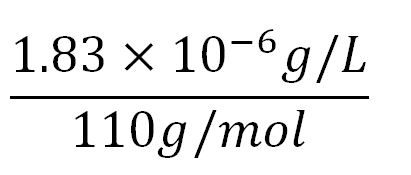
- Average mass of an amino acid = 110g/mol x 1.66x10-24=1.83x10⁻²²g/L
- Translation rate = 20aa/s = (20 x 1.66x10-5 x 60)mM/min = 0.020mM/min
- BDH2 comprises of 256aa[http://www.uniprot.org/uniprot/Q2PEN2&format=html]
- ∴concentration of BDH2's aa in the volume of an E.coli = 1.66x10-5mM x 256 = 4.25x10⁻³mM
- ∴ Rate of protein production = 0.020 ÷ 4.25x10-3 = 4.7/min
 "
"


