Team:SCU China/SCU-Results
From 2013.igem.org
(Difference between revisions)
Zhangbingbio (Talk | contribs) |
Zhangbingbio (Talk | contribs) |
||
| (14 intermediate revisions not shown) | |||
| Line 25: | Line 25: | ||
| - | {| style="text-align:justify; text-justify:inter-ideograph; width: 800px" border= | + | {| style="text-align:justify; text-justify:inter-ideograph; width: 800px" border=“0” cellspacing="1" cellpadding="20" align="center" |
|- | |- | ||
| Line 33: | Line 33: | ||
| | ||
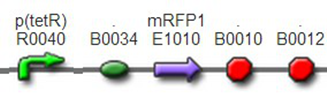
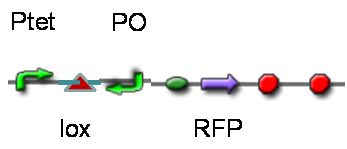
| - | We | + | We assembled BBa_K1087004 with mRFP to create [http://parts.igem.org/wiki/index.php?title=Part:BBa_K1087015 BBa_K1087015], band we assembled [http://parts.igem.org/wiki/index.php?title=Part:BBa_K1087015 BBa_K1087015] with RiboKey BBa_K145215 to create [http://parts.igem.org/wiki/index.php?title=Part:BBa_K1087021 BBa_K1087021]. |
[http://parts.igem.org/wiki/index.php?title=Part:BBa_K1087015 BBa_K1087015] [[File:SCU-r1.png]] | [http://parts.igem.org/wiki/index.php?title=Part:BBa_K1087015 BBa_K1087015] [[File:SCU-r1.png]] | ||
| Line 47: | Line 47: | ||
| | ||
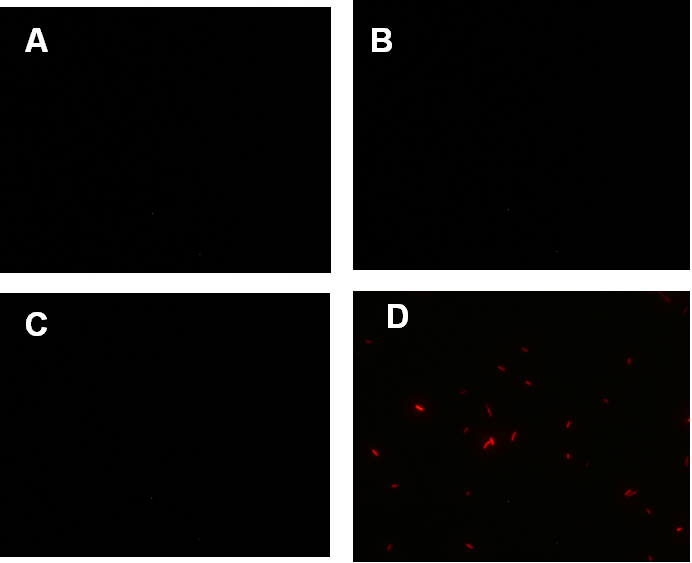
| - | We transformed [http://parts.igem.org/wiki/index.php?title=Part:BBa_K1087015 BBa_K1087015] and [http://parts.igem.org/wiki/index.php?title=Part:BBa_K1087021 BBa_K1087021] into ''E. coli'' DH5, respectively. And we used Ptet+mRFP1 (BBa_I13521) as positive control, | + | We transformed [http://parts.igem.org/wiki/index.php?title=Part:BBa_K1087015 BBa_K1087015] and [http://parts.igem.org/wiki/index.php?title=Part:BBa_K1087021 BBa_K1087021] into ''E. coli'' DH5, respectively. And we used Ptet+mRFP1 (BBa_I13521) as positive control, irrelevant BBa_J61046 with no fluorescence gene as negative control. |
| | ||
| Line 57: | Line 57: | ||
| | ||
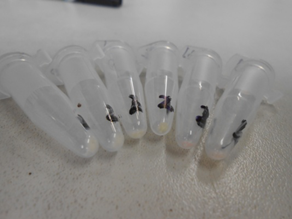
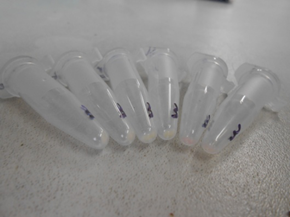
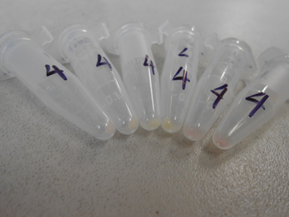
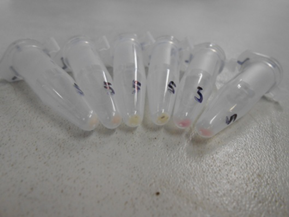
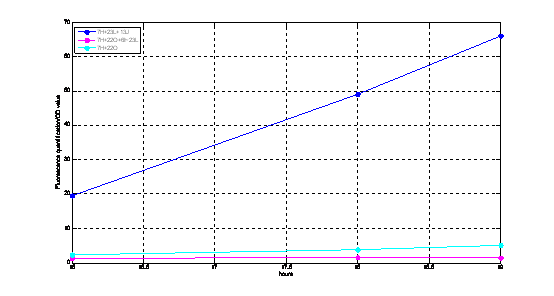
| - | We used fluorescence microscope to observe the | + | We used fluorescence microscope to observe the fluorescence at 16h, and we also used Thermo Varioskan Flash to quantitatively measure the fluorescence intensity at 16h, 18h, and 19h, respectively. 150ul culture fluid was added into each well of the 96-well black plate to measure the fluorescence intensity, and OD600 were measured using spectrophotometer at the same time one by one to quantify the concentration of bacteria. |
| - | + | ||
| - | + | ||
| + | Each sample had three duplicates when cultured. And the fluorescence value was handled through mathematical method. | ||
The fluorescence intensity of above transformants was divided by the OD600 value and minus that of negative control. | The fluorescence intensity of above transformants was divided by the OD600 value and minus that of negative control. | ||
| Line 67: | Line 66: | ||
| - | {| border= | + | {| border=1px; cellspacing="0" cellpadding="0" |
|- | |- | ||
| style="width: 84px" | | | style="width: 84px" | | ||
| Line 161: | Line 160: | ||
| | ||
| - | [[File:SCU- | + | [[File:SCU-rr1.png]] |
| - | [[File: | + | [[File:SCU-rr_(2).png]] |
| - | [[File:SCU- | + | [[File:SCU-rr_(3).png]] |
| | ||
| - | [[File:SCU- | + | [[File:SCU-rr_(4).png]] |
| - | [[File:SCU- | + | [[File:SCU-rr_(5).png]] |
| - | [[File:SCU- | + | [[File:SCU-rr_(6).png]] |
[[File:SCU-r4.png]] | [[File:SCU-r4.png]] | ||
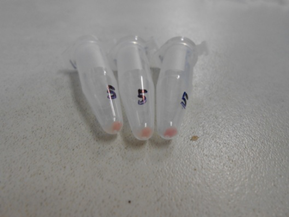
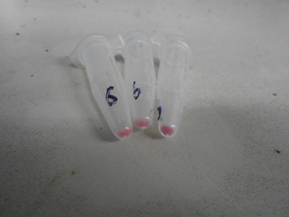
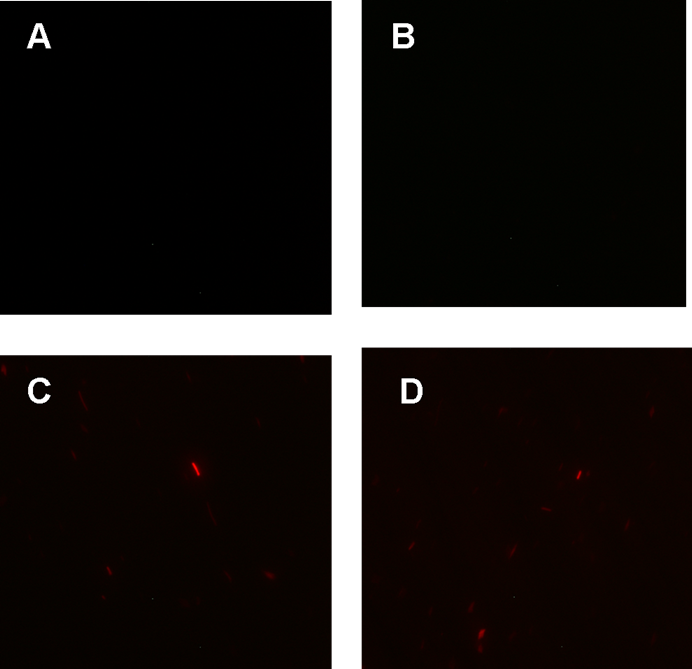
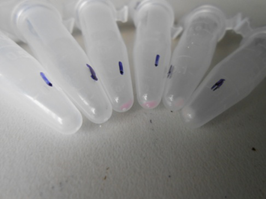
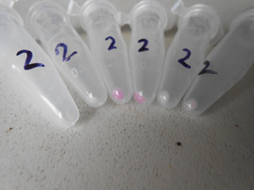
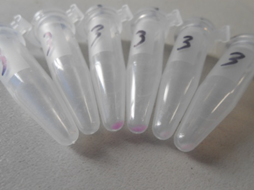
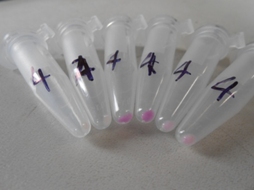
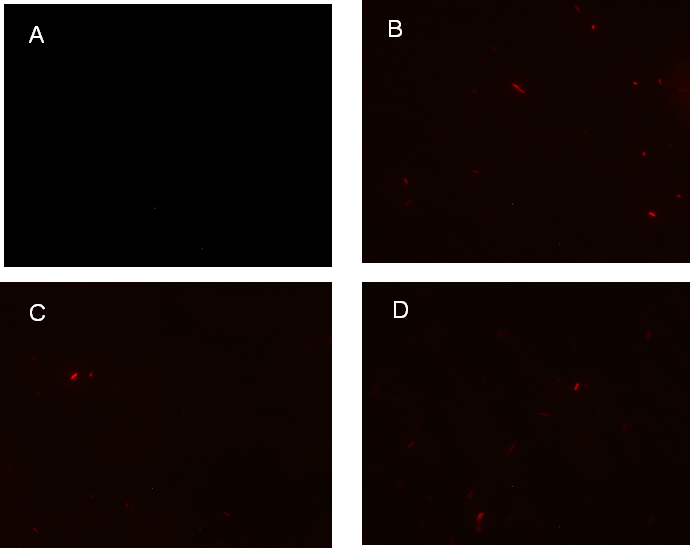
| - | Figure 1. | + | Figure 1. fluorescence observation using fluorescence microscope. |
A. Negative control: Coletit DH5αtransformed with B Ba_J61046 in PSB1X3. | A. Negative control: Coletit DH5αtransformed with B Ba_J61046 in PSB1X3. | ||
| Line 192: | Line 191: | ||
[[File:SCU-r5.png]] | [[File:SCU-r5.png]] | ||
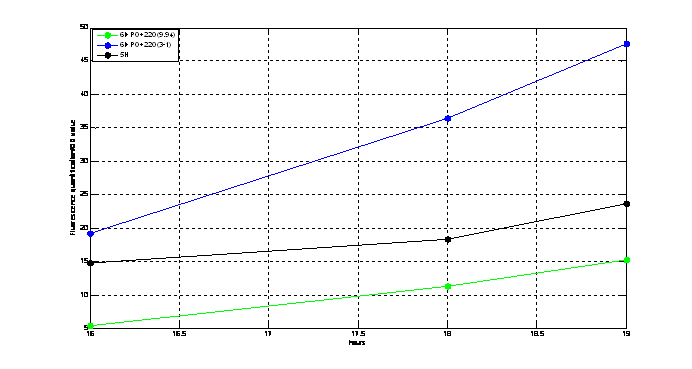
| - | Figure2. quantitatively measurement of the | + | Figure2. quantitatively measurement of the fluorescence intensity. |
Red: Coletit DH5αtransformed with [http://parts.igem.org/wiki/index.php?title=Part:BBa_K1087015 BBa_K1087015]. | Red: Coletit DH5αtransformed with [http://parts.igem.org/wiki/index.php?title=Part:BBa_K1087015 BBa_K1087015]. | ||
| Line 213: | Line 212: | ||
| - | {| border= | + | {| border=1px; cellspacing="0" cellpadding="0" |
|- | |- | ||
| style="width: 72px; height: 54px" | | | style="width: 72px; height: 54px" | | ||
| Line 343: | Line 342: | ||
[http://parts.igem.org/wiki/index.php?title=Part:BBa_K1087022 BBa_K108702]3 [[File:SCU-r8.png]] | [http://parts.igem.org/wiki/index.php?title=Part:BBa_K1087022 BBa_K108702]3 [[File:SCU-r8.png]] | ||
| - | We transformed [http://parts.igem.org/wiki/index.php?title=Part:BBa_K1087018 BBa_K1087018], [http://parts.igem.org/wiki/index.php?title=Part:BBa_K1087022 BBa_K1087022], and [http://parts.igem.org/wiki/index.php?title=Part:BBa_K1087022 BBa_K108702]3 into ''E. coli'' DH5α, respectively. And we used | + | We transformed [http://parts.igem.org/wiki/index.php?title=Part:BBa_K1087018 BBa_K1087018], [http://parts.igem.org/wiki/index.php?title=Part:BBa_K1087022 BBa_K1087022], and [http://parts.igem.org/wiki/index.php?title=Part:BBa_K1087022 BBa_K108702]3 into ''E. coli'' DH5α, respectively. And we used irrelevant BBa _J61046 with no fluorescence gene as negative control. The transformed cells were cultured separately in the same condition and measured fluorescence intensity at same time. |
| | ||
| Line 355: | Line 354: | ||
| - | {| border= | + | {| border=1px; cellspacing="0" cellpadding="0" |
|- | |- | ||
| style="width: 121px" | | | style="width: 121px" | | ||
| Line 515: | Line 514: | ||
| | ||
| - | |||
| - | + | | |
| - | |||
| - | |||
| - | | + | [[File:SCU-rr_(11).png]] |
| + | |||
| + | [[File:SCU-rr_(12).png]] | ||
| + | |||
| + | [[File:SCU-rr_(13).png]] | ||
| + | |||
| + | [[File:SCU-rr_(14).png]] | ||
| - | [[File:SCU- | + | [[File:SCU-rr_(15).png]] |
| - | [[File:SCU- | + | [[File:SCU-rr_(16).png]] |
| | ||
| Line 533: | Line 535: | ||
[[File:SCU-r9.png]] | [[File:SCU-r9.png]] | ||
| - | Figure 1. Figure 1. | + | Figure 1. Figure 1. fluorescence observation using fluorescence microscope. |
A. Negative control: Ecoli DH5αtransformed with BBa_J61046 in PSB1X3. | A. Negative control: Ecoli DH5αtransformed with BBa_J61046 in PSB1X3. | ||
| Line 547: | Line 549: | ||
[[File:SCU-r10.png]] | [[File:SCU-r10.png]] | ||
| - | Figure2. Quantitatively measurement of the | + | Figure2. Quantitatively measurement of the fluorescence intensity. |
Blue: ''E. coli'' DH5αtransformed with [http://parts.igem.org/wiki/index.php?title=Part:BBa_K1087015 BBa_K10870]23. | Blue: ''E. coli'' DH5αtransformed with [http://parts.igem.org/wiki/index.php?title=Part:BBa_K1087015 BBa_K10870]23. | ||
| Line 564: | Line 566: | ||
| - | {| border= | + | {| border=1px; cellspacing="0" cellpadding="0" |
|- | |- | ||
| style="width: 72px; height: 54px" | | | style="width: 72px; height: 54px" | | ||
| Line 687: | Line 689: | ||
[[File:SCU-r11.png]] | [[File:SCU-r11.png]] | ||
| - | Normally, we picked two colonies from the agar plate for [http://parts.igem.org/wiki/index.php?title=Part:BBa_K1087018 BBa_K108701]6, called A and B. We transformed [http://parts.igem.org/wiki/index.php?title=Part:BBa_K1087018 BBa_K108701]6A and B into ''E. coli'' DH5, respectively. And we use Ptet+mRFP1(BBa_I13521) as positive control, | + | Normally, we picked two colonies from the agar plate for [http://parts.igem.org/wiki/index.php?title=Part:BBa_K1087018 BBa_K108701]6, called A and B. We transformed [http://parts.igem.org/wiki/index.php?title=Part:BBa_K1087018 BBa_K108701]6A and B into ''E. coli'' DH5, respectively. And we use Ptet+mRFP1(BBa_I13521) as positive control, irrelevant BBa_J61046 with no fluorescence gene as negative control. The transformed cells were cultured separately in the same condition and measured fluorescence intensity at same time. |
| | ||
| Line 705: | Line 707: | ||
| - | {| border= | + | {| border=1px; cellspacing="0" cellpadding="0" |
|- | |- | ||
| style="width: 98px" | | | style="width: 98px" | | ||
| Line 788: | Line 790: | ||
| | ||
| + | [[File:SCU-rr_(7).png]] | ||
| - | [[File:SCU- | + | [[File:SCU-rr_(8).png]] |
| - | [[File:SCU- | + | [[File:SCU-rr_(9).png]] |
| - | [[File:SCU- | + | [[File:SCU-rr_(10).png]] |
| - | + | ||
| - | + | ||
| | ||
| Line 809: | Line 810: | ||
[[File:SCU-r12.png]] | [[File:SCU-r12.png]] | ||
| - | Figure1. | + | Figure1. fluorescence observation using fluorescence microscope. |
A. Negative control: ''E. coli'' DH5αtransformed with BBa_J61046 in PSB1X3. | A. Negative control: ''E. coli'' DH5αtransformed with BBa_J61046 in PSB1X3. | ||
| Line 827: | Line 828: | ||
[[File:SCU-r13.png]] | [[File:SCU-r13.png]] | ||
| - | Figure2. Quantitatively measurement of the | + | Figure2. Quantitatively measurement of the fluorescence intensity. |
Blue: ''E. coli'' DH5αtransformed with [http://parts.igem.org/wiki/index.php?title=Part:BBa_K1087018 BBa_K108701]6A. | Blue: ''E. coli'' DH5αtransformed with [http://parts.igem.org/wiki/index.php?title=Part:BBa_K1087018 BBa_K108701]6A. | ||
| Line 846: | Line 847: | ||
| - | {| border= | + | {| border=1px; cellspacing="0" cellpadding="0" |
|- | |- | ||
| style="width: 72px; height: 54px" | | | style="width: 72px; height: 54px" | | ||
| Line 952: | Line 953: | ||
|} | |} | ||
| - | |||
| - | |||
| - | |||
| - | |||
| - | |||
| - | |||
| - | |||
| - | |||
| - | |||
| | ||
| Line 966: | Line 958: | ||
| | ||
|} | |} | ||
| + | __NOEDITSECTION__ | ||
Latest revision as of 19:01, 13 October 2013

 "
"


