Team:BIOSINT Mexico/Modeling
From 2013.igem.org
| (One intermediate revision not shown) | |||
| Line 10: | Line 10: | ||
What we pretend with this mathematic model is to represent in a numerical way, the expression of the protein in the cell according with the emission that each concentration of GFP provides. | What we pretend with this mathematic model is to represent in a numerical way, the expression of the protein in the cell according with the emission that each concentration of GFP provides. | ||
| - | |||
| - | |||
[[File:Tabla.jpg]] | [[File:Tabla.jpg]] | ||
| Line 31: | Line 29: | ||
The graph represent an exponential growth of luminescent that at the same time is restricted the own GFP´s spectrum which only gives green color from 395nm to 475nm, also external factors like the medium in which bacteria growth because is limited. | The graph represent an exponential growth of luminescent that at the same time is restricted the own GFP´s spectrum which only gives green color from 395nm to 475nm, also external factors like the medium in which bacteria growth because is limited. | ||
| + | |||
| + | Recovered on september 5 from 2013 with an url of http://dwb.unl.edu/Teacher/NSF/C08/C08Links/pps99.cryst.bbk.ac.uk/projects/gmocz/gfp.htm | ||
Latest revision as of 03:45, 28 September 2013
Modeling
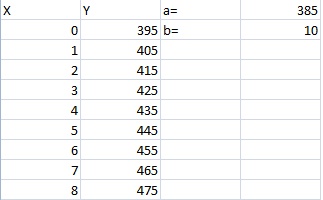
GFP tends to get fluorescents at the 395 nm because of the excitation of the protein this extend to the 475 nm where the green light is still visible, so we used this information in order to determine an equation that represents the exponential growth of the luminescent. What we pretend with this mathematic model is to represent in a numerical way, the expression of the protein in the cell according with the emission that each concentration of GFP provides.
We used linear regression in order to get the values of the constants, using statistical methods that also are applied in the equation. The slope is the value given to b and the intersection is the value for a.
y=a/(1+be^(-ct))
be^(-ct)=a/y-1
ln(b)-ct=ln(a/y)-ln(1)
c=(ln)(b)-ln(a)-ln(y))/t
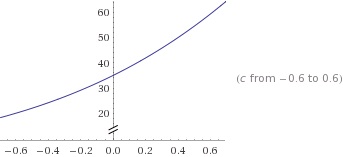
The graph represent an exponential growth of luminescent that at the same time is restricted the own GFP´s spectrum which only gives green color from 395nm to 475nm, also external factors like the medium in which bacteria growth because is limited.
Recovered on september 5 from 2013 with an url of http://dwb.unl.edu/Teacher/NSF/C08/C08Links/pps99.cryst.bbk.ac.uk/projects/gmocz/gfp.htm
 "
"


