Team:Imperial College/BioPlastic Recycling: PHB
From 2013.igem.org
| (89 intermediate revisions not shown) | |||
| Line 4: | Line 4: | ||
<h1>Module 2: Plastic Fantastic</h1> | <h1>Module 2: Plastic Fantastic</h1> | ||
| - | [[File: | + | [[File:Mod2diagram.png|thumbnail|800px|centre|]] |
| - | + | <br><br> | |
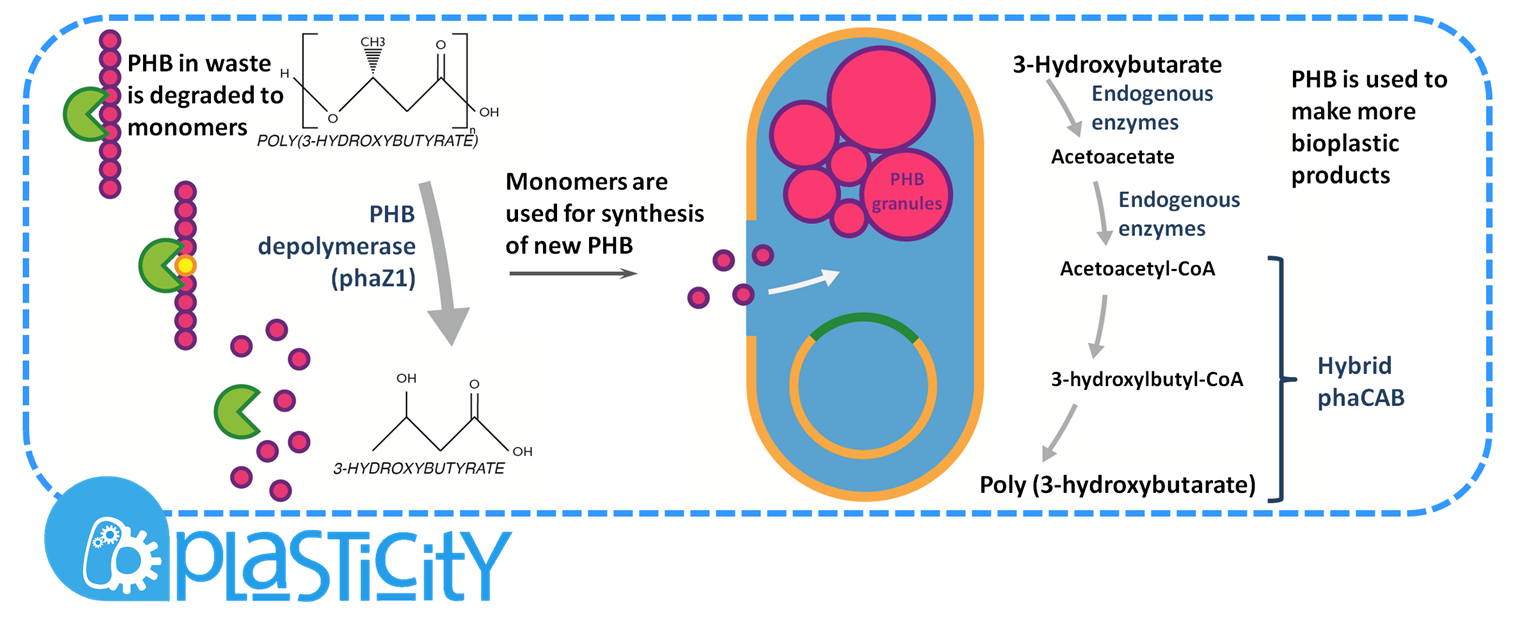
<b>Plastic Fantastic is a complete P(3HB) bioplastic recycling platform, where P(3HB) is degraded into monomeric form and then re-polymerised back into de novo P(3HB) for future applications.</b> | <b>Plastic Fantastic is a complete P(3HB) bioplastic recycling platform, where P(3HB) is degraded into monomeric form and then re-polymerised back into de novo P(3HB) for future applications.</b> | ||
| Line 25: | Line 25: | ||
<h3 id="overview">Overview</h3> | <h3 id="overview">Overview</h3> | ||
| - | <img style="float: right;" IMG SRC="https://static.igem.org/mediawiki/2013/ | + | <img style="float: right;" IMG SRC="https://static.igem.org/mediawiki/2013/5/5a/Overviewdiagram.png" ALT="testing" WIDTH=450 HEIGHT=450 POSITION=INLINE> |
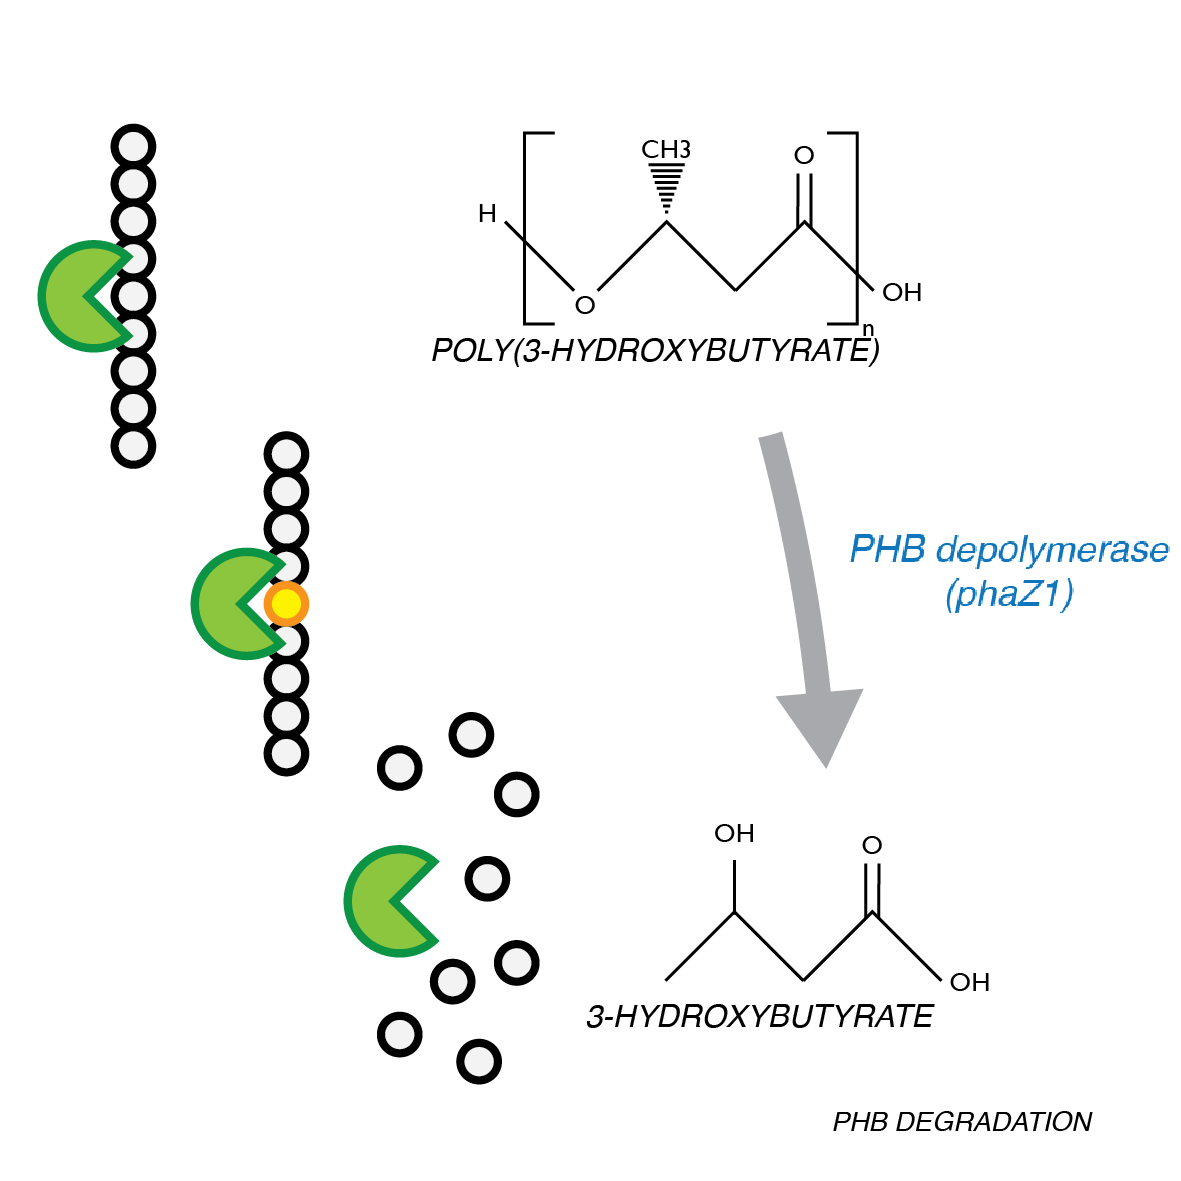
| - | <p align="justify"> We | + | <p align="justify">We have developed a system by which PHB can be recycled when products made from it come to the end of their life. In order to do this, we have engineered <i>E.coli</i> to break down P3HB extracellularly to release the monomers of 3-hydroxybutyrate (3-HB). We have designed the metabolic connection between P3HB degradation and synthesis so that 3-HB can be used as a carbon source. We are testing a putative 3-HB permease to increase the rate of uptake of the molecule into the cell. An intracellular 3-HB dehydrogenase will then form acetoacetate from 3-HB which the cell can utilise. We have thoroughly characterised the phaZ1 PHB depolymerase enzyme and demonstrated that it degrades PHB. Our models predict that use of the enzyme on a bioreactor scale will be effective in degrading bioplastic. </p> |
</html><h4>We are also establishing a second bioplastic recycling platform for polylactic acid (PLA)</h4> | </html><h4>We are also establishing a second bioplastic recycling platform for polylactic acid (PLA)</h4> | ||
| - | This aspect of our module is in collaboration with the Yale iGEM team | + | This aspect of our module is in collaboration with the [https://2013.igem.org/Team:Imperial_College/Collaboration#Yale:_PLA-degradation Yale iGEM team.] |
| + | |||
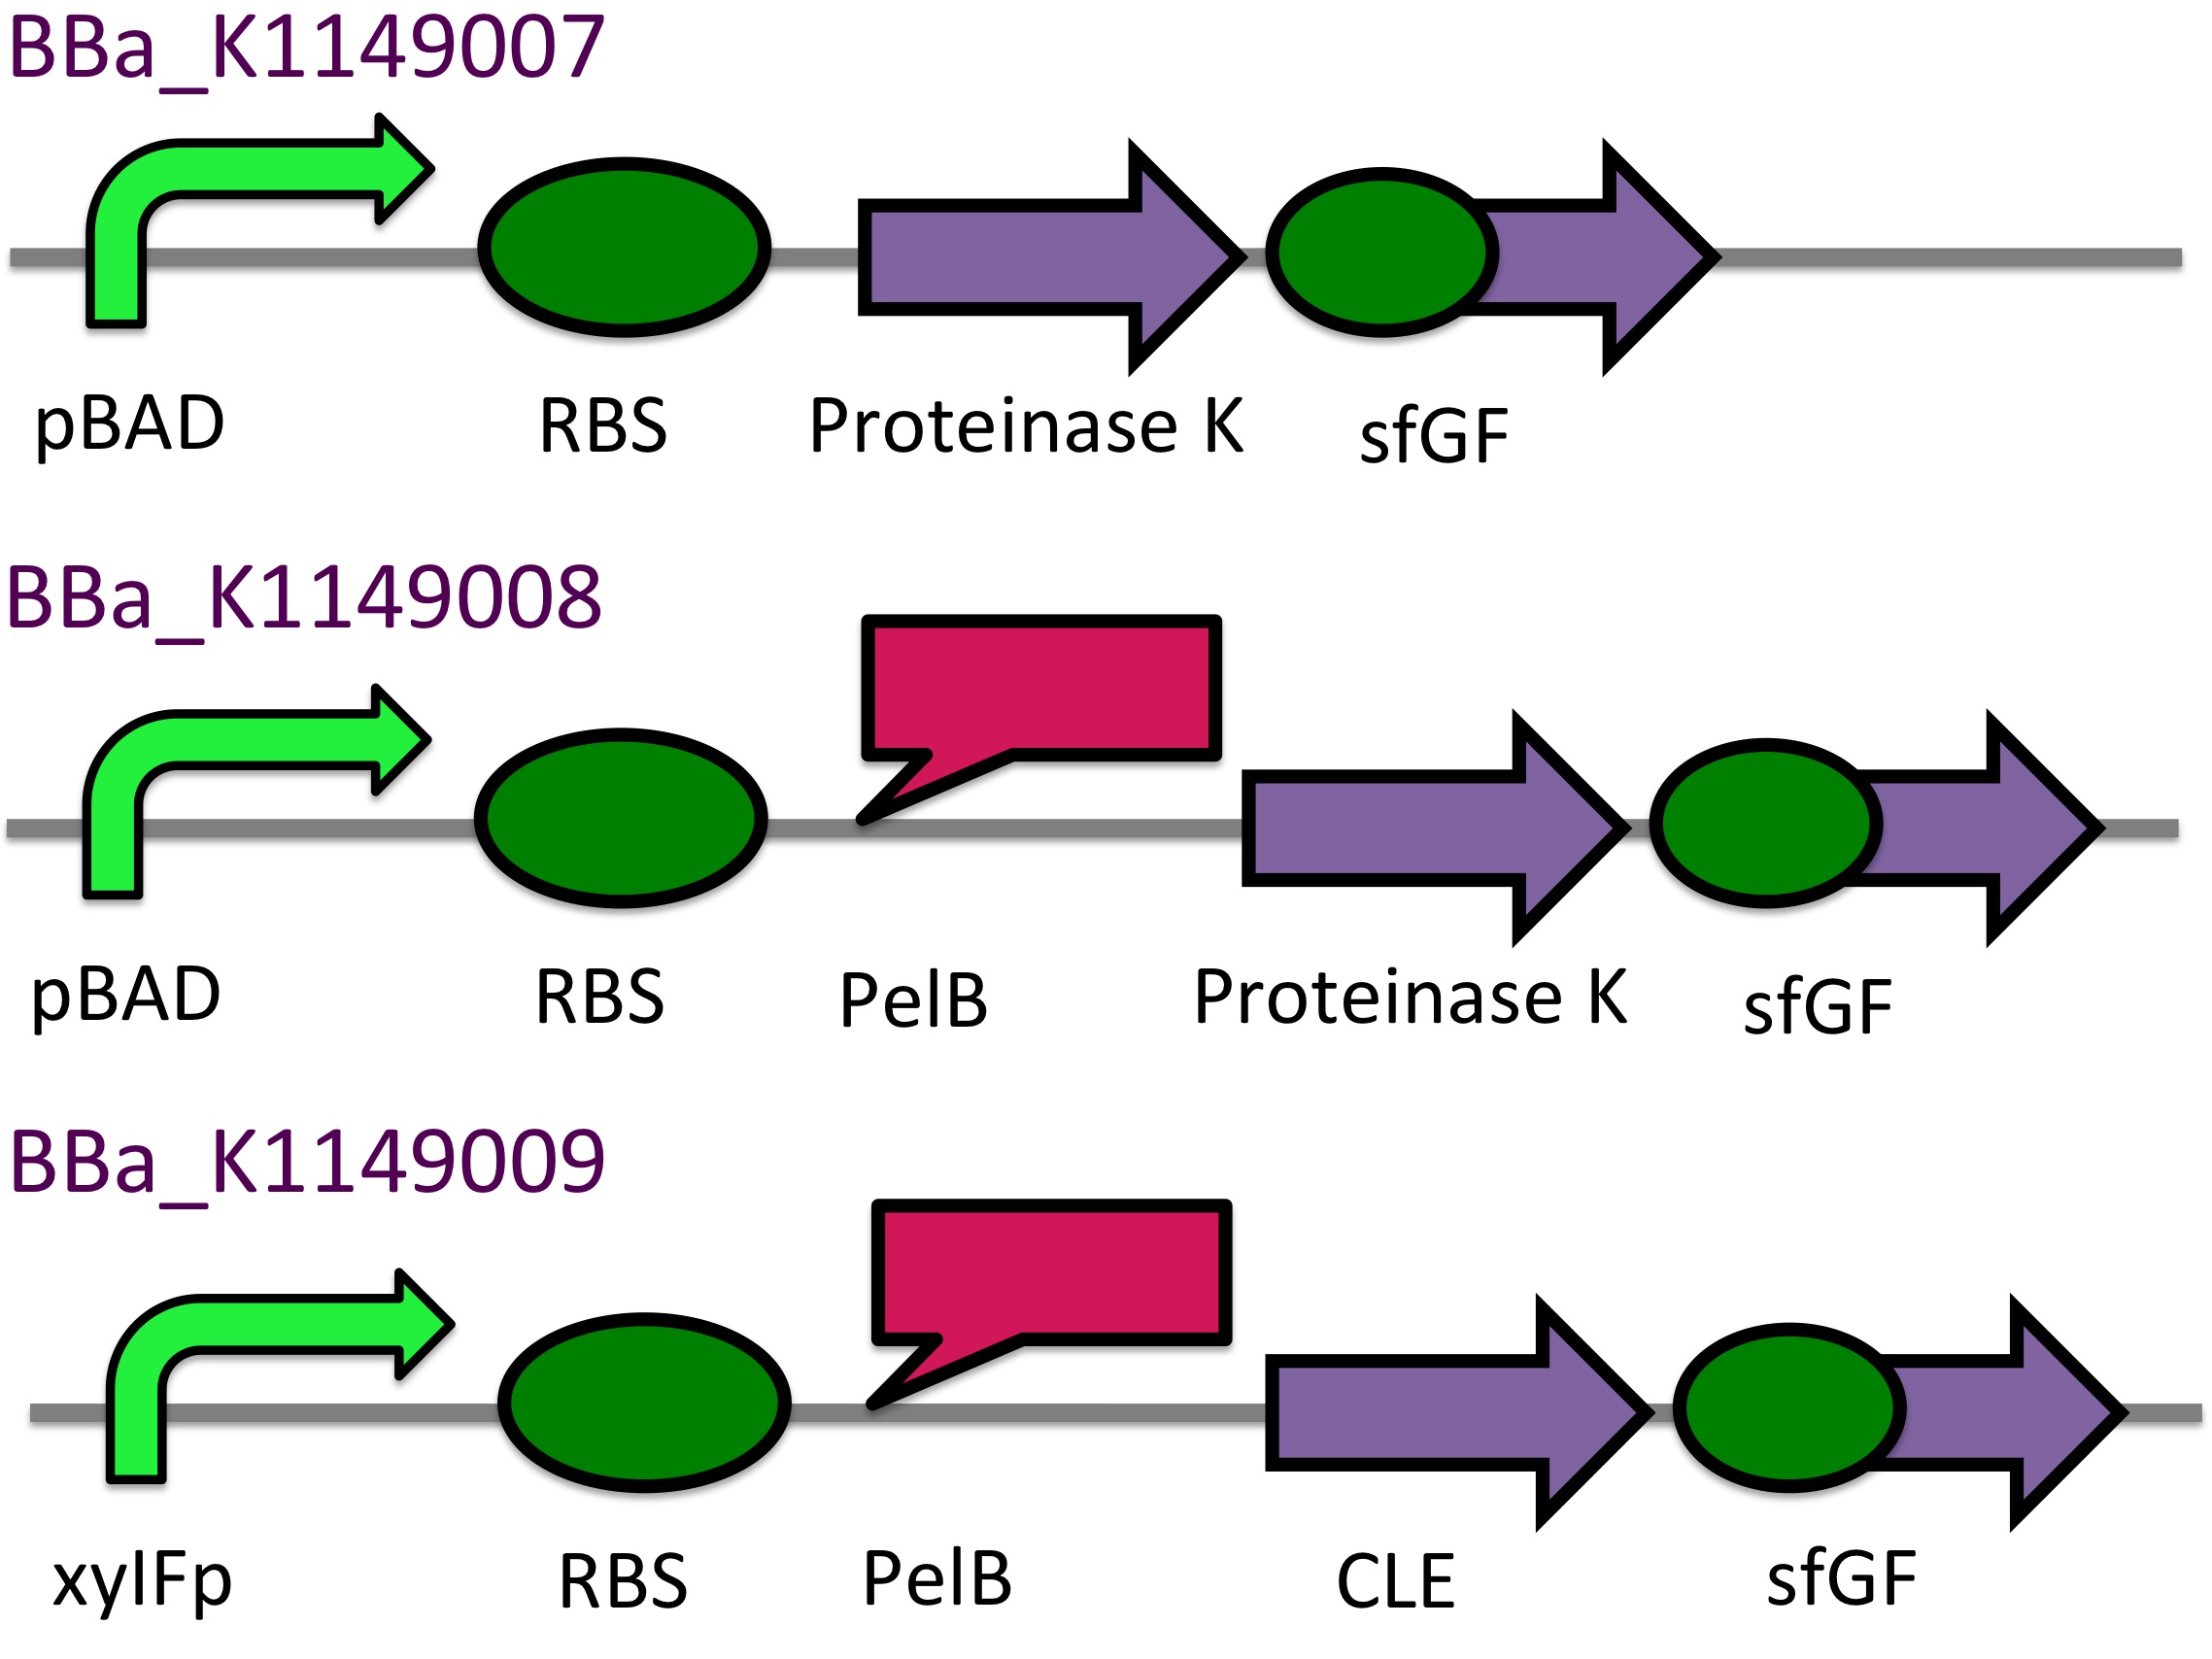
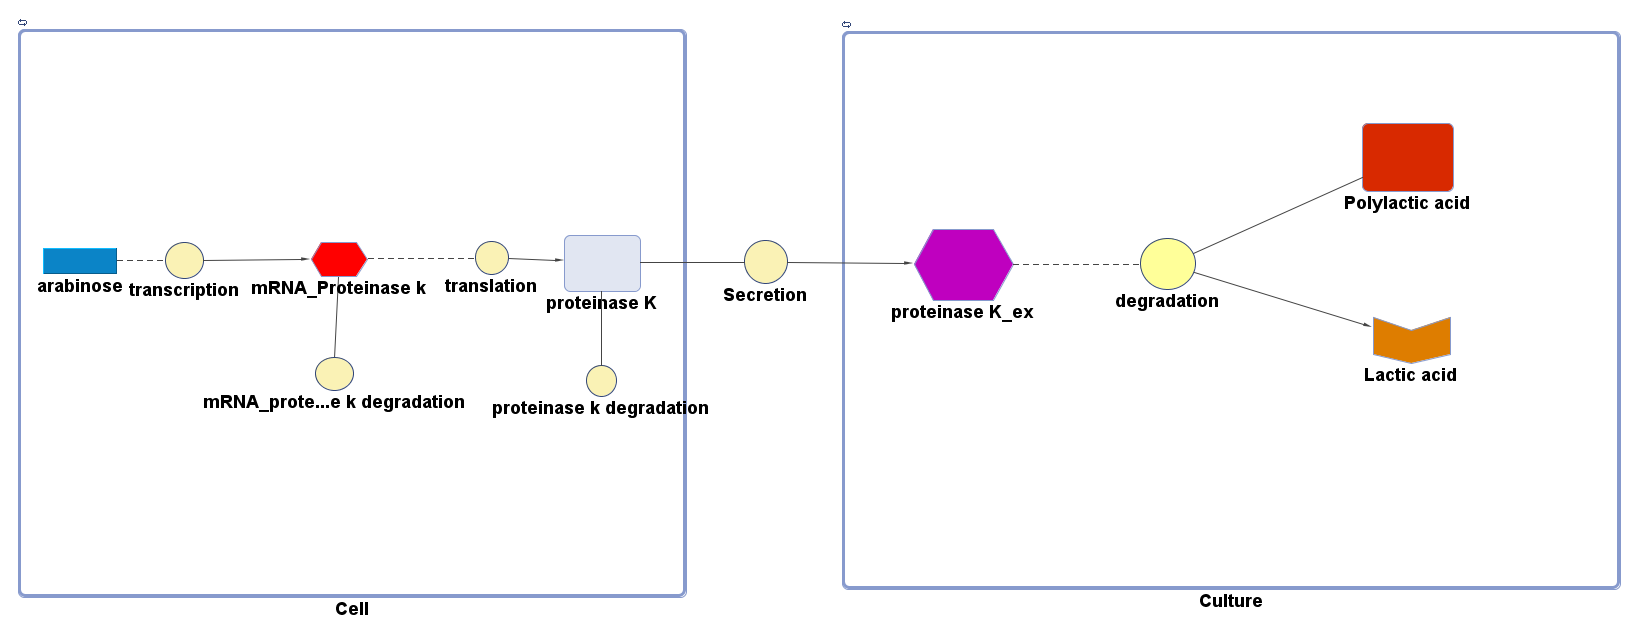
| + | Yale are working to biologically synthesise PLA. We have designed <i>E.coli</i> to secrete proteinase K to form lactic acid monomers, forming half of a second bioplastic recycling system. Lactic acid is used in the chemical synthesis of PLA and so this system could also be implemented in an industrial setting. | ||
<html> | <html> | ||
| Line 37: | Line 39: | ||
<h4> Degradation of P(3HB)</h4> | <h4> Degradation of P(3HB)</h4> | ||
| - | <p><b>Our bacteria should | + | <p><b>Our bacteria should resist any toxic effects that are associated with P(3HB) or 3HB</b></p> |
| - | <p><b>Our bacteria should | + | <p><b>Our bacteria should secrete a functional (P3HB) degrading enzyme</b></p> |
<h4> Synthesis of P(3HB) </h4> | <h4> Synthesis of P(3HB) </h4> | ||
<p><b>Our bacteria should take up and internalise 3HB from the surrounding media</b></p> | <p><b>Our bacteria should take up and internalise 3HB from the surrounding media</b></p> | ||
<p><b>Our bacteria should be able to utilise P(3HB) as a sole carbon source</b></p> | <p><b>Our bacteria should be able to utilise P(3HB) as a sole carbon source</b></p> | ||
| + | |||
| + | <h4> Degradation of PLA </h4> | ||
| + | |||
| + | <p><b>Our bacteria should secrete a functional PLA degrading enzyme</b></p> | ||
| + | <p><b>Our bacteria should be tolerant to lactic acid</b></p> | ||
| + | |||
| + | |||
</div> | </div> | ||
| Line 49: | Line 58: | ||
<div id="CollapsiblePanel11" class="CollapsiblePanel"> | <div id="CollapsiblePanel11" class="CollapsiblePanel"> | ||
| - | <div class="CollapsiblePanelTab" tabindex="0">< | + | <div class="CollapsiblePanelTab" tabindex="0"><h4>P(3HB) Degradation: Pathway</html><font size="1">▼</font size="1"><html></h4></div> |
| - | <div class="CollapsiblePanelContent"></html>The phaZ1 enzyme from <i>Ralstonia eutropha</i> can break down PHB. This bacterium uses PHB as storage molecule and expresses PhaZ1 when it needs to mobilise the nutrients from the polymer inside the cell. In our system, the enzyme will be secreted. | + | <div class="CollapsiblePanelContent"></html>The phaZ1 enzyme from <i>Ralstonia eutropha</i> can break down PHB. This bacterium uses PHB as storage molecule and expresses PhaZ1 when it needs to mobilise the nutrients from the polymer inside the cell. In our system, the enzyme will be secreted. |
[[File:Module2_4-10.jpg|thumbnail|center|500px]] | [[File:Module2_4-10.jpg|thumbnail|center|500px]] | ||
| Line 56: | Line 65: | ||
<div id="CollapsiblePanel12" class="CollapsiblePanel"> | <div id="CollapsiblePanel12" class="CollapsiblePanel"> | ||
| - | <div class="CollapsiblePanelTab" tabindex="0">< | + | <div class="CollapsiblePanelTab" tabindex="0"><h4> P(3HB) Degradation: Biobrick design</html><font size="1">▼</font size="1"><html></h4></div> |
<div class="CollapsiblePanelContent"></html> | <div class="CollapsiblePanelContent"></html> | ||
| - | <p>[http://parts.igem.org/Part:BBa_K1149010 BBa_K1149010]: <b>Extracellular expression of phaZ1, PHB depolymerase enzyme.</b> | + | <p>[http://parts.igem.org/Part:BBa_K1149010 BBa_K1149010]: <b>Extracellular expression of phaZ1, PHB depolymerase enzyme.</b> The construct design incorporates the RBS 0034 and is regulated by a strong xylose-inducible promoter [http://parts.igem.org/Part:BBa_I741018 BBa_I741018]. For extracellular secretion, we fused pelB secretion tag [http://parts.igem.org/Part:BBa_J32015 BBa_J32015] to the N terminus of the protein. </p> |
https://static.igem.org/mediawiki/parts/9/9c/PhaZ1_brick_diagram.jpg | https://static.igem.org/mediawiki/parts/9/9c/PhaZ1_brick_diagram.jpg | ||
| + | |||
| + | |||
| + | There are many strategies for secretion in <i>E.coli</i> and you can read about these on our [https://2013.igem.org/Team:Imperial_College/SecretionHelp Secretion Guide page] and find the corresponding biobricks and iGEM projects. If you are currently in the process of designing a Genetically Engineered Machine and aim to secrete a protein in E.coli, this page provides a good starting point to look for information. | ||
| + | |||
<html></div></div> | <html></div></div> | ||
<div id="CollapsiblePanel13" class="CollapsiblePanel"> | <div id="CollapsiblePanel13" class="CollapsiblePanel"> | ||
| - | <div class="CollapsiblePanelTab" tabindex="0">< | + | <div class="CollapsiblePanelTab" tabindex="0"><h4>Synthesis of P(3HB) from 3HB: Pathway</html><font size="1">▼</font size="1"><html></h4></div> |
<div class="CollapsiblePanelContent"></html> | <div class="CollapsiblePanelContent"></html> | ||
| - | |||
| - | [[File:Module2_6-17.jpg|thumbnail|center|500px|<b>Plastic synthesis from 3HB monomers.</b> 3HB is taken up into the cell by the putative permease. The 3HB is then converted to P(3HB) by the | + | <p>For the Plastic Fantastic recycling module, we designed a modifications to the PHB synthesis pathway of the Resourceful Waste module. The additional steps connect 3-Hydroxy-Butyrate to the downstream metabolite of the synthesis: acetoacetyl-CoA where from the next two steps are carried out by phaB and phaA enzymes, as described in Module1. This pathway contains both new enzymes that we are introducing to E.coli and also endogenous enzymes, such as AtoA/D. Because of this, the pathway is in connection with the cells normal metabolism and our models were of great use for predicting the flux through the pathway and informing the design.</p> |
| + | |||
| + | [[File:Module2_6-17.jpg|thumbnail|center|500px|<b>Plastic synthesis from 3HB monomers.</b> 3HB is taken up into the cell by the putative permease. The 3HB is then converted to P(3HB) by the pathways shown. The genes in <span style="color:#006600"><b>green</b></span> are those we have expressed within MG1655. Our system takes advantage of the endogenous ato operon.]] | ||
<html></div></div> | <html></div></div> | ||
<div id="CollapsiblePanel14" class="CollapsiblePanel"> | <div id="CollapsiblePanel14" class="CollapsiblePanel"> | ||
| - | <div class="CollapsiblePanelTab" tabindex="0">< | + | <div class="CollapsiblePanelTab" tabindex="0"><h4>Synthesis of P(3HB) from 3HB: Biobrick design</html><font size="1">▼</font size="1"><html></h4></div> |
<div class="CollapsiblePanelContent"></html> | <div class="CollapsiblePanelContent"></html> | ||
| + | |||
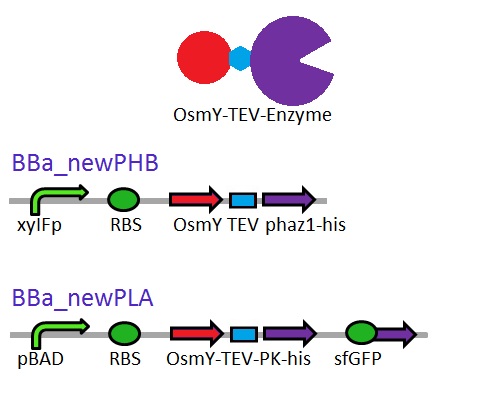
| + | <h4>3HB Permease:</h4> | ||
| + | <p>For 3HB import, we designed a biobrick for the expression of a Putative permease, found in the literature [http://www.ncbi.nlm.nih.gov/nuccore/AB330992(1)]. We optimised the sequence for <i>E.coli</i> and planned experiments with the construct.</p> | ||
| + | |||
<h4>Construct for bdh2 dehydrogenase expression</h4> | <h4>Construct for bdh2 dehydrogenase expression</h4> | ||
| - | <p>[http://parts.igem.org/Part:BBa_K1149050 BBa_K1149050]: <b>Intracellular expression of bdh2, 3HB dehydrogenase enzyme . </b> We have used a strong arabinose inducible promoter [http://parts.igem.org/Part:BBa_K206000 BBa_K206000] in front of the operon for controlled expression of the enzyme | + | <p>[http://parts.igem.org/Part:BBa_K1149050 BBa_K1149050]: <b>Intracellular expression of bdh2, 3HB dehydrogenase enzyme. </b> We have used a strong arabinose inducible promoter [http://parts.igem.org/Part:BBa_K206000 BBa_K206000] in front of the operon for controlled expression of the enzyme; this enzyme is only required by the cell if 3HB is present. We have included superfolder GFP [http://parts.igem.org/Part:BBa_K515005 BBa_K515005] in the operon with phaZ1 so that we can monitor gene expression from the promoter via fluorescence measurements. (see our corresponding data under results)</p> |
https://static.igem.org/mediawiki/parts/d/d4/Bdh2_brick_diagram.jpg <p> | https://static.igem.org/mediawiki/parts/d/d4/Bdh2_brick_diagram.jpg <p> | ||
http://www.igem.org/wiki/images/f/f0/Reaction_bdh.jpg </p> | http://www.igem.org/wiki/images/f/f0/Reaction_bdh.jpg </p> | ||
<html></div></div> | <html></div></div> | ||
| - | + | <div id="CollapsiblePanel15" class="CollapsiblePanel"> | |
| - | < | + | <div class="CollapsiblePanelTab" tabindex="0"><h4>PLA degradation: pathway and biobrick design</html><font size="1">▼</font size="1"><html></h4></div> |
| - | < | + | <div class="CollapsiblePanelContent"></html> |
| - | + | ||
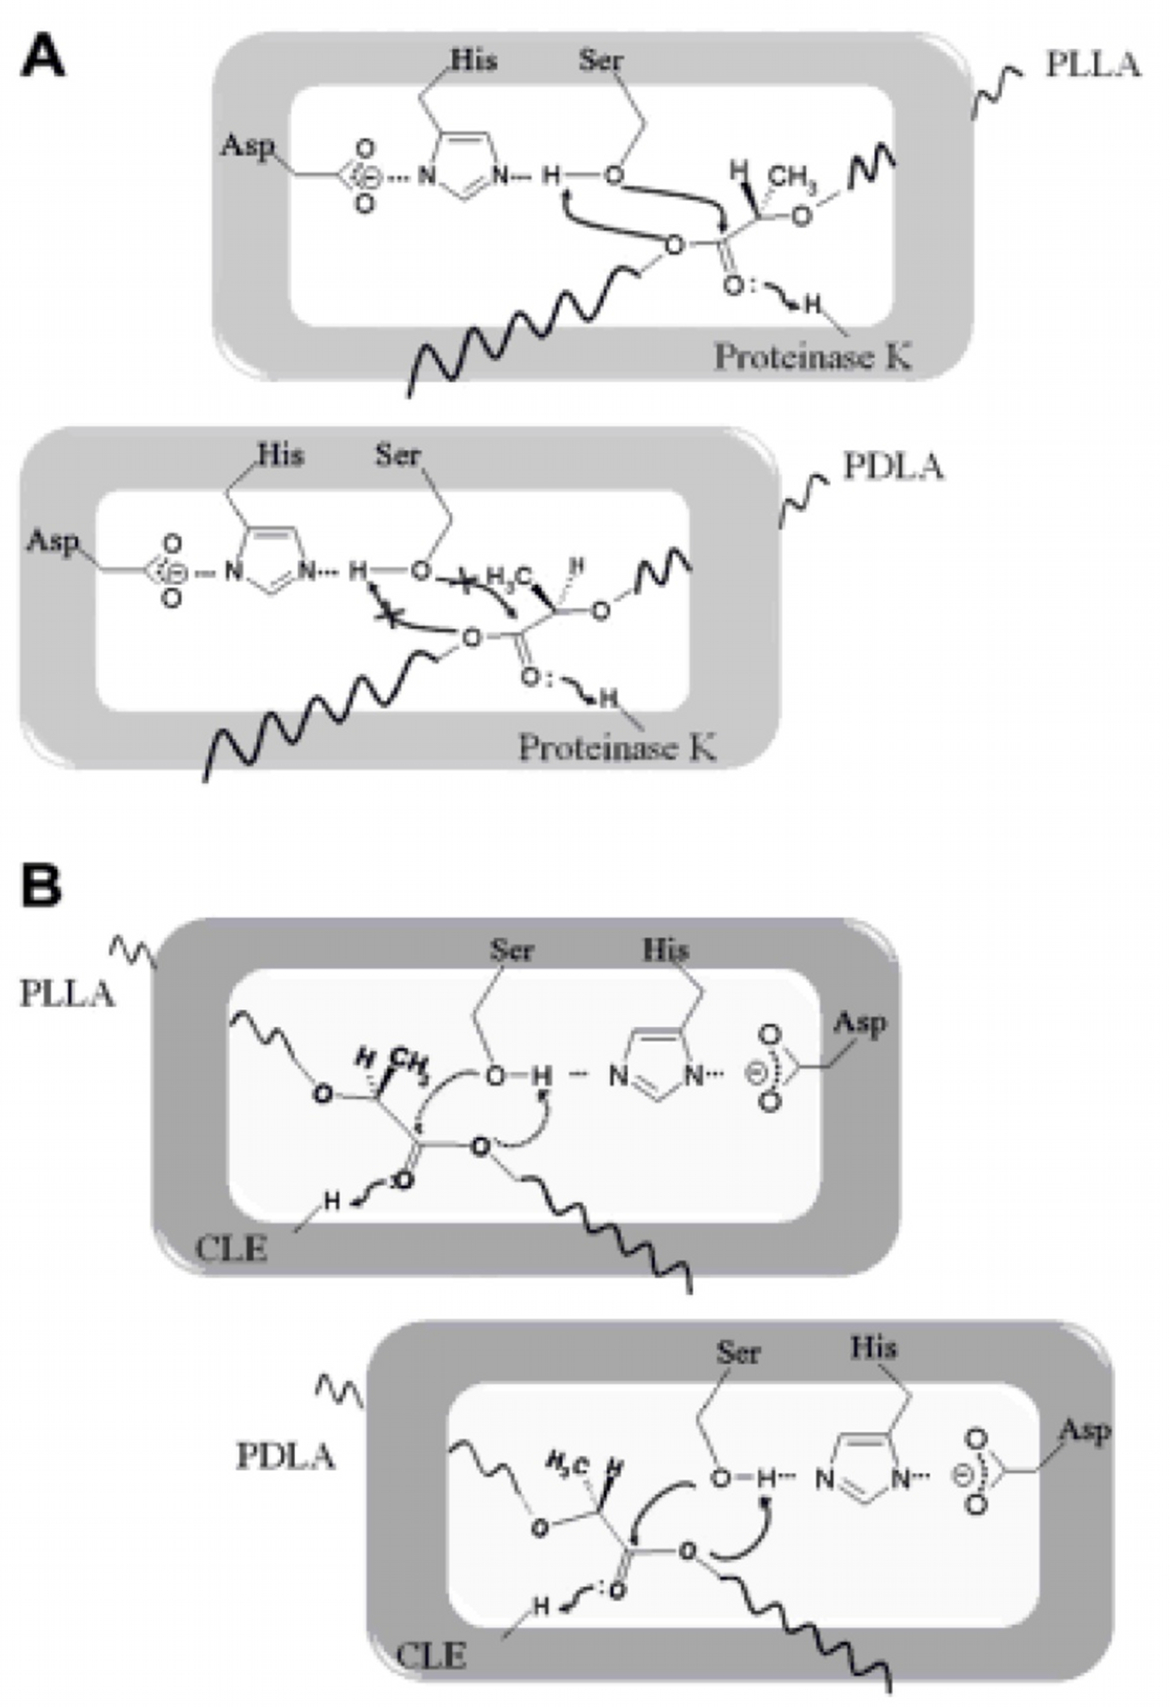
| - | <html> | + | Poly(lactic acid) (PLA) depolymerases are categorized into protease-type and lipase-type (7). We examined the literature and found sequences for one enzyme from each type. |
| + | <h3>Protease-type</h3> | ||
| + | *Proteinase K sequence from Tritirachium album, hydrolyzes poly(L-lactic acid) (PLLA) only. | ||
| + | <h3>Lipase-type</h3> | ||
| + | *Cutinase-like enzyme (CLE) sequence from Cryptococcus sp. strain S-2 preferentially hydrolyzes poly(D-lactic acid) (PDLA), but can also cleave poly(L-lactic acid) (PLLA). | ||
| + | |||
| + | We considered the safety aspects of using these two enzymes, since their sequences were originally from Risk Group 2 (RG2) organisms. We submitted our safety information to iGEM for review. <b>Safety forms were approved on October 2nd, 2013 by the iGEM Safety Committee.</b> | ||
| + | |||
| + | We did not use these organisms only the parts and the final sequences were codon optimised for expression in E. coli. | ||
| + | |||
| + | |||
| + | [[File:PLA_Biobricks.jpg|thumbnail|400px|left]] | ||
| + | [[File:PLA_degradation_mechanism.jpg|thumbnail|300px|left|Proteinase K and CLE, Poly lactic acid (PLA) degradation mechanisms. Adapted from Kawai et. al 2011]] | ||
| + | |||
| + | <html></div></div> | ||
</div> | </div> | ||
| Line 90: | Line 121: | ||
<div class="TabbedPanelsContent"> | <div class="TabbedPanelsContent"> | ||
<div id="CollapsiblePanelMod1" class="CollapsiblePanel"> | <div id="CollapsiblePanelMod1" class="CollapsiblePanel"> | ||
| - | <div class="CollapsiblePanelTab" tabindex="0">< | + | <div class="CollapsiblePanelTab" tabindex="0"><h4>1.0 P(3HB) Degradation Model</html><font size="1">▼</font size="1"><html></h4></div> |
<div class="CollapsiblePanelContent"> | <div class="CollapsiblePanelContent"> | ||
</html> | </html> | ||
| Line 105: | Line 136: | ||
[[File:Imperial College PhaZ1 gene.JPG|500px|center]] | [[File:Imperial College PhaZ1 gene.JPG|500px|center]] | ||
| + | *Notice that the degradation terms are lacking because the cells are assumed to be in stationary growth. Therefore, the assumed dominant process by which the mRNA and protein degrade - dilution - is absent. | ||
<h6>Values, sources and assumptions</h6> | <h6>Values, sources and assumptions</h6> | ||
| Line 140: | Line 172: | ||
<td>Personal conversation with Christopher Hirst, Department of Bioengineering, Imperial College London</td> | <td>Personal conversation with Christopher Hirst, Department of Bioengineering, Imperial College London</td> | ||
<td>Taken from data for xylF in MOPS with 0.4% glucose with extra xylR on the plasmid, however the plasmid is low copy and also the presence of the xylR gene on the plasmid definitely alters the expression level. Data fitted to Hill equation. This value was the most accurate we managed to obtain, though a rough one as 3% glucose in LB was used in the expreiment.</td> | <td>Taken from data for xylF in MOPS with 0.4% glucose with extra xylR on the plasmid, however the plasmid is low copy and also the presence of the xylR gene on the plasmid definitely alters the expression level. Data fitted to Hill equation. This value was the most accurate we managed to obtain, though a rough one as 3% glucose in LB was used in the expreiment.</td> | ||
| - | |||
| - | |||
| - | |||
| - | |||
| - | |||
| - | |||
| - | |||
| - | |||
</tr> | </tr> | ||
<tr> | <tr> | ||
| Line 156: | Line 180: | ||
<td>Please see derivation 2 below.</td> | <td>Please see derivation 2 below.</td> | ||
<td>Please see derivation 2 below.</td> | <td>Please see derivation 2 below.</td> | ||
| - | |||
| - | |||
| - | |||
| - | |||
| - | |||
| - | |||
| - | |||
| - | |||
</tr> | </tr> | ||
<tr> | <tr> | ||
<th>[Xylose]</th> | <th>[Xylose]</th> | ||
| - | <td>Concentration of xylose</td> | + | <td>Concentration of xylose in cell</td> |
| - | <td> | + | <td>constant: 0.01</td> |
<td>mM</td> | <td>mM</td> | ||
<td>-</td> | <td>-</td> | ||
| - | <td> | + | <td>Manual input.</td> |
</tr> | </tr> | ||
<tr> | <tr> | ||
| Line 237: | Line 253: | ||
<th>k<sub>cat,PhaZ1</sub></th> | <th>k<sub>cat,PhaZ1</sub></th> | ||
<td>Turnover number of PhaZ1 with P(3HB) as substrate</td> | <td>Turnover number of PhaZ1 with P(3HB) as substrate</td> | ||
| - | <td> | + | <td>214</td> |
<td>1/min</td> | <td>1/min</td> | ||
| - | <td> | + | <td>Please see "Testing and Results"</td> |
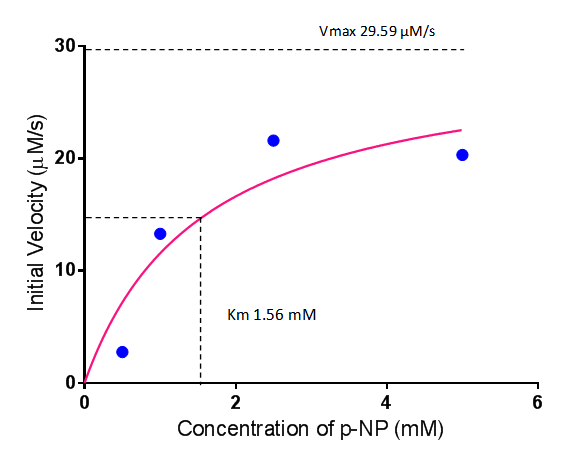
| - | <td> | + | <td>Vmax was obtained from enzymatic assay results, value = 29.59uM/s. kcat = Vmax/[E], where Vmax is the maximum velocity of enzymatic reaction and [E] is the total enzyme concentration used. [E] was measured as 360ng/uL. The molar mass of PhaZ1 (43496 g/mol [http://www.mybiosource.com/datasheet.php?products_id=1012640])was used to convert the units of [E] into g/L. After appropriate conversions and calculations, kcat was calculated to be 214/min</td> |
| - | + | ||
</tr> | </tr> | ||
<tr> | <tr> | ||
<th>K<sub>m</sub></th> | <th>K<sub>m</sub></th> | ||
<td>Michaelis constant</td> | <td>Michaelis constant</td> | ||
| - | <td> | + | <td>1.56</td> |
<td>mM</td> | <td>mM</td> | ||
| - | <td> | + | <td>Please see "Testing and Results"</td> |
| - | <td> | + | <td>-</td> |
</tr> | </tr> | ||
<tr> | <tr> | ||
| Line 262: | Line 277: | ||
<tr> | <tr> | ||
<th>[P(3HB)]</th> | <th>[P(3HB)]</th> | ||
| - | <td> | + | <td>Extracellular concentration of P(3HB)</td> |
| - | <td> | + | <td>50</td> |
<td>mM</td> | <td>mM</td> | ||
<td>-</td> | <td>-</td> | ||
| + | <td>user-defined initial value</td> | ||
| + | </tr> | ||
| + | <tr> | ||
| + | <th>Secretion</th> | ||
| + | <td>Secretion rate of PhaZ1 from cell to outside</td> | ||
| + | <td>0.5</td> | ||
| + | <td>1/minute</td> | ||
<td>-</td> | <td>-</td> | ||
| + | <td>Appears as "k" in the Simbiology parameter list for that reaction object. The resulting extracellular concentration was then scaled up by multiplying the concentration by 1.5x10<sup>21</sup> cells.</td> | ||
</tr> | </tr> | ||
| - | |||
</table> | </table> | ||
<h4>1.3 Simulation results</h4> | <h4>1.3 Simulation results</h4> | ||
<p align="justify"> | <p align="justify"> | ||
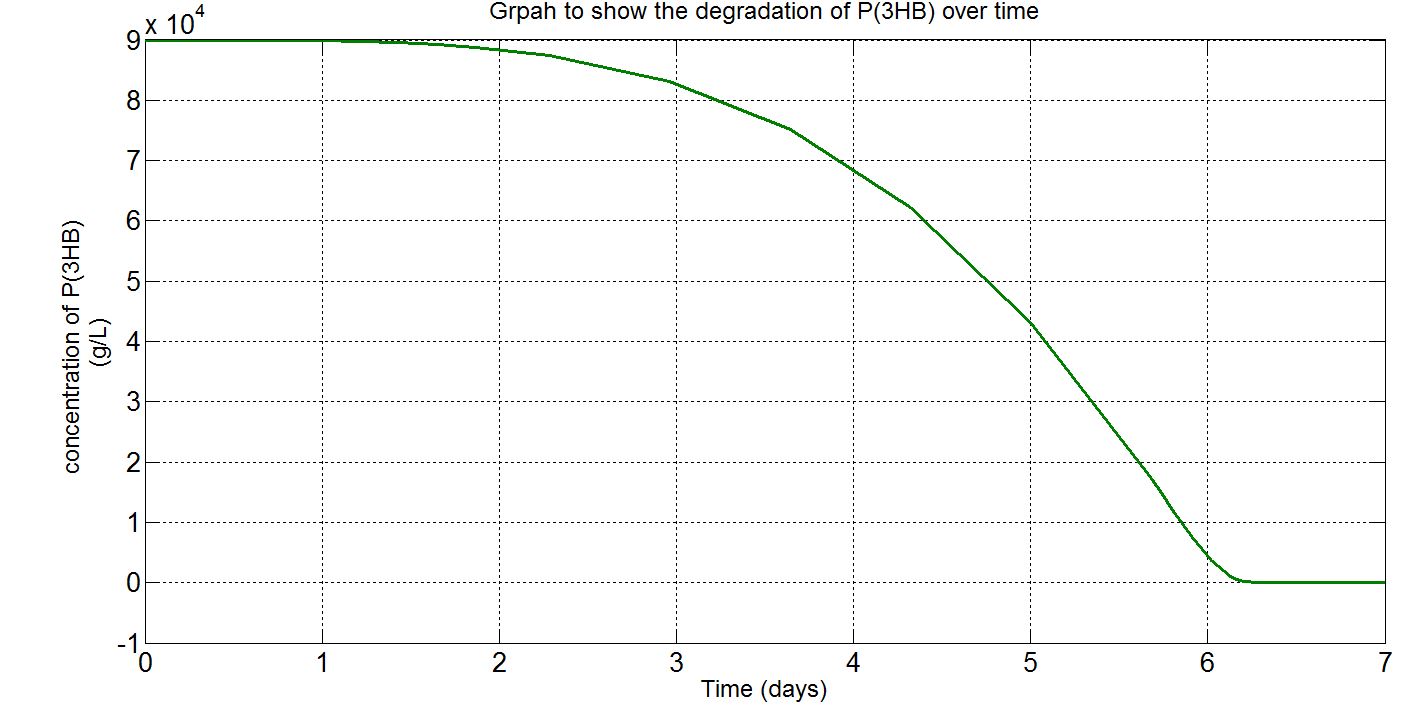
| - | + | Please note that the result at this point was already scaled up (please refer to "secretion" from the table above. The value 1.5x10<sup>21</sup> was chosen as the number of cells because this was the order of magnitude that would give the reasonable amount of enzyme for degradation. Other parameters such as those involved in gene expression were the closest we could get them to and the enzyme kinetics data were taken from the our own enzyme assay experiment. Therefore, we were left with the number of cells and the unknown secretion rate to modify. After several runs of simulation, we decided to increase the number of cells to 1.5x10<sup>21</sup>, instead of the 1.5x10<sup>12</sup> assumed in the synthesis model. | |
</p> | </p> | ||
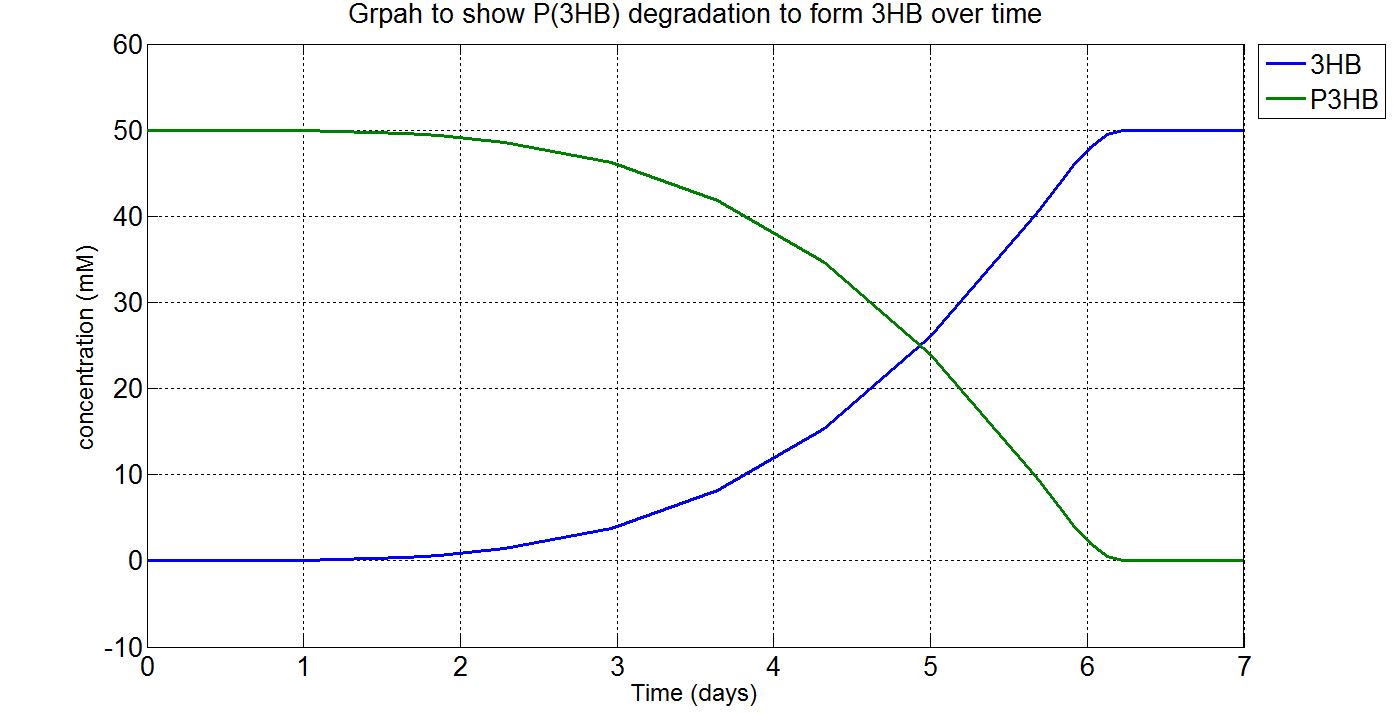
| - | <p>'''(i) | + | <p>'''(i)P(3HB) and 3HB levels over time (units: mM)'''</p> |
[[File:Imperial College 1phaz.JPG]] | [[File:Imperial College 1phaz.JPG]] | ||
| - | <p>'''(ii) | + | <p>'''(ii)P(3HB) level over time (units: g/L)'''</p> |
[[File:Imperial College 2phaz.JPG]] | [[File:Imperial College 2phaz.JPG]] | ||
| - | |||
| - | |||
<h5> Graphs (i) to (ii) unit conversion</h5> | <h5> Graphs (i) to (ii) unit conversion</h5> | ||
*To convert from mM to g/L: | *To convert from mM to g/L: | ||
| - | **Molecular weight (Mw) of 3HB = | + | **Molecular weight(Mw) of P(3HB) = 1.8x10<sup>12</sup>g/mol[http://webpages.charter.net/hvalentin/PDF-files/18.pdf] |
| - | * | + | <p align="justify">(Please note that this value was taken from a paper about the "Production of poly(3-hydroxybutyrate-co-4-hydroxybutyrate) in recombinant Escherichia coli grown on glucose" instead of the production of poly(3-hydroxybutyrate). However, this is the closest we managed to get as far as species, substrate and type of plastic are concerned.</p> |
| + | <p align="justify">Also, it was noticed that the molecular weight would change depending on the cultivation time (as conditions such as growth and pH can also affect it) and it was hard to find a paper that contains the exact same conditions and the range of cultivation times for our simulations. Furthermore, in reality there wouldn't be a single value of molecular weight obtained, but a range of values (known as polydispersity).[http://aem.asm.org/content/78/9/3177.full] Therefore, it was assumed that the molecular weight would remain constant during the time course of the simulation and that the value should be considered as an average.)</p> | ||
| + | *∴P(3HB)concentration in mM x 10<sup>-3</sup> x 1.8x10<sup>12</sup>g/mol = concentration in g/L | ||
| - | < | + | <html> |
| - | + | <h4>Future work</h4> | |
| - | + | <p align="justify">With a more complete characterisation of the promoter under the experimental conditions used for this system, more accurate gene expression parameter values can be plugged into the model. Also, the secretion rate was hard to determine and would be an important value to obtain experimentally because it is the only rate that controls how much of the enzyme is released to the extracellular space.</p> | |
| - | + | ||
| - | + | ||
| - | + | ||
| - | + | ||
| - | + | ||
| - | + | ||
| + | <h4>P(3HB) degradation model:Download</h4> | ||
| + | <p><a href="https://2013.igem.org/File:P3HB_synthesis_model.zip"><img src="https://static.igem.org/mediawiki/2011/8/8c/ICL_DownloadIcon.png" width="180px" /></a></p> | ||
| + | |||
| + | <h4>Additional script:Download</h4> | ||
| + | <p><a href="https://2013.igem.org/File:P3HBdegradation_additional_script.zip"><img src="https://static.igem.org/mediawiki/2011/8/8c/ICL_DownloadIcon.png" width="180px" /></a></p> | ||
| + | |||
| + | </html> | ||
<html> | <html> | ||
| Line 302: | Line 325: | ||
</div> | </div> | ||
<div id="CollapsiblePanelMod2" class="CollapsiblePanel"> | <div id="CollapsiblePanelMod2" class="CollapsiblePanel"> | ||
| - | <div class="CollapsiblePanelTab" tabindex="0">< | + | <div class="CollapsiblePanelTab" tabindex="0"><h4>2.0 P(3HB) production from 3HB monomers</html><font size="1">▼</font size="1"><html></h4></div> |
<div class="CollapsiblePanelContent"> | <div class="CollapsiblePanelContent"> | ||
</html> | </html> | ||
| - | <p align="justify"> In module 2, the main objective is the bioplastic recycling. We have a detailed explanation of the P(3HB) synthesis model and the optimization in P(3HB) production yield. Our synthetic pathway of converting monomeric 3HB to polymeric P(3HB) is described in [https://2013.igem.org/Team:Imperial_College/Waste_Degradation:_SRF module one]. In MAPLE system, both glucose from mixed waste and 3HB monomers are the inputs to produce P(3HB). In this section, we are going to introduce a | + | <p align="justify"> In module 2, the main objective is the bioplastic recycling. We have a detailed explanation of the P(3HB) synthesis model and the optimization in P(3HB) production yield. Our synthetic pathway of converting monomeric 3HB to polymeric P(3HB) is described in [https://2013.igem.org/Team:Imperial_College/Waste_Degradation:_SRF module one]. In MAPLE system, both glucose from mixed waste and 3HB monomers are the inputs to produce P(3HB). In this section, we are going to introduce a customized metabolic model that consisted our synthetic pathway with a metabolic model built by Angela Dixon. [http://digitalcommons.usu.edu/engineering_datasets/1/] The combined metabolic model can predict the P(3HB) production with both 3HB and glucose as sources. </p> |
| - | < | + | <h4>Introduction of the metabolic model</h4> |
<p align="justify"> | <p align="justify"> | ||
The metabolic model predicts the interaction of our pathway with endogenous pathways. In synthetic biology, an ideal system is fully orthogonal. However, if the synthetic pathway uses some metabolites from the metabolism pathways, the metabolic fluxes (the rate of conversion between metabolites) will be affected. If the cell is overloaded by losing too much metabolites, it would either reject the synthetic pathway or burn out. As for the optimization of PHB production in our MAPLE system, metabolic analysis need to be carried out to estimate the effects on the cell metabolism from increases in the PHB production. </p> | The metabolic model predicts the interaction of our pathway with endogenous pathways. In synthetic biology, an ideal system is fully orthogonal. However, if the synthetic pathway uses some metabolites from the metabolism pathways, the metabolic fluxes (the rate of conversion between metabolites) will be affected. If the cell is overloaded by losing too much metabolites, it would either reject the synthetic pathway or burn out. As for the optimization of PHB production in our MAPLE system, metabolic analysis need to be carried out to estimate the effects on the cell metabolism from increases in the PHB production. </p> | ||
| Line 312: | Line 335: | ||
<p align="justify">We altered the metabolic model by Angela Dixon in her paper “Predictive Mathematical Model for Polyhydroxybutyrate Synthesis in Escherichia coli”. [http://digitalcommons.usu.edu/engineering_datasets/1/] The metabolic model is built in Simbiology, which is an extension in MATLAB especially for biological system. The model consists two metabolic pathways: Glycolysis and TCA cycle. The reactions in the metabolic pathways are defined by ordinary differential equations and kinetic parameters. The model also contains a synthetic pathway that produce P(3HB) from acetyl-coA. The pathway consists three enzymes which are PhaA, PhaB and PhaC. | <p align="justify">We altered the metabolic model by Angela Dixon in her paper “Predictive Mathematical Model for Polyhydroxybutyrate Synthesis in Escherichia coli”. [http://digitalcommons.usu.edu/engineering_datasets/1/] The metabolic model is built in Simbiology, which is an extension in MATLAB especially for biological system. The model consists two metabolic pathways: Glycolysis and TCA cycle. The reactions in the metabolic pathways are defined by ordinary differential equations and kinetic parameters. The model also contains a synthetic pathway that produce P(3HB) from acetyl-coA. The pathway consists three enzymes which are PhaA, PhaB and PhaC. | ||
The reasons we chose this model:</p> | The reasons we chose this model:</p> | ||
| - | <p>1. The model is based on ODEs instead of FBA (flux balance analysis) | + | <p>1. The model is based on ODEs instead of FBA (flux balance analysis), which is a common method of metabolic analysis. However, FBA cannot determine the real time concentrations of the metabolites whereas it can be done by models with ODEs.</p> |
<p>2. Only single gene deletion or addition can be performed in FBA. More than that, the metabolic model here can perform modification on any single or multiple genes and reactions through Simbiology. </p> | <p>2. Only single gene deletion or addition can be performed in FBA. More than that, the metabolic model here can perform modification on any single or multiple genes and reactions through Simbiology. </p> | ||
<p>3. The FBA model is static, it cannot analyze the dynamic interactions between our synthetic pathways with the metabolic pathways. As both our P(3HB) synthesis model and the metabolic model are in the same platform. It was really easy to integrate our pathway into the metabolic model.</p> | <p>3. The FBA model is static, it cannot analyze the dynamic interactions between our synthetic pathways with the metabolic pathways. As both our P(3HB) synthesis model and the metabolic model are in the same platform. It was really easy to integrate our pathway into the metabolic model.</p> | ||
| - | <p>4. The strain in the metabolic model is E.coli K12, the strain MG1655 we are using is also included in K12 group. The models can therefore be more easily combined. | + | <p>4. The strain in the metabolic model is E.coli K12, the strain MG1655 we are using is also included in K12 group. The models can therefore be more easily combined. </p> |
<p><b>In our project, we have a different pathway:</b></p> | <p><b>In our project, we have a different pathway:</b></p> | ||
<p>1. We use 3HB as one of the input.</p> | <p>1. We use 3HB as one of the input.</p> | ||
| - | <p>2. | + | <p>2. ato system is present in the E.coli MG1655 strain. </p> |
| - | <p>3. We removed phaA in our case because we use 3HB as the major source to produce P(3HB) | + | <p>3. We removed phaA in our case because we use 3HB as the major source to produce P(3HB), it will avoid too much acetyl-coA be taken from the metabolic pathways.</p> |
| - | <p align="justify">Therefore, we | + | <p align="justify">Therefore, we substituted the original pathway with our synthetic pathway. Moreover, we added our gene expression models for the enzymes into the metabolic model as well. In terms of the consistency of the model, we changed the units of our synthetic pathway into micro molar and seconds. </p> |
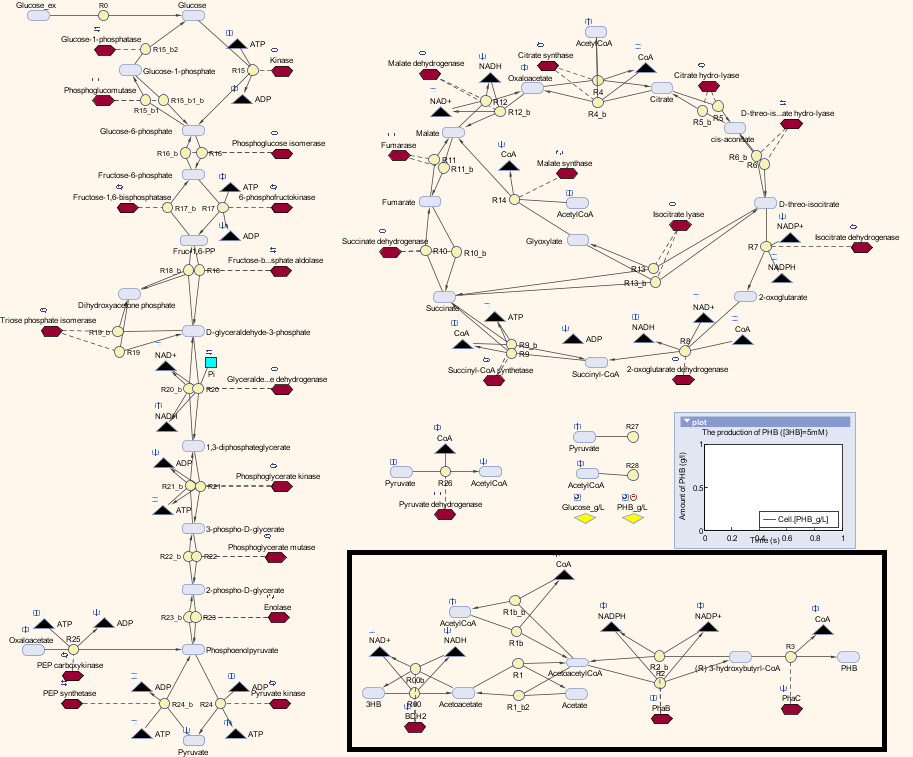
<p>Here is the combination of our model with the metabolic model</p> | <p>Here is the combination of our model with the metabolic model</p> | ||
[[File:MetaSyn.png|800px|centre]] | [[File:MetaSyn.png|800px|centre]] | ||
<p><b>The pathway with the black border is our synthetic pathway. </b></p> | <p><b>The pathway with the black border is our synthetic pathway. </b></p> | ||
| - | |||
[[File:KEYmeta.png|600px|centre]] | [[File:KEYmeta.png|600px|centre]] | ||
<p align="justify">We also carried out a parameter estimations of the initial concentrations of several substrates in our synthetic pathway. The reason is we have single-cell scaled magnitude for them originally (fM level), but there are much higher magnitudes in any of the species in the metabolic pathways (mM level). Therefore, we scaled up the pathway in order to maintain the consistency of the model. As for the metabolites which are involved in our pathway, we cloned the blocks of them from the metabolic pathway in Simbiology and deliberately put them into our pathway. That means our pathway dynamically interact with the metabolic pathways. </p> | <p align="justify">We also carried out a parameter estimations of the initial concentrations of several substrates in our synthetic pathway. The reason is we have single-cell scaled magnitude for them originally (fM level), but there are much higher magnitudes in any of the species in the metabolic pathways (mM level). Therefore, we scaled up the pathway in order to maintain the consistency of the model. As for the metabolites which are involved in our pathway, we cloned the blocks of them from the metabolic pathway in Simbiology and deliberately put them into our pathway. That means our pathway dynamically interact with the metabolic pathways. </p> | ||
| Line 354: | Line 376: | ||
<td>uM</td> | <td>uM</td> | ||
<td>-</td> | <td>-</td> | ||
| - | <td>The ato system in E.coli suggest a favourable conversion from acetoacetyl-coA to acetoacetate. | + | <td>The ato system in E.coli suggest a favourable conversion from acetoacetyl-coA to acetoacetate. We assumed the concentration of acetoacetate is 10 times larger than acetoacetyl-coA[http://www.sciencedirect.com/science/article/pii/0003986177904969]</td> |
</tr> | </tr> | ||
<tr> | <tr> | ||
| Line 442: | Line 464: | ||
</table> | </table> | ||
<h4>ATP analysis:</h4> | <h4>ATP analysis:</h4> | ||
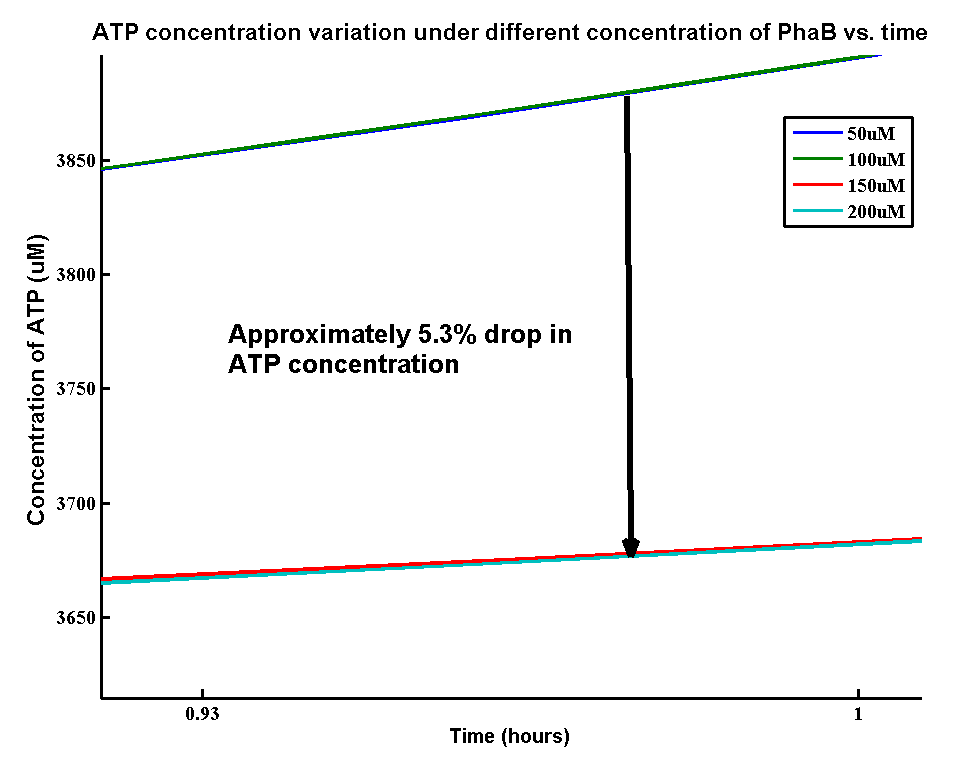
| - | <p>In our optimization of P(3HB) production module, we discovered that increasing in the PhaB expression can efficiently increase the yield of P(3HB). It’s important to see whether increase in the PhaB expression would dramatically | + | <p>In our optimization of P(3HB) production module, we discovered that increasing in the PhaB expression can efficiently increase the yield of P(3HB). It’s important to see whether increase in the PhaB expression would dramatically affects the metabolic pathways or not. As ATP is the essential energy carriers in the cell, we carried a parameter scan for the variation in ATP concentration under different concentrations of PhaB.</p> |
[[File:ATPPHAB.png|600px|centre]] | [[File:ATPPHAB.png|600px|centre]] | ||
| - | <p>There is an approximately 5.3% drop in the concentration of ATP when increasing the phaB concentration from 50uM to 200uM. It suggests that increasing the | + | <p>There is an approximately 5.3% drop in the concentration of ATP when increasing the phaB concentration from 50uM to 200uM. It suggests that increasing the flux in our pathway may reduce the energy transportation in the cell. However, it’s still unsure about the effect of 5.3% drop in ATP concentration on the cell growth.</p> |
| - | < | + | <h4>Large scale PHB production and implementation in MAPLE</h4> |
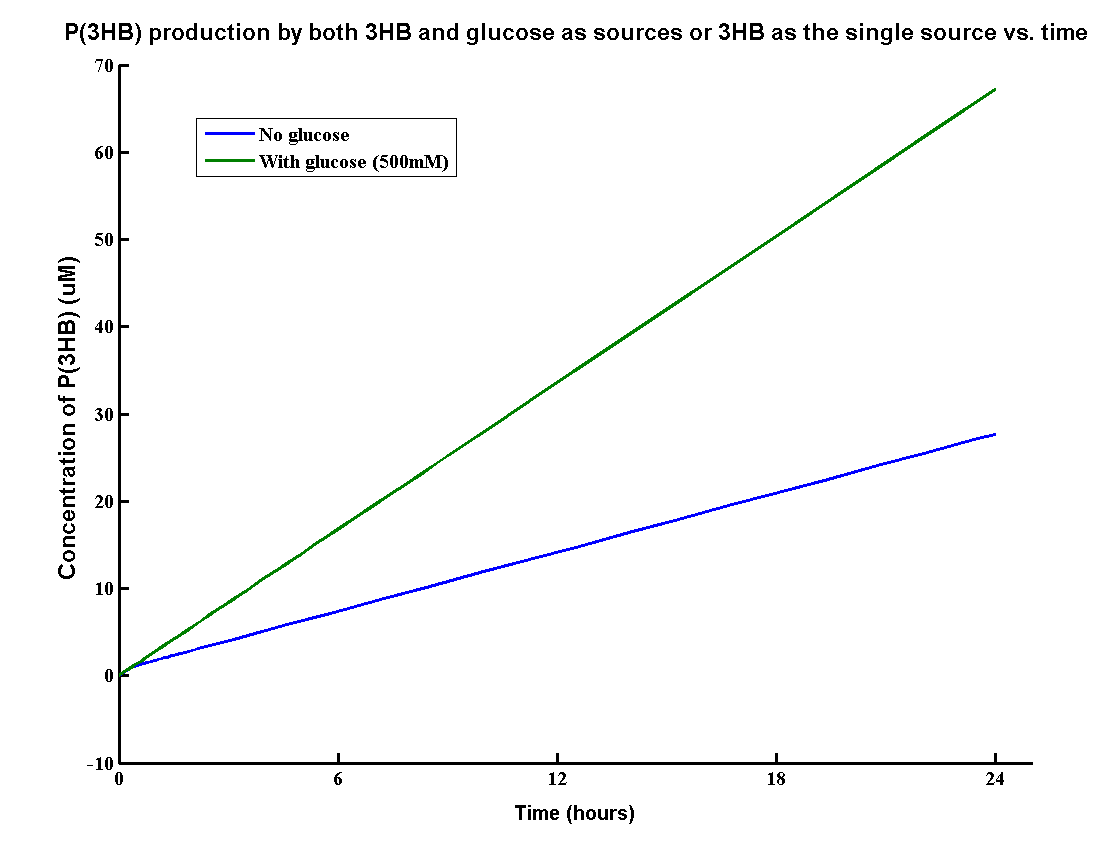
| - | <p>In our MAPLE system, the bioplastic | + | <p>In our MAPLE system, the bioplastic P(3HB) is produced from both 3HB monomers and glucose. 3HB is the degradation product from the wasted P(3HB)plastic and glucose is the product from the degradation of mixed waste. Therefore, the overall PHB production rates need to be determined by the model. |
| - | + | ||
| - | + | ||
[[File:GLU3HB.png|600px|centre]] | [[File:GLU3HB.png|600px|centre]] | ||
| - | The result shows that the PHB yield | + | The result shows that the PHB yield can reach 70g/L after one day with both inputs whereas about 30g/L with glucose. It proves that using both glucose and 3HB can double the yield of P(3HB). The production rate 70g/L/Day is also relatively high for industrial scale of bioplastic production. |
<b>Assumption in the production</b> | <b>Assumption in the production</b> | ||
**Conditions and considerations accompanying this value are: | **Conditions and considerations accompanying this value are: | ||
| + | ***volume of the system is 1 litre | ||
***growth medium: LB broth | ***growth medium: LB broth | ||
***Cultivation temperature: 37°C | ***Cultivation temperature: 37°C | ||
| Line 459: | Line 480: | ||
*Assume stationary growth phase. | *Assume stationary growth phase. | ||
*Assume that the amount of P(3HB) accumulated during the time course of simulation doesn't exceed the cell's capacity or ability to contain it. | *Assume that the amount of P(3HB) accumulated during the time course of simulation doesn't exceed the cell's capacity or ability to contain it. | ||
| + | *Assume that all initial concentrations of the species in metabolic pathways and the synthetic pathways are in a large population level. The concentrations are maintained by approximately 1.5x10<sup>12</sup>cells in a 1L broth, calculated from value obtained from BioNumbers. A range was given: 1-2x10<sup>9</sup> cells/ml, so 1.5x10<sup>9</sup> was taken. [http://bionumbers.hms.harvard.edu/bionumber.aspx?s=n&id=104831&ver=5] | ||
| - | <h4>Video: How to run a simulation in the metabolic model ( | + | <h4>Video: How to run a simulation in the metabolic model (please refresh if it's not here)</h4> |
<html> | <html> | ||
| - | <iframe width=" | + | <iframe width="600" height="480" src="//www.youtube.com/embed/m2ZJUA-yw34" frameborder="0" allowfullscreen></iframe> |
</html> | </html> | ||
<html> | <html> | ||
| Line 475: | Line 497: | ||
<div id="CollapsiblePanelMod3" class="CollapsiblePanel"> | <div id="CollapsiblePanelMod3" class="CollapsiblePanel"> | ||
| - | <div class="CollapsiblePanelTab" tabindex="0">< | + | <div class="CollapsiblePanelTab" tabindex="0"><h4>3.0 PLA Degradation Model</html><font size="1">▼</font size="1"><html></h4></div> |
<div class="CollapsiblePanelContent"> | <div class="CollapsiblePanelContent"> | ||
</html> | </html> | ||
<h4>Introduction</h4> | <h4>Introduction</h4> | ||
| - | + | ||
| - | The efficiency of Polylactic acid is important for the performance of MAPLE. Therefore, we chose a strong enzyme Proteinase K which is suggested by many literature as an efficient PLA degrading enzyme. We performed several assays in order to determine the kinetic properties of Proteinase K. The PLA degradation model was then built based on the experimental results. </p> | + | The efficiency of degrading Polylactic acid (PLA) is important for the performance of MAPLE. Therefore, we chose a strong enzyme Proteinase K which is suggested by many literature as an efficient PLA degrading enzyme. We performed several assays in order to determine the kinetic properties of Proteinase K. The PLA degradation model was then built based on the experimental results. </p> |
<h4>Objective and Design</h4> | <h4>Objective and Design</h4> | ||
| - | <p>1. With the defined kinetic properties of Proteinase K. The model can predict the time needed to degrade a certain amount of PLA. | + | <p>1. With the defined kinetic properties of Proteinase K. The model can predict the time needed to degrade a certain amount of PLA. It will produce useful information when degrading large amount of plastic. </p> |
| - | <p>2. The model also involves the gene expression model of the Proteinase K with an inducible promoter. | + | <p>2. The model also involves the gene expression model of the Proteinase K with an inducible promoter. Gene expression can be regulated by adjusting the inducer concentration. </p> |
| - | <p>3. | + | <p>3. A secretion module is contained in the model which assumes the efficiency of enzyme secretion to the culture. </p> |
| - | < | + | <h3>Specifications of the model</h3> |
<p align="justify">Polylactic acid (PLA) degradation involves proteinase K:</p> | <p align="justify">Polylactic acid (PLA) degradation involves proteinase K:</p> | ||
<table border="2" bgcolor="#efefef"> | <table border="2" bgcolor="#efefef"> | ||
| Line 562: | Line 584: | ||
<td>Initial: 0.008</td> | <td>Initial: 0.008</td> | ||
<td>mM</td> | <td>mM</td> | ||
| - | <td></td> | + | <td>-</td> |
| - | <td></td> | + | <td>-</td> |
</tr> | </tr> | ||
<tr> | <tr> | ||
| Line 611: | Line 633: | ||
[Polylactic acid]+[Proteinase K]= 660 [lactic acid] + [Proteinase K] | [Polylactic acid]+[Proteinase K]= 660 [lactic acid] + [Proteinase K] | ||
<p><b>Assumptions:</b></p> | <p><b>Assumptions:</b></p> | ||
| - | <p>We assumed 1 mole of polylactic acid can produce 660 moles of lactic acid. </p> | + | <p>1. We assumed 1 mole of polylactic acid can produce 660 moles of lactic acid. </p> |
| - | <p>The molecular weight of a single polylactic acid monomer is 90 g/mol [http://www.chemspider.com/Chemical-Structure.592.html]whereas the molecular weight of the solid polylactic acid is around 59500 g/mol.[http://www.sciencedirect.com/science/article/pii/S0014305711003582]Therefore, the short-chain polylactic acid consists approximately 660 monomers. 660 molecules of lactic acid will be produced by degrading one chain of polymer.</p> | + | <p>2. The molecular weight of a single polylactic acid monomer is 90 g/mol [http://www.chemspider.com/Chemical-Structure.592.html]whereas the molecular weight of the solid polylactic acid is around 59500 g/mol.[http://www.sciencedirect.com/science/article/pii/S0014305711003582]Therefore, the short-chain polylactic acid consists approximately 660 monomers. 660 molecules of lactic acid will be produced by degrading one chain of polymer.</p> |
| - | <p>We also assumed a simple Michaelis-Menten mechanism for proteinase K</p> | + | |
| - | [[File:MMPLA.png]] | + | <p>3. Assumed the polylactic acid only contains one length of chain, however in reality the plastic chain has a range of lengths.</p> |
| - | <p>"[Proteinase K]" here is the concentration of the enzyme Proteinase K in mM, whereas "[Polylactic acid]" represents the concentration of polylactic acid in mM | + | <p>4. Considerations of temperature change and PH change are not included in the model. Therefore, the assumption is that they remain constant during the degradation </p> |
| + | <p>5. We also assumed a simple Michaelis-Menten mechanism for proteinase K. </p> | ||
| + | [[File:MMPLA.png|400px|centre]] | ||
| + | <p>"[Proteinase K]" here is the concentration of the enzyme Proteinase K in mM, whereas "[Polylactic acid]" represents the concentration of polylactic acid in mM. </p> | ||
<p>The parameters for the kinetic equations are:</p> | <p>The parameters for the kinetic equations are:</p> | ||
<table border="2" bgcolor="#efefef"> | <table border="2" bgcolor="#efefef"> | ||
| Line 668: | Line 693: | ||
</table> | </table> | ||
<p><b>Derivation:</b>Turnover number (Kcat) = Vmax*Mw/[proteinase K] = 2348.4</p> | <p><b>Derivation:</b>Turnover number (Kcat) = Vmax*Mw/[proteinase K] = 2348.4</p> | ||
| + | |||
<p>The efficiency of <b>Secretion</b> is assumed to be 90% secretion over 2 hours.[http://www.ncbi.nlm.nih.gov/pmc/articles/PMC1251600/] The rate of secretion in the model is therefore:</p> | <p>The efficiency of <b>Secretion</b> is assumed to be 90% secretion over 2 hours.[http://www.ncbi.nlm.nih.gov/pmc/articles/PMC1251600/] The rate of secretion in the model is therefore:</p> | ||
<p>rate of secretion = 0.9[concentration of Proteinase K]/120 (mM/mins) </p> | <p>rate of secretion = 0.9[concentration of Proteinase K]/120 (mM/mins) </p> | ||
<h2>Simulations and Results</h2> | <h2>Simulations and Results</h2> | ||
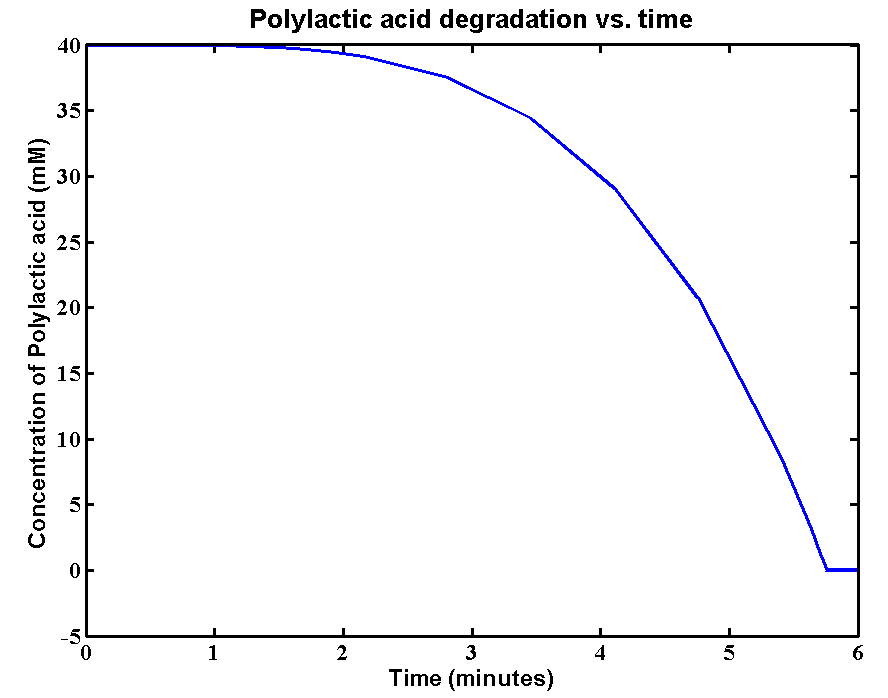
| - | <p>The initial concentration of Polylactic acid is 40mM, which can be converted to 2380g/L. The derivation is: 40*59500/1000 = 2380g/L. There is approximately 2kg of polylactic acid in the 1 litre bioreactor | + | <p>The initial concentration of Polylactic acid is 40mM, which can be converted to 2380g/L. The derivation is: 40*59500/1000 = 2380g/L. There is approximately 2kg of polylactic acid in the 1 litre bioreactor, which is a really large amount. <b>The simulation result is:</b></p> |
[[File:PLAD.png|600px|centre]] | [[File:PLAD.png|600px|centre]] | ||
| - | <p>The simulation | + | <p><b>Results and explanations:</b>The simulation shows a very fast degradation of large amount of polylactic acid by proteinase K. 2kg/L of the plastic can be completely degraded in 6 minutes. The reason for fast degradation is that we have relative large kinetic parameters for the enzyme. Polylactic acid was not used as the substrate in our kinetic assays. Therefore, we made an assumption that polylactic acid in the model has similar chain length as that of the substrate in the assays. In reality, the PLA plastic is in solid form which enzymes can only degrade the plastic from the surface. The efficiency of degradation will be massively reduced due the 3D geometry. A 3D model is needed for future improvements of plastic degradation. The kinetic data of degrading solid form of PLA also need to be defined. </p> |
<html> | <html> | ||
<h4>PLA degradation model:Download</h4> | <h4>PLA degradation model:Download</h4> | ||
| Line 683: | Line 709: | ||
</div> | </div> | ||
| - | + | ||
| - | + | ||
| - | + | ||
| - | + | ||
| - | + | ||
| - | + | ||
| - | + | ||
| - | + | ||
| - | + | ||
| - | + | ||
| - | + | ||
| - | + | ||
| - | + | ||
| - | + | ||
| - | + | ||
| - | + | ||
| - | + | ||
| - | + | ||
| - | + | ||
| - | + | ||
| - | + | ||
| - | + | ||
| - | + | ||
| - | + | ||
| - | + | ||
| - | + | ||
| - | + | ||
| - | + | ||
| - | + | ||
| - | + | ||
| - | + | ||
| - | + | ||
</div> | </div> | ||
| Line 720: | Line 715: | ||
<div id="CollapsiblePanel1" class="CollapsiblePanel"> | <div id="CollapsiblePanel1" class="CollapsiblePanel"> | ||
| - | <div class="CollapsiblePanelTab" tabindex="0">< | + | <div class="CollapsiblePanelTab" tabindex="0"><h4>Our chassis can grow with P(3HB) and 3HB</html><font size="1">▼</font size="1"><html></h4></div> |
<div class="CollapsiblePanelContent"></html> | <div class="CollapsiblePanelContent"></html> | ||
| Line 746: | Line 741: | ||
</div> | </div> | ||
<div id="CollapsiblePanel2" class="CollapsiblePanel"> | <div id="CollapsiblePanel2" class="CollapsiblePanel"> | ||
| - | <div class="CollapsiblePanelTab" tabindex="0">< | + | <div class="CollapsiblePanelTab" tabindex="0"><h4>Bioplastic degradation: Phaz1 enzymatic assays</html><font size="1">▼</font size="1"><html></h4></div> |
<div class="CollapsiblePanelContent"></html> | <div class="CollapsiblePanelContent"></html> | ||
<h2>Enzyme activity of PHB depolymerase (phaz1)</h2> | <h2>Enzyme activity of PHB depolymerase (phaz1)</h2> | ||
| Line 788: | Line 783: | ||
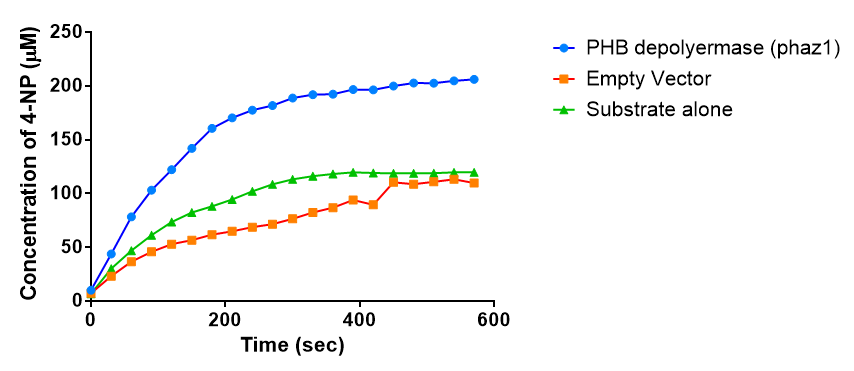
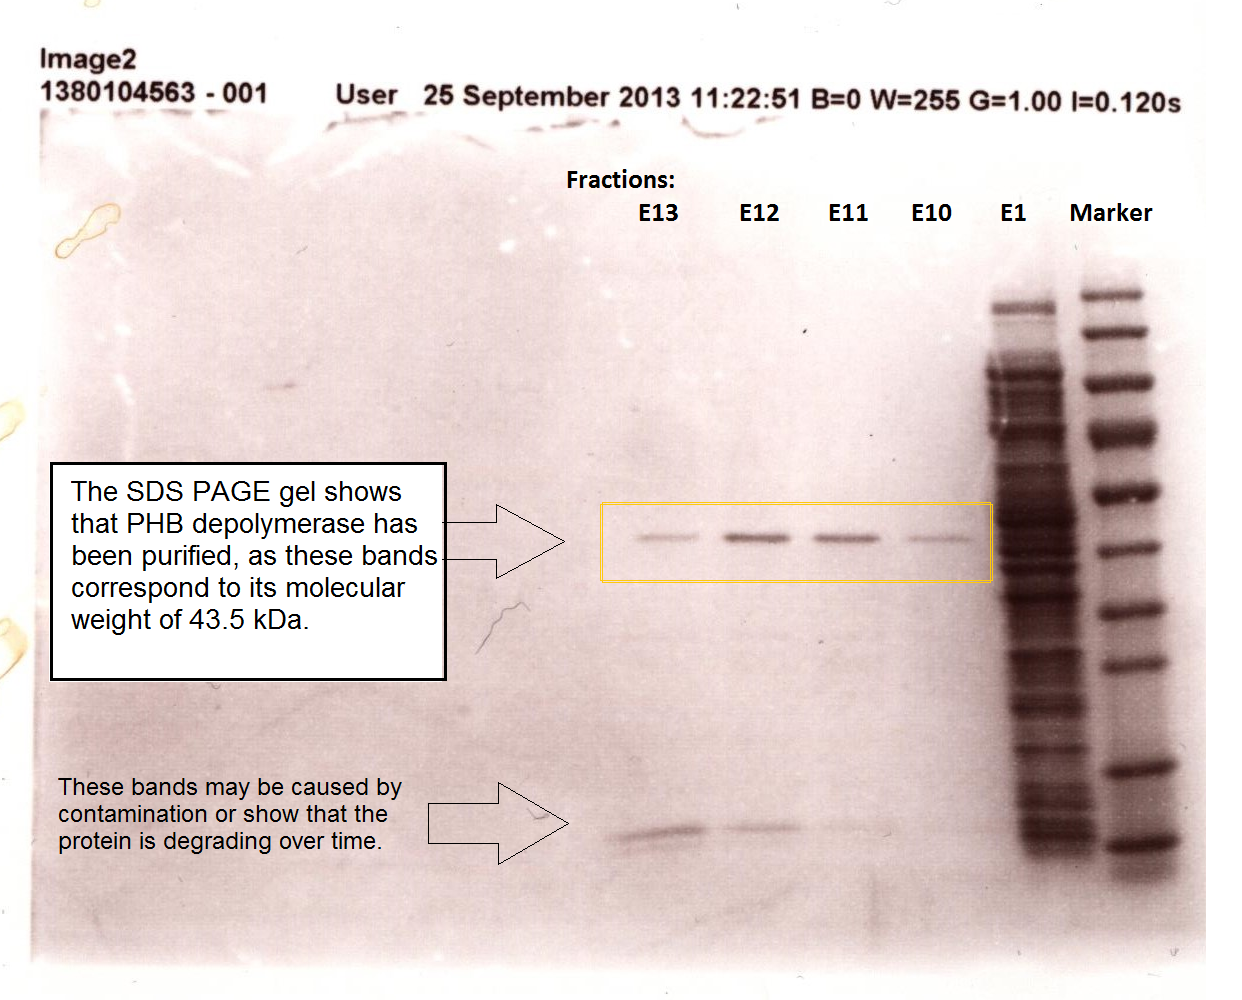
[[File:Phaz1sdspage.png|centre|thumbnail|800px|<b>SDS PAGE gel shows that PHB depolymerase was purified from the crude cell extract. Figure by Imperial College London 2013 iGEM</b>]] | [[File:Phaz1sdspage.png|centre|thumbnail|800px|<b>SDS PAGE gel shows that PHB depolymerase was purified from the crude cell extract. Figure by Imperial College London 2013 iGEM</b>]] | ||
| - | < | + | <h2>Michaelis-Menten kinetics of phaZ1 PHB depolymerase</h2> |
| + | |||
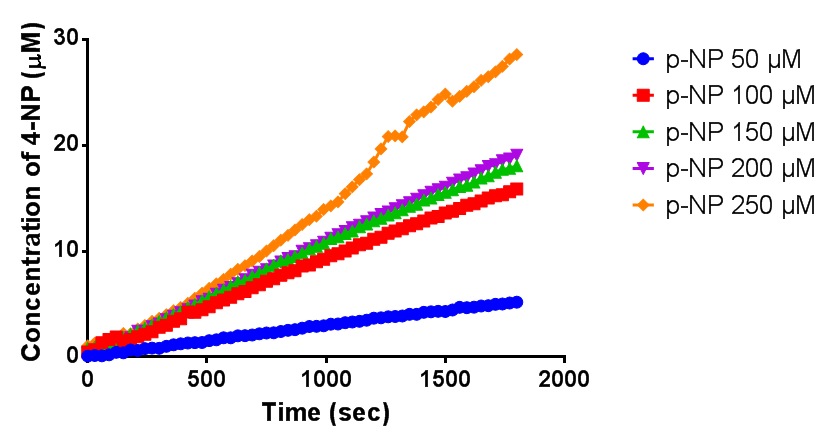
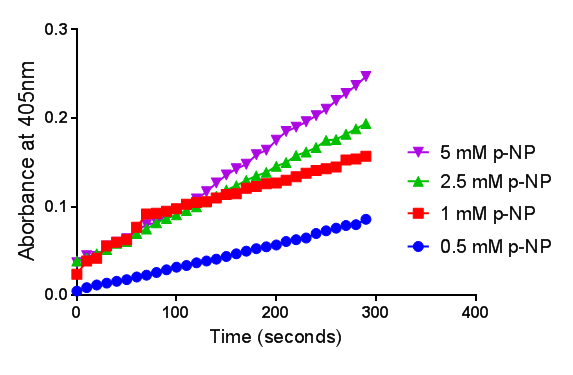
| + | To gain the kinetic parameters for our P(3HB) degradation model, purified phaZ1 PHB depolymerase was used in the same activity assay as described above. The para-Nitrophenyl butyrate substrate concentrations used were 0.5 mM,1.0 mM, 2.5 mM and 5.0 mM and 5 µL of purified PHB depolymerase (stock concentration 360 ng/µL). From these preliminary results and using graphpad, we have predicted the kinetic parameters to be a Vmax of 29.59 µM/s and a Km 1.56 mM. | ||
| + | |||
| + | [[File:Abs phaz1 2.png|left|400px||thumbnail|<b>The increase in absorbance that accompanies the cleavage of para-Nitrophenyl butyrate by PHB depolymerase (phaZ1). Figure by Imperial College London 2013 iGEM</b>]] | ||
| + | |||
| + | [[File:Conc phaz1 2.png|right|400px|thumbnail|<b>The concentrations of 4-Nitrophenol produced from the breakdown of para-Nitrophenyl butyrate by phaZ1 PHB depolyermase. Figure by Imperial College London 2013 iGEM</b>]] | ||
| + | |||
| + | [[File:MM phaz1.png|centre|800px|thumbnail|<b>Michaelis-Menten kinetic graph for phaZ1 PHB depolymerase. Figure by Imperial College London 2013 iGEM</b>]] | ||
| + | |||
| + | <br><br> | ||
</p> | </p> | ||
| Line 796: | Line 801: | ||
</div> | </div> | ||
<div id="CollapsiblePanel3" class="CollapsiblePanel"> | <div id="CollapsiblePanel3" class="CollapsiblePanel"> | ||
| - | <div class="CollapsiblePanelTab" tabindex="0">< | + | <div class="CollapsiblePanelTab" tabindex="0"><h4>Bioplastic degradation: Phaz1 degrades P(3HB)</html><font size="1">▼</font size="1"><html></h4></div> |
<div class="CollapsiblePanelContent"> | <div class="CollapsiblePanelContent"> | ||
</html> | </html> | ||
| - | < | + | <h2>Clearing Zone Assay</h2> |
Clearing zone experiment was conducted to semi-quantitatively test the ability of PhaZ1 to break down P3HB. PhaZ1 cell lysate was tested on a P3HB LB agar plate. The protocol can be found [https://2013.igem.org/Team:Imperial_College/Protocols#Clear_zone_assay here]. | Clearing zone experiment was conducted to semi-quantitatively test the ability of PhaZ1 to break down P3HB. PhaZ1 cell lysate was tested on a P3HB LB agar plate. The protocol can be found [https://2013.igem.org/Team:Imperial_College/Protocols#Clear_zone_assay here]. | ||
| - | [[File:Imperial_clearing_zone.jpg|thumbnail|centre|950px|<font size="2.7"><b>PhaZ1 showing P3HB degradation ability by generating a clear zone on a P3HB LB agar plate. A. No difference between empty vector cell lysate and PhaZ1 cell lysate right after they were pipetted into the wells. B. PhaZ1 in the cell lysate started to clear P3HB around the well after 1 day. C. PhaZ1 created a clear zone around the well after 3 days, whereas it was still cloudy around the empty vector cell lysate well.</b>]] | + | [[File:Imperial_clearing_zone.jpg|thumbnail|centre|950px|<font size="2.7"><b>PhaZ1 showing P3HB degradation ability by generating a clear zone on a P3HB LB agar plate. A. No difference between empty vector cell lysate and PhaZ1 cell lysate right after they were pipetted into the wells. B. PhaZ1 in the cell lysate started to clear P3HB around the well after 1 day. C. PhaZ1 created a clear zone around the well after 3 days, whereas it was still cloudy around the empty vector cell lysate well. Figure by Imperial College London 2013 iGEM</b>]] |
| + | <h2>3HB assay</h2> | ||
| + | <p>In order to show that phaZ1 is functional, we have measured the amount of 3HB monomers produced due to the degradation of the polymer, when incubated with the enzyme. We have repurposed a 3HB colorimetric assay kit that is used for 3HB detection from animal tissue and bodily fluid samples. Please see the [https://2013.igem.org/Team:Imperial_College/ | ||
| + | Protocols#3HB_assay protocol] and the [https://2013.igem.org/Team:Imperial_College/3HB_assay data] sections for details.</p> | ||
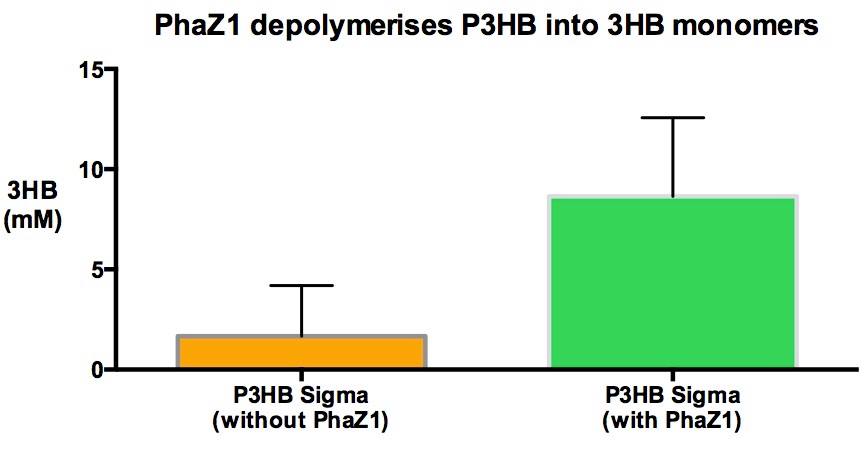
| - | + | [[File:Phaz1_degrade_so3hb.png|thumbnail|centre|600px|<font size="2.7"><b>PhaZ1 treatment of P3HB sample increases the amount of 3HB monomer going into sulution. Both of the sample were incubated at 37°C sahking for 15 hours. </b>]] | |
| - | < | + | |
| - | <p>We do expect to see some background 3HB | + | <p>It is clear from our results that enzyme treatment produces a lot more 3HB than the control. We do expect to see some background 3HB from the untreated sample since it was in the shaking incubator at 37°C in the Buffer solution. PHB is a bioplastic and degrades spontaneously as well as enzymatically. However, the spontaneous degradation occurs slowly. </p> |
| - | + | ||
| - | + | ||
| - | + | ||
| - | + | ||
| - | + | ||
| - | + | ||
| - | + | ||
| Line 827: | Line 827: | ||
</div> | </div> | ||
<div id="CollapsiblePanel4" class="CollapsiblePanel"> | <div id="CollapsiblePanel4" class="CollapsiblePanel"> | ||
| - | <div class="CollapsiblePanelTab" tabindex="0">< | + | <div class="CollapsiblePanelTab" tabindex="0"><h4>Our chassis can utilise 3HB</html><font size="1">▼</font size="1"><html></h4></div> |
<div class="CollapsiblePanelContent"></html> | <div class="CollapsiblePanelContent"></html> | ||
<h3>bdh2 improves growth on 3HB</h3> | <h3>bdh2 improves growth on 3HB</h3> | ||
| Line 852: | Line 852: | ||
</div> | </div> | ||
<div id="CollapsiblePanel5" class="CollapsiblePanel"> | <div id="CollapsiblePanel5" class="CollapsiblePanel"> | ||
| - | <div class="CollapsiblePanelTab" tabindex="0">< | + | <div class="CollapsiblePanelTab" tabindex="0"><h4>Completing the cycle</html><font size="1">▼</font size="1"><html></h4></div> |
| - | <div class="CollapsiblePanelContent"> | + | <div class="CollapsiblePanelContent"> </html> |
<h4>We can degrade the PHB made by our own bacteria</h4> | <h4>We can degrade the PHB made by our own bacteria</h4> | ||
| - | |||
| - | |||
| - | |||
| - | |||
| - | |||
| - | https:// | + | <p>With this experiment, we demonstrate that the [https://2013.igem.org/Team:Imperial_College/PHB_production material that we purified in various experiments] is Poly-Hydroxy-Butyrate bioplastc. One of the samples analysed was extracted from bacteria growing on waste, therefore <b>we made PHB bioplastic directly from waste.</b></p> |
| + | <p><b>We can close the loop and degrade our own bioplastic, with our own enzyme, [http://parts.igem.org/Part:BBa_K1149010 PhaZ1].</b></p> | ||
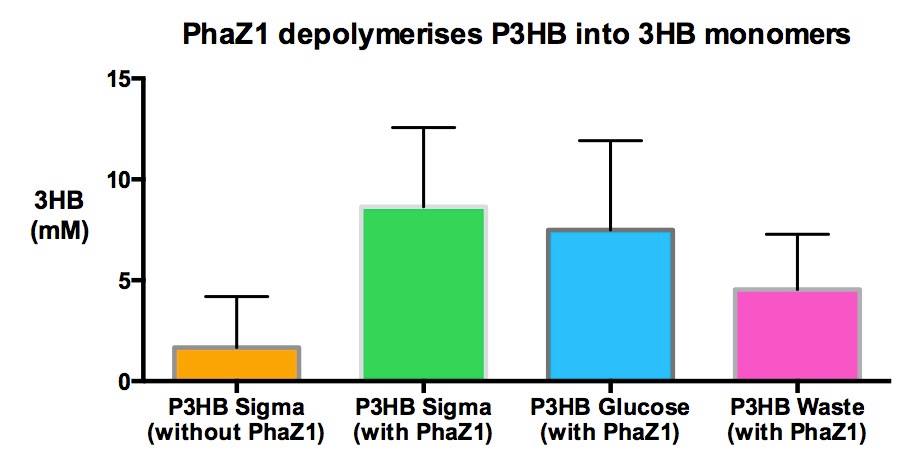
| - | < | + | [[File:Imperial_P3HB_from_waste.jpg|thumbnail|centre|600px|<font size="2.7"><b>The bioplastic produced by our bacteria contains PHB and can be broken down into monomers by PhaZ1 enzyme (expressed by our bacteria)</b>]] |
| + | |||
| + | <p> The amount of 3HB monomers freed from the polymer is more in case of all PhZ1 treated samples, than the untreated sample. There is less 3HB produced from the samples that were purified from bacteria than from the pure polymer, purchased from Sigma. This could be because I put less amount in the assay to start with, because there was less available. I put about a 0.01-0.03 g of our own and 0.5 grams of Sigma-PHB.</p> | ||
| + | <p> Please see our [https://2013.igem.org/Team:Imperial_College/Protocols#3HB_assay protocols] and [https://2013.igem.org/Team:Imperial_College/3HB_assay data] pages for methods and details of the data. | ||
| + | <html> | ||
</div> | </div> | ||
</div> | </div> | ||
<div id="CollapsiblePanel6" class="CollapsiblePanel"> | <div id="CollapsiblePanel6" class="CollapsiblePanel"> | ||
| - | <div class="CollapsiblePanelTab" tabindex="0">< | + | <div class="CollapsiblePanelTab" tabindex="0"><h4>Bioplastic degradation: Proteinase K enzymatic assays</html><font size="1">▼</font size="1"><html></h4></div> |
<div class="CollapsiblePanelContent"> | <div class="CollapsiblePanelContent"> | ||
| Line 875: | Line 875: | ||
<h2>Proteinase K kinetic activity</h2> | <h2>Proteinase K kinetic activity</h2> | ||
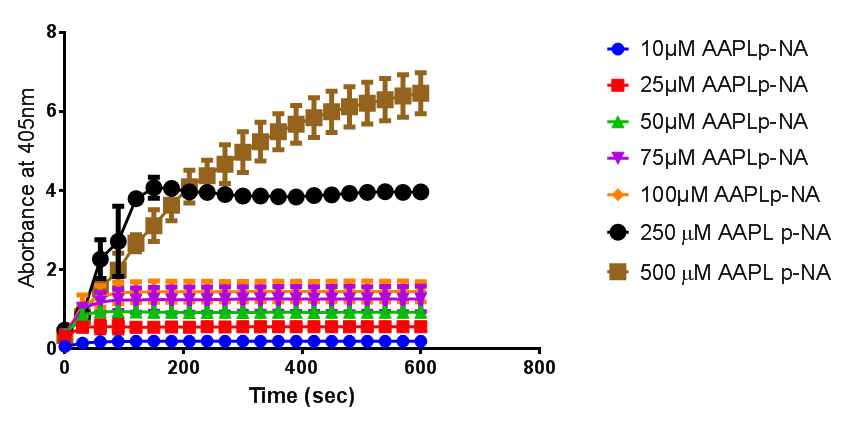
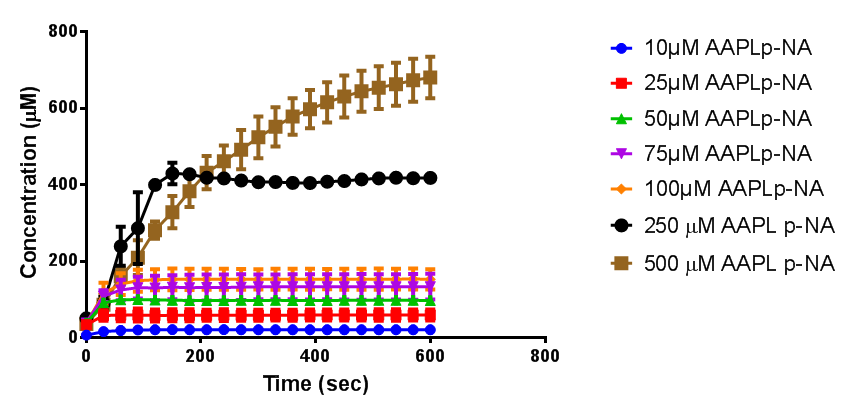
| - | + | According to the literature, protease K breaks down poly L-lactic acid as well as fibrous proteins, such as silk fibroin. In the active site of proteinase K is a catalytic triad containing serine, histidine and aspartic acid. L-lactic acid is analogous to L-alanine. Poly L-lactic acid, therefore, can bind to and be catalysed by the catalytic triad, as it mimics silk fibroin which is rich with L-alanine residues. Proteinase K cannot catalyse the breakdown of poly D-lactic acid, because the catalytic triad will not accommodate it. [http://www.sciencedirect.com/science/article/pii/S014139101100142X] [http://www.biomedcentral.com/1472-6750/7/16]</p> | |
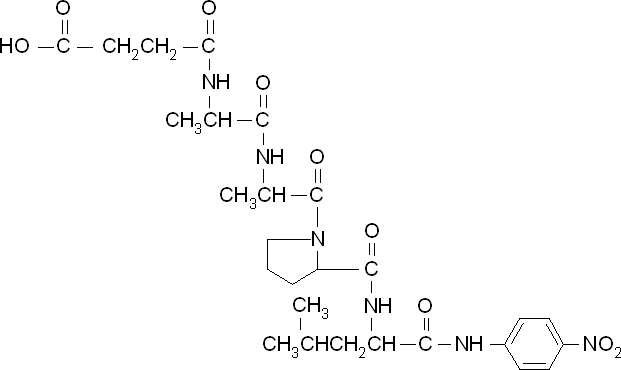
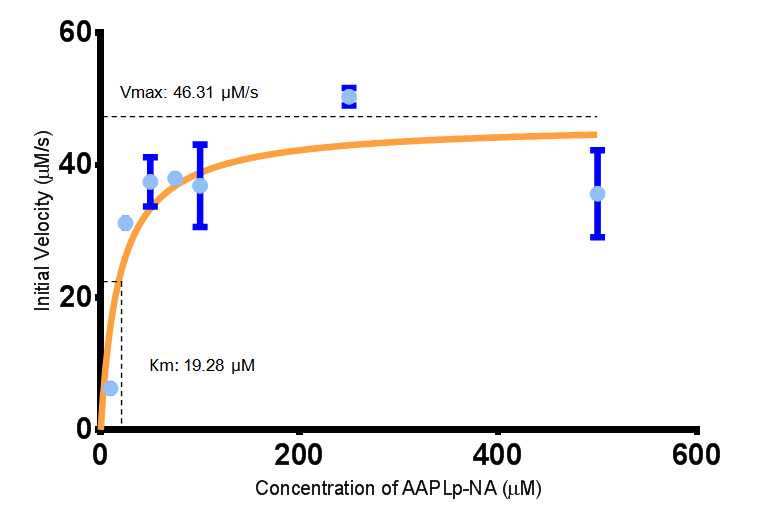
<p align="justify">To obtain parameters to use in our <b>PLA degradation model</b> that kinetic activity of proteinase K was measured with a substrate analogue, N-succinyl Ala-Ala-Pro-Leu p-nitroanilide (AAPL p-NA). Cleavage of AAPL p-NA releases 4-nitroaniline (4-NA), which can be recorded by an increase in absorbance at wavelength 405nm. For this assay, [http://www.sigmaaldrich.com/catalog/product/sial/p2308?lang=en®ion=GB proteinase K] and [http://www.sigmaaldrich.com/catalog/product/sigma/s8511?lang=en®ion=GB AAPL p-NA] were purchased from Sigma.</p> | <p align="justify">To obtain parameters to use in our <b>PLA degradation model</b> that kinetic activity of proteinase K was measured with a substrate analogue, N-succinyl Ala-Ala-Pro-Leu p-nitroanilide (AAPL p-NA). Cleavage of AAPL p-NA releases 4-nitroaniline (4-NA), which can be recorded by an increase in absorbance at wavelength 405nm. For this assay, [http://www.sigmaaldrich.com/catalog/product/sial/p2308?lang=en®ion=GB proteinase K] and [http://www.sigmaaldrich.com/catalog/product/sigma/s8511?lang=en®ion=GB AAPL p-NA] were purchased from Sigma.</p> | ||
| Line 890: | Line 890: | ||
[[File:PK_MM_graph.png|centre|thumbnail|900px|<b>Michaelis-Menten plot for proteinase K activity cleaving AAPLp-NA at 37ºC and pH 7.4. Figure by Imperial College London 2013 iGEM</b>]] | [[File:PK_MM_graph.png|centre|thumbnail|900px|<b>Michaelis-Menten plot for proteinase K activity cleaving AAPLp-NA at 37ºC and pH 7.4. Figure by Imperial College London 2013 iGEM</b>]] | ||
| - | |||
| - | |||
| - | |||
<html> | <html> | ||
| Line 899: | Line 896: | ||
<div id="CollapsiblePanel10" class="CollapsiblePanel"> | <div id="CollapsiblePanel10" class="CollapsiblePanel"> | ||
| - | <div class="CollapsiblePanelTab" tabindex="0">< | + | <div class="CollapsiblePanelTab" tabindex="0"><h4>Bioplastic degradation: Proteinase K degrades PLA</html><font size="1">▼</font size="1"><html></h4></div> |
<div class="CollapsiblePanelContent"></html> | <div class="CollapsiblePanelContent"></html> | ||
<h3>Proteinase K degrades PLA cup</h3> | <h3>Proteinase K degrades PLA cup</h3> | ||
| - | + | Our bacteria are capable of growing on lactic acid, however the substance is toxic and results in a pronounced lag phase before growth commences: | |
| - | [[File:ProteinaseK_degrades_PLA.jpg| | + | [[File:L-LActic_Acid.png|thumbnail|center|450px|L-lactic acid in LB with Stress Response cells. MG1655 cells were grown on 0 mM and 5 mM L-Lactic Acid. Lactic acid is a byproduct of polylactic acid degradation, a key component to our project. Cells grown in 5mM L-lactic acid show a pronounced lag phase before commencing log growth. Growth was at 37°C with shaking over 6h. Error bars are SEM, n=4. Figure made by Imperial College London 2013 iGEM.]] |
| + | |||
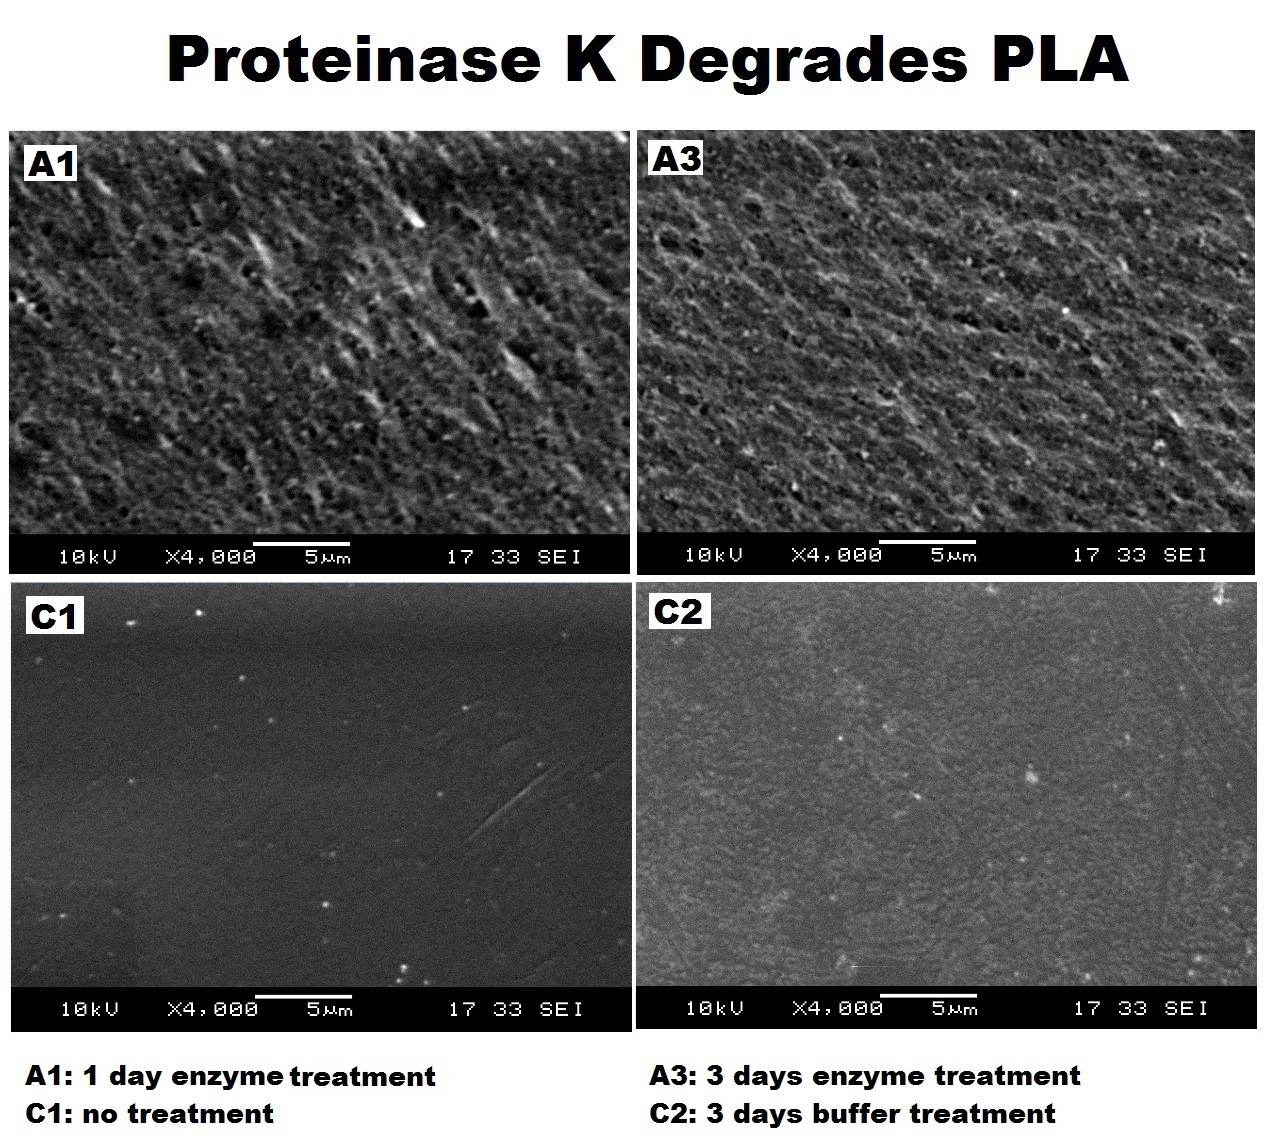
| + | We have demonstrated that Proteinase K can degrade PLA. The below images are Scanning electron micrographs from the surface of a PLA cup after incubation with the enzyme. Please see our [https://2013.igem.org/Team:Imperial_College/Electron_microscopy SEM data page] for full description of expreiment and all SEM images. | ||
| + | |||
| + | [[File:ProteinaseK_degrades_PLA.jpg|center|thumbnail|900px|<b>Increased surface pitting and roughness indicated degradation of PLA surface after enzyme treatment. Figure by Imperial College London 2013 iGEM</b>]] | ||
<html> | <html> | ||
| Line 911: | Line 912: | ||
</div> | </div> | ||
<div id="CollapsiblePanel7" class="CollapsiblePanel"> | <div id="CollapsiblePanel7" class="CollapsiblePanel"> | ||
| - | <div class="CollapsiblePanelTab" tabindex="0">< | + | <div class="CollapsiblePanelTab" tabindex="0"><h4>References</html><font size="1">▼</font size="1"><html></h4></div> |
| - | <div class="CollapsiblePanelContent"> | + | <div class="CollapsiblePanelContent"><h5>Papers Referenced</h5> |
| + | <ol class="reference"> | ||
| + | <li>ANDERSON A, DAWES E. <cite>Occurrence, Metabolism, Metabolic Role, and Industrial Uses of Bacterial Polyhydroxyalkanoates.</cite> Microbiol Rev 1990 DEC;54(4):450-472.</li> | ||
| + | <li>Harding KG, Dennis JS, von Blottnitz H, Harrison STL. <cite>Environmental analysis of plastic production processes: Comparing petroleum-based polypropylene and polyethylene with biologically-based poly-beta-hydroxybutyric acid using life cycle analysis.</cite> J Biotechnol 2007 MAY 31;130(1):57-66.</li> | ||
| + | <li>Kim S, Dale BE. <cite>Energy and Greenhouse Gas Profiles of Polyhydroxybutyrates Derived from Corn Grain: A Life Cycle Perspective.</cite> Environ Sci Technol 2008 OCT 15;42(20):7690-7695.</li> | ||
| + | <li>Jendrossek D, Handrick R. <cite>Microbial degradation of polyhydroxyalkanoates.</cite> Annu Rev Microbiol 2002;56:403-432.</li> | ||
| + | <li>Philip S, Keshavarz T, Roy I. <cite>Polyhydroxyalkanoates: biodegradable polymers with a range of applications.</cite> Journal of Chemical Technology and Biotechnology 2007 MAR;82(3):233-247.</li> | ||
| + | <li>Thomas C. Bruice , Thomas H. Fife , John J. Bruno , Patricia. Benkovic<cite>Hydroxyl Group (V)1 and Imidazole (X)2 Catalysis. The General Base Catalysis of Ester Hydrolysis by Imidazole and the Influence of a Neighboring Hydroxyl Group.</cite> J. Am. Chem. Soc., 1962, 84 (15), pp 3012–3018</li> | ||
| + | <li>Fusako Kawai, Kosuke Nakadai, Emiko Niskioka, Hajime Nakajima, Hitomi Ohara, Kazao Masaki, Haruyaki Lefuji.<cite>Different enantioselectivity of two types of poly (lactic acid) depolymerases toward poly (L-lactic acid) and poly (D-lactic acid).</cite>Polymer Degradation and Stability Volume 96, Issue 7, July 2011, Pages 1342–1348</li> | ||
| + | <li>Jun Liao, Manfred K Warmuth, Sridhar Govindarajan, Jon E Ness, Rebecca P Wang, Claes Gustafsson, Jeremy Minshull<cite>Engineering proteinase K using machine learning and synthetic genes.</cite>BMC Biotechnology 2007, 7:16 doi:10.1186/1472-6750-7-16</li> | ||
| + | |||
| + | </ol></div> | ||
| + | |||
</div> | </div> | ||
| + | |||
<div id="CollapsiblePanel8" class="CollapsiblePanel"> | <div id="CollapsiblePanel8" class="CollapsiblePanel"> | ||
| - | <div class="CollapsiblePanelTab" tabindex="0">< | + | <div class="CollapsiblePanelTab" tabindex="0"><h4>Protocols</html><font size="1">▼</font size="1"><html></h4></div> |
| - | <div class="CollapsiblePanelContent"> | + | <div class="CollapsiblePanelContent"><h4>Clearing zone assay</h4> |
| + | <ol> | ||
| + | <li>Prepare 10 ml cell culture and induce phaZ1 expression using 2% xylose media. </li> | ||
| + | <li>Centrifuge the cell cultures at 4500 RCF (equivalent to 6221g) for 20 minutes at 4°C.</li> | ||
| + | <li>Add 2 ml of 50mM Tris buffer (pH 7.4) to the pellet and mix well by vortexing the tube. </li> | ||
| + | <li>Transfer the buffered pellet into 7ml tubes and keep the samples on ice.</li> | ||
| + | <li>Perform probe sonication with 2-minute cycles of 2 seconds on, 2 seconds off, at 60% amplitude. Keep the sample on ice while sonicating.</li> | ||
| + | <li>Centrifuge the samples again at 4000 g for 10 minutes and extract the supernatant, in order to separate cell debris and proteins.</li> | ||
| + | <li>Each cuvette contains 700 ul of 0.5 mg/ml PHB emulsion and 300 ul of cell lysate. Use the 50mM Tris buffer as blank.</li> | ||
| + | <li>Measure the absorbance at OD650 every 24 hours. </li> | ||
| + | |||
| + | <li>Mix 0.5g of P3HB powder with 300 ml LB agar, make P3HB plates.</li> | ||
| + | <li>Use sterilised pipette tip to cut two wells, each has a 0.5 mm diameter. </li> | ||
| + | <li>Pipette 200ul of PhaZ1 cell lysate sample in one of the wells, and same amount of empty vector cell lysate sample in the other well.</li> | ||
| + | <li>Observe the plate every 24 hours.</li> | ||
| + | </ol> | ||
| + | |||
| + | |||
| + | <h4>Protein purification by metal affinity chromatography</h4> | ||
| + | <ol> | ||
| + | <li><b>Preparation:</b></li> | ||
| + | 10 mL cultures were incubated overnight. These were diluted in 500 mL the next morning and incubated until the OD reached 0.5-0.6. The cultures were then induced with 6mM arabinose or 2% xylose (final concentration)and left overnight. The cells were then pelleted by centrifugation, 4,000 rpm for 10 minutes and kept in a -80ºC freezer. | ||
| + | |||
| + | <br><li><b>Cell lysis</b></li> | ||
| + | The frozen pellets were allowed to thaw and resuspended in 10 mL of Tris-HCl binding buffer. The cells were lysed by probe-sonication at 60% amplitude with 2 minute cycles of 2 seconds on, 2 seconds off. The samples were kept on ice throughout the sonication process. The cell debris was pelleted by spinning and the supernatant removed for purification. | ||
| + | |||
| + | <br><li><b>Purification with a Ni-NTA column:</b></li> | ||
| + | The column was washed with Buffer A (10 mM imidazole, 40 mM Tris pH 8, and 400 mM NaCl) to equilibrate the resin. The samples are added and the column is washed with Buffer A, and then eluted with increasing concentrations of Buffer B (500 mM imidazole, 40 mM Tris pH 8 and 400 mM NaCl). | ||
| + | |||
| + | <br><li><b>SDS PAGE:</b></li> | ||
| + | Samples were prepared for SDS PAGE by adding 7 µL of SDS running buffer to 20 µL of the fractions of interest. 8-20 µL of each sample were run on a polyacrylamide gel against a molecular weight marker. | ||
| + | |||
| + | <br><li><b>Concentration:</b></li> | ||
| + | PHB depolymerase (phaZ 1) and PUR esterase (EstC2) were concentrated with 10 mM potassium phosphate buffer. | ||
| + | |||
| + | <h2>Proteinase K kinetic activity assay</h2> | ||
| + | |||
| + | <ol> | ||
| + | <li><b>Tris-HCl buffer ingredients:</b></li> | ||
| + | 1 litre of millicule water | ||
| + | 10.5 g of NaCl (180 mM) | ||
| + | 0.65 g of CaCl2 (5 mM) | ||
| + | 1.7g of imidazole (25 mM) | ||
| + | 6 g of Tris base (50 mM) | ||
| + | Add HCl to bring the pH to 7.4 | ||
| + | |||
| + | <br><li><b>Programme the spectrometer:</b></li> | ||
| + | Cuvette: 10 mm | ||
| + | Wavelength: 405 nm | ||
| + | Temperature: 37°C | ||
| + | Measuring time: 10:00 min:sec | ||
| + | Delay: 00:00 min:sec | ||
| + | Interval: 00:30 min:sec | ||
| + | |||
| + | <br><li><b>Reagent preparation:</b></li> | ||
| + | Lyophilized powder proteinase K from Tritirachium album from Sigma-Aldrich was used, made into a 10 mg/ml stock solution with the buffer. The spectrometer was blanked with 1mL of buffer and 3 µL of proteinase K stock solution; this is equivalent to one unit of enzyme. | ||
| + | |||
| + | We used N-Succinyl Ala-Ala-Pro-Leu p-nitroanilide (AAPLp-NA) from Sigma-Aldrich as a substrate analog. Make a stock solution with buffer (10 mg/ml). The reagents were incubated at 37°C just before use. | ||
| + | |||
| + | The absorbance of each reaction mixture was measured at 405 nm, for 10 minutes at 30 second intervals. The reaction mixtures contained 3 µL of proteinase K stock solution and AAPLp-NA in Tris-HCl buffer to make final concentrations of 10 µM, 25 µM, 50 µM, 75 µM, 100 µM, 250 µM and 500 µM.</div> | ||
<html> | <html> | ||
</div> | </div> | ||
<div id="CollapsiblePanel9" class="CollapsiblePanel"> | <div id="CollapsiblePanel9" class="CollapsiblePanel"> | ||
| - | <div class="CollapsiblePanelTab" tabindex="0">< | + | <div class="CollapsiblePanelTab" tabindex="0"><h4>MSDS</html><font size="1">▼</font size="1"><html></h4></div> |
<div class="CollapsiblePanelContent"></html> | <div class="CollapsiblePanelContent"></html> | ||
| Line 931: | Line 1,004: | ||
<p> 5. [http://www.sigmaaldrich.com/MSDS/MSDS/DisplayMSDSPage.do?country=GB&language=en&productNumber=A8509&brand=ALDRICH&PageToGoToURL=http%3A%2F%2Fwww.sigmaaldrich.com%2Fcatalog%2Fproduct%2Faldrich%2Fa8509%3Flang%3Den Acetoacetate].</p><html> | <p> 5. [http://www.sigmaaldrich.com/MSDS/MSDS/DisplayMSDSPage.do?country=GB&language=en&productNumber=A8509&brand=ALDRICH&PageToGoToURL=http%3A%2F%2Fwww.sigmaaldrich.com%2Fcatalog%2Fproduct%2Faldrich%2Fa8509%3Flang%3Den Acetoacetate].</p><html> | ||
| - | + | ||
| - | + | ||
| - | + | ||
| - | + | ||
| - | + | ||
| - | + | ||
| - | + | ||
| - | + | ||
| - | + | ||
| - | + | ||
| - | + | ||
</div></html> | </div></html> | ||
<html> | <html> | ||
| Line 958: | Line 1,021: | ||
This construct will be a substitute for [http://parts.igem.org/Part:BBa_K1149010 BBa_K1149010] and [http://parts.igem.org/Part:BBa_K1149008 BBa_K1149008] biobricks which are the PHB depolymerase PhaZ1 and ProteinaseK with the pelB seretion tag. | This construct will be a substitute for [http://parts.igem.org/Part:BBa_K1149010 BBa_K1149010] and [http://parts.igem.org/Part:BBa_K1149008 BBa_K1149008] biobricks which are the PHB depolymerase PhaZ1 and ProteinaseK with the pelB seretion tag. | ||
| - | |||
| - | |||
| - | |||
| - | |||
| - | |||
| - | |||
<b class="clear">Proteinase K activity</b> | <b class="clear">Proteinase K activity</b> | ||
| - | <p>The Western Blot results show that proteinase K was expressed, however, no activity was detected in a cell | + | <p>The Western Blot results show that proteinase K was expressed, however, no activity was detected in a cell lysate assay and no proteinase K could be purified from the cells. The proteinase K cultures were induced overnight with 6 mM (final concentration) of arabinose. According to the literature, proteinase K self-digests [http://www.biomedcentral.com/1472-6750/7/16 (8)]. Perhaps the induction strength and time was too long. Next time we will reduce the time and concentration of induction for proteinase K.</p> |
<html> | <html> | ||
</div> | </div> | ||
| Line 976: | Line 1,033: | ||
var CollapsiblePanelMod2 = new Spry.Widget.CollapsiblePanel("CollapsiblePanelMod2", {contentIsOpen:false}); | var CollapsiblePanelMod2 = new Spry.Widget.CollapsiblePanel("CollapsiblePanelMod2", {contentIsOpen:false}); | ||
var CollapsiblePanelMod3 = new Spry.Widget.CollapsiblePanel("CollapsiblePanelMod3", {contentIsOpen:false}); | var CollapsiblePanelMod3 = new Spry.Widget.CollapsiblePanel("CollapsiblePanelMod3", {contentIsOpen:false}); | ||
| - | |||
| - | |||
| - | |||
| - | |||
| - | |||
| - | |||
| - | |||
var CollapsiblePanel1 = new Spry.Widget.CollapsiblePanel("CollapsiblePanel1", {contentIsOpen:false}); | var CollapsiblePanel1 = new Spry.Widget.CollapsiblePanel("CollapsiblePanel1", {contentIsOpen:false}); | ||
var CollapsiblePanel2 = new Spry.Widget.CollapsiblePanel("CollapsiblePanel2", {contentIsOpen:false}); | var CollapsiblePanel2 = new Spry.Widget.CollapsiblePanel("CollapsiblePanel2", {contentIsOpen:false}); | ||
| Line 997: | Line 1,047: | ||
var CollapsiblePanel13 = new Spry.Widget.CollapsiblePanel("CollapsiblePanel13", {contentIsOpen:false}); | var CollapsiblePanel13 = new Spry.Widget.CollapsiblePanel("CollapsiblePanel13", {contentIsOpen:false}); | ||
var CollapsiblePanel14 = new Spry.Widget.CollapsiblePanel("CollapsiblePanel14", {contentIsOpen:false}); | var CollapsiblePanel14 = new Spry.Widget.CollapsiblePanel("CollapsiblePanel14", {contentIsOpen:false}); | ||
| + | var CollapsiblePanel14 = new Spry.Widget.CollapsiblePanel("CollapsiblePanel15", {contentIsOpen:false}); | ||
</script> | </script> | ||
<html> | <html> | ||
Latest revision as of 03:55, 29 October 2013
Module 2: Plastic Fantastic
Plastic Fantastic is a complete P(3HB) bioplastic recycling platform, where P(3HB) is degraded into monomeric form and then re-polymerised back into de novo P(3HB) for future applications.
Overview
Specifications
Design
Modelling
Testing & results
Future work
Overview

We have developed a system by which PHB can be recycled when products made from it come to the end of their life. In order to do this, we have engineered E.coli to break down P3HB extracellularly to release the monomers of 3-hydroxybutyrate (3-HB). We have designed the metabolic connection between P3HB degradation and synthesis so that 3-HB can be used as a carbon source. We are testing a putative 3-HB permease to increase the rate of uptake of the molecule into the cell. An intracellular 3-HB dehydrogenase will then form acetoacetate from 3-HB which the cell can utilise. We have thoroughly characterised the phaZ1 PHB depolymerase enzyme and demonstrated that it degrades PHB. Our models predict that use of the enzyme on a bioreactor scale will be effective in degrading bioplastic.
We are also establishing a second bioplastic recycling platform for polylactic acid (PLA)
This aspect of our module is in collaboration with the Yale iGEM team.
Yale are working to biologically synthesise PLA. We have designed E.coli to secrete proteinase K to form lactic acid monomers, forming half of a second bioplastic recycling system. Lactic acid is used in the chemical synthesis of PLA and so this system could also be implemented in an industrial setting.
Specification
Degradation of P(3HB)
Our bacteria should resist any toxic effects that are associated with P(3HB) or 3HB
Our bacteria should secrete a functional (P3HB) degrading enzyme
Synthesis of P(3HB)
Our bacteria should take up and internalise 3HB from the surrounding media
Our bacteria should be able to utilise P(3HB) as a sole carbon source
Degradation of PLA
Our bacteria should secrete a functional PLA degrading enzyme
Our bacteria should be tolerant to lactic acid
P(3HB) Degradation: Pathway▼
P(3HB) Degradation: Biobrick design▼
[http://parts.igem.org/Part:BBa_K1149010 BBa_K1149010]: Extracellular expression of phaZ1, PHB depolymerase enzyme. The construct design incorporates the RBS 0034 and is regulated by a strong xylose-inducible promoter [http://parts.igem.org/Part:BBa_I741018 BBa_I741018]. For extracellular secretion, we fused pelB secretion tag [http://parts.igem.org/Part:BBa_J32015 BBa_J32015] to the N terminus of the protein.

There are many strategies for secretion in E.coli and you can read about these on our Secretion Guide page and find the corresponding biobricks and iGEM projects. If you are currently in the process of designing a Genetically Engineered Machine and aim to secrete a protein in E.coli, this page provides a good starting point to look for information.
Synthesis of P(3HB) from 3HB: Pathway▼
For the Plastic Fantastic recycling module, we designed a modifications to the PHB synthesis pathway of the Resourceful Waste module. The additional steps connect 3-Hydroxy-Butyrate to the downstream metabolite of the synthesis: acetoacetyl-CoA where from the next two steps are carried out by phaB and phaA enzymes, as described in Module1. This pathway contains both new enzymes that we are introducing to E.coli and also endogenous enzymes, such as AtoA/D. Because of this, the pathway is in connection with the cells normal metabolism and our models were of great use for predicting the flux through the pathway and informing the design.
Synthesis of P(3HB) from 3HB: Biobrick design▼
3HB Permease:
For 3HB import, we designed a biobrick for the expression of a Putative permease, found in the literature [http://www.ncbi.nlm.nih.gov/nuccore/AB330992(1)]. We optimised the sequence for E.coli and planned experiments with the construct.
Construct for bdh2 dehydrogenase expression
[http://parts.igem.org/Part:BBa_K1149050 BBa_K1149050]: Intracellular expression of bdh2, 3HB dehydrogenase enzyme. We have used a strong arabinose inducible promoter [http://parts.igem.org/Part:BBa_K206000 BBa_K206000] in front of the operon for controlled expression of the enzyme; this enzyme is only required by the cell if 3HB is present. We have included superfolder GFP [http://parts.igem.org/Part:BBa_K515005 BBa_K515005] in the operon with phaZ1 so that we can monitor gene expression from the promoter via fluorescence measurements. (see our corresponding data under results)

http://www.igem.org/wiki/images/f/f0/Reaction_bdh.jpg
PLA degradation: pathway and biobrick design▼
Poly(lactic acid) (PLA) depolymerases are categorized into protease-type and lipase-type (7). We examined the literature and found sequences for one enzyme from each type.
Protease-type
- Proteinase K sequence from Tritirachium album, hydrolyzes poly(L-lactic acid) (PLLA) only.
Lipase-type
- Cutinase-like enzyme (CLE) sequence from Cryptococcus sp. strain S-2 preferentially hydrolyzes poly(D-lactic acid) (PDLA), but can also cleave poly(L-lactic acid) (PLLA).
We considered the safety aspects of using these two enzymes, since their sequences were originally from Risk Group 2 (RG2) organisms. We submitted our safety information to iGEM for review. Safety forms were approved on October 2nd, 2013 by the iGEM Safety Committee.
We did not use these organisms only the parts and the final sequences were codon optimised for expression in E. coli.
1.0 P(3HB) Degradation Model▼
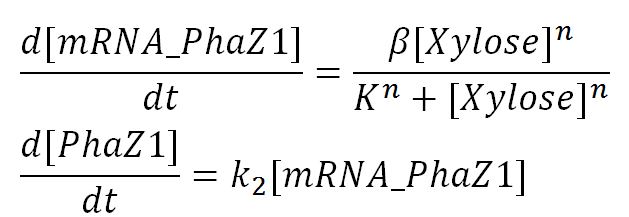
The P(3HB) degradation model was built and simulated in MATLAB Simbiology in the similar fashion as that seen in the modelling section of Module 1. This model encompasses gene expression of PhaZ1 (P(3HB) depolymerase) controlled by a xylose inducible promoter[http://parts.igem.org/Part:BBa_I741018]and the kinetics of PhaZ1 degrading the polymer P(3HB) into shorter oligomers or 3HB monomers.
1.1 Ordinary differential equations
Genetic expression and regulation of PhaZ1
- Notice that the degradation terms are lacking because the cells are assumed to be in stationary growth. Therefore, the assumed dominant process by which the mRNA and protein degrade - dilution - is absent.
Values, sources and assumptions
| Parameter | Description | Value | Units | Sources | Assumptions/Notes |
|---|---|---|---|---|---|
| β | maximum rate of transcription | 0.019 | mM/min | Please see derivation 1 below. | Please see derivation 1 below. |
| n | Hill coefficient | 2.0 | dimensionless | Estimation. Not on parts registry [http://parts.igem.org/cgi/partsdb/part_info.cgi?part_name=BBa%20I741018] Didn't manage to find an appropriate source with such value. | Assume cooperativity of degree 2. |
| K | Activation coefficient | 23.5 | mM | Personal conversation with Christopher Hirst, Department of Bioengineering, Imperial College London | Taken from data for xylF in MOPS with 0.4% glucose with extra xylR on the plasmid, however the plasmid is low copy and also the presence of the xylR gene on the plasmid definitely alters the expression level. Data fitted to Hill equation. This value was the most accurate we managed to obtain, though a rough one as 3% glucose in LB was used in the expreiment. |
| k2 | Protein production rate | 2.9 | 1/min | Please see derivation 2 below. | Please see derivation 2 below. |
| [Xylose] | Concentration of xylose in cell | constant: 0.01 | mM | - | Manual input. |
| [mRNA] | Concentration of mRNA | - | mM | - | - |
| [PhaZ1] | Concentration of PhaZ1 | - | mM | - | - |
Derivations
1.Derivation of the maximal expression rate,β
- Average molecular weight (Mw) of a base pair = 660g/mol[http://www.geneinfinity.org/sp/sp_dnaprop.html][http://www.lifetechnologies.com/uk/en/home/references/ambion-tech-support/rna-tools-and-calculators/dna-and-rna-molecular-weights-and-conversions.html]
- Average mass of a base pair = 660g/mol x 1.66x10-24 = 1.1x10⁻²¹g
- Volume of an E.coli cell = 1µm3[http://kirschner.med.harvard.edu/files/bionumbers/fundamentalBioNumbersHandout.pdf] = 1x10-15L
- BioBrick assembly plasmid pSB1C3 is a high copy number plasmid (100-300 copies per cell)[http://parts.igem.org/Part:pSB1C3?title=Part:pSB1C3]
- assume 200 copies per cell
- ∴ concentration of the gene per cell = N x 200 x 1.66x10-6mM, where N = number of base pairs
- ∴ concentration of the gene phaZ1 (N = 1245)[http://bacteria.ensembl.org/cupriavidus_metallidurans_ch34/Gene/Summary?g=Rmet_1017;r=Chromosome:1106373-1107617;t=ABF07903] in the volume of an E.coli cell is = 0.41mM
- Transcription rate in E.coli= 80bp/s[http://kirschner.med.harvard.edu/files/bionumbers/fundamentalBioNumbersHandout.pdf] = 80 x 1.66x10-6mM/s = 80 x 1.66x10-6 x 60mM/min = 7.97x10⁻³mM/min
- ∴ Rate of mRNA_phaZ1 production under the control of pBAD = 7.97x10⁻³ ÷ 0.41 = 0.019/min
2.Protein production rate of phaZ1, k2
- Average molecular weight(Mw) of an amino acid(aa)= 110g/mol[http://www.genscript.com/conversion.html][http://www.promega.com/~/media/Files/Resources/Technical%20References/Amino%20Acid%20Abbreviations%20and%20Molecular%20Weights.pdf]
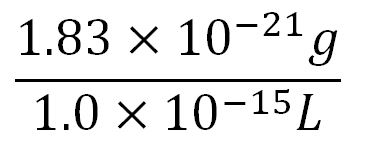
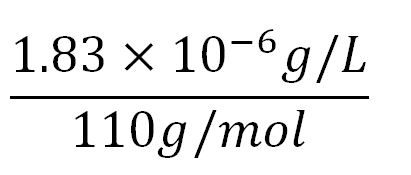
- Average mass of an amino acid = 110g/mol x 1.66x10-24=1.83x10⁻²²g/L
- Translation rate = 20aa/s = (20 x 1.66x10-5 x 60)mM/min = 0.020mM/min
- PhaZ1 comprises of 414aa[http://bacteria.ensembl.org/cupriavidus_metallidurans_ch34/Gene/Summary?g=Rmet_1017;r=Chromosome:1106373-1107617;t=ABF07903]
- ∴concentration of PhaZ1's aa in the volume of an E.coli= 1.66x10-5mM x 414 = 6.87x10⁻³mM
- ∴ Rate of protein production = 0.020 ÷ 6.87x10-3 = 2.9/min
1.2 Enzyme kinetics
PhaZ1 reaction with P(3HB)
Values, sources and assumptions
| Parameter | Description | Value | Units | Source | Assumptions/Notes |
|---|---|---|---|---|---|
| kcat,PhaZ1 | Turnover number of PhaZ1 with P(3HB) as substrate | 214 | 1/min | Please see "Testing and Results" | Vmax was obtained from enzymatic assay results, value = 29.59uM/s. kcat = Vmax/[E], where Vmax is the maximum velocity of enzymatic reaction and [E] is the total enzyme concentration used. [E] was measured as 360ng/uL. The molar mass of PhaZ1 (43496 g/mol [http://www.mybiosource.com/datasheet.php?products_id=1012640])was used to convert the units of [E] into g/L. After appropriate conversions and calculations, kcat was calculated to be 214/min |
| Km | Michaelis constant | 1.56 | mM | Please see "Testing and Results" | - |
| [PhaZ1] | Concentration of PhaZ1 | - | mM | - | - |
| [P(3HB)] | Extracellular concentration of P(3HB) | 50 | mM | - | user-defined initial value |
| Secretion | Secretion rate of PhaZ1 from cell to outside | 0.5 | 1/minute | - | Appears as "k" in the Simbiology parameter list for that reaction object. The resulting extracellular concentration was then scaled up by multiplying the concentration by 1.5x10²¹ cells. |
1.3 Simulation results
Please note that the result at this point was already scaled up (please refer to "secretion" from the table above. The value 1.5x10²¹ was chosen as the number of cells because this was the order of magnitude that would give the reasonable amount of enzyme for degradation. Other parameters such as those involved in gene expression were the closest we could get them to and the enzyme kinetics data were taken from the our own enzyme assay experiment. Therefore, we were left with the number of cells and the unknown secretion rate to modify. After several runs of simulation, we decided to increase the number of cells to 1.5x10²¹, instead of the 1.5x10¹² assumed in the synthesis model.
(i)P(3HB) and 3HB levels over time (units: mM)
(ii)P(3HB) level over time (units: g/L)
Graphs (i) to (ii) unit conversion
- To convert from mM to g/L:
- Molecular weight(Mw) of P(3HB) = 1.8x1012g/mol[http://webpages.charter.net/hvalentin/PDF-files/18.pdf]
(Please note that this value was taken from a paper about the "Production of poly(3-hydroxybutyrate-co-4-hydroxybutyrate) in recombinant Escherichia coli grown on glucose" instead of the production of poly(3-hydroxybutyrate). However, this is the closest we managed to get as far as species, substrate and type of plastic are concerned.
Also, it was noticed that the molecular weight would change depending on the cultivation time (as conditions such as growth and pH can also affect it) and it was hard to find a paper that contains the exact same conditions and the range of cultivation times for our simulations. Furthermore, in reality there wouldn't be a single value of molecular weight obtained, but a range of values (known as polydispersity).[http://aem.asm.org/content/78/9/3177.full] Therefore, it was assumed that the molecular weight would remain constant during the time course of the simulation and that the value should be considered as an average.)
- ∴P(3HB)concentration in mM x 10-3 x 1.8x1012g/mol = concentration in g/L
Future work
With a more complete characterisation of the promoter under the experimental conditions used for this system, more accurate gene expression parameter values can be plugged into the model. Also, the secretion rate was hard to determine and would be an important value to obtain experimentally because it is the only rate that controls how much of the enzyme is released to the extracellular space.
P(3HB) degradation model:Download
Additional script:Download
2.0 P(3HB) production from 3HB monomers▼
In module 2, the main objective is the bioplastic recycling. We have a detailed explanation of the P(3HB) synthesis model and the optimization in P(3HB) production yield. Our synthetic pathway of converting monomeric 3HB to polymeric P(3HB) is described in module one. In MAPLE system, both glucose from mixed waste and 3HB monomers are the inputs to produce P(3HB). In this section, we are going to introduce a customized metabolic model that consisted our synthetic pathway with a metabolic model built by Angela Dixon. [http://digitalcommons.usu.edu/engineering_datasets/1/] The combined metabolic model can predict the P(3HB) production with both 3HB and glucose as sources.
Introduction of the metabolic model
The metabolic model predicts the interaction of our pathway with endogenous pathways. In synthetic biology, an ideal system is fully orthogonal. However, if the synthetic pathway uses some metabolites from the metabolism pathways, the metabolic fluxes (the rate of conversion between metabolites) will be affected. If the cell is overloaded by losing too much metabolites, it would either reject the synthetic pathway or burn out. As for the optimization of PHB production in our MAPLE system, metabolic analysis need to be carried out to estimate the effects on the cell metabolism from increases in the PHB production.
Methods
We altered the metabolic model by Angela Dixon in her paper “Predictive Mathematical Model for Polyhydroxybutyrate Synthesis in Escherichia coli”. [http://digitalcommons.usu.edu/engineering_datasets/1/] The metabolic model is built in Simbiology, which is an extension in MATLAB especially for biological system. The model consists two metabolic pathways: Glycolysis and TCA cycle. The reactions in the metabolic pathways are defined by ordinary differential equations and kinetic parameters. The model also contains a synthetic pathway that produce P(3HB) from acetyl-coA. The pathway consists three enzymes which are PhaA, PhaB and PhaC. The reasons we chose this model:
1. The model is based on ODEs instead of FBA (flux balance analysis), which is a common method of metabolic analysis. However, FBA cannot determine the real time concentrations of the metabolites whereas it can be done by models with ODEs.
2. Only single gene deletion or addition can be performed in FBA. More than that, the metabolic model here can perform modification on any single or multiple genes and reactions through Simbiology.
3. The FBA model is static, it cannot analyze the dynamic interactions between our synthetic pathways with the metabolic pathways. As both our P(3HB) synthesis model and the metabolic model are in the same platform. It was really easy to integrate our pathway into the metabolic model.
4. The strain in the metabolic model is E.coli K12, the strain MG1655 we are using is also included in K12 group. The models can therefore be more easily combined.
In our project, we have a different pathway:
1. We use 3HB as one of the input.
2. ato system is present in the E.coli MG1655 strain.
3. We removed phaA in our case because we use 3HB as the major source to produce P(3HB), it will avoid too much acetyl-coA be taken from the metabolic pathways.
Therefore, we substituted the original pathway with our synthetic pathway. Moreover, we added our gene expression models for the enzymes into the metabolic model as well. In terms of the consistency of the model, we changed the units of our synthetic pathway into micro molar and seconds.
Here is the combination of our model with the metabolic model
The pathway with the black border is our synthetic pathway.
We also carried out a parameter estimations of the initial concentrations of several substrates in our synthetic pathway. The reason is we have single-cell scaled magnitude for them originally (fM level), but there are much higher magnitudes in any of the species in the metabolic pathways (mM level). Therefore, we scaled up the pathway in order to maintain the consistency of the model. As for the metabolites which are involved in our pathway, we cloned the blocks of them from the metabolic pathway in Simbiology and deliberately put them into our pathway. That means our pathway dynamically interact with the metabolic pathways.
Here is the table for the updated initial concentrations for the species in our synthetic pathway: All the kinetic data and initial concentrations of the metabolites in the metabolic pathways are referenced in the paper[http://digitalcommons.usu.edu/engineering_datasets/1/]:
| Substrates | Concentration | Units | Sources | Assumptions |
|---|---|---|---|---|
| 3HB | 5000 | uM | - | The initial input to the system |
| Acetoacetate | 1000 | uM | - | The ato system in E.coli suggest a favourable conversion from acetoacetyl-coA to acetoacetate. We assumed the concentration of acetoacetate is 10 times larger than acetoacetyl-coA[http://www.sciencedirect.com/science/article/pii/0003986177904969] |
| Acetoacetyl-coA | 100 | uM | [http://www.ncbi.nlm.nih.gov/pubmed/1103741] | The ato system in E.coli suggest a favourable conversion from acetoacetyl-coA to acetoacetate. [http://www.sciencedirect.com/science/article/pii/0003986177904969] |
| NADH | 200 | uM | [http://digitalcommons.usu.edu/engineering_datasets/1/] | - |
| NAD+ | 1200 | uM | [http://digitalcommons.usu.edu/engineering_datasets/1/] | - |
| Acetyl-coA | 5000 | uM | [http://digitalcommons.usu.edu/engineering_datasets/1/] | - |
| Coenzyme A | 250 | uM | [http://digitalcommons.usu.edu/engineering_datasets/1/] | - |
| Acetate | 40000 | uM | [http://www.ncbi.nlm.nih.gov/pubmed/1103741] | Assay data from the literature which the ato system efficiency was measured |
| 3HB-coA | 0 | uM | - | One of the intermediate product of the pathway |
| NADPH | 200 | uM | [http://digitalcommons.usu.edu/engineering_datasets/1/] | - |
| NADP+ | 1200 | uM | [http://digitalcommons.usu.edu/engineering_datasets/1/] | - |
| PHB | 0 | uM | - | The final product of the pathway |
ATP analysis:
In our optimization of P(3HB) production module, we discovered that increasing in the PhaB expression can efficiently increase the yield of P(3HB). It’s important to see whether increase in the PhaB expression would dramatically affects the metabolic pathways or not. As ATP is the essential energy carriers in the cell, we carried a parameter scan for the variation in ATP concentration under different concentrations of PhaB.
There is an approximately 5.3% drop in the concentration of ATP when increasing the phaB concentration from 50uM to 200uM. It suggests that increasing the flux in our pathway may reduce the energy transportation in the cell. However, it’s still unsure about the effect of 5.3% drop in ATP concentration on the cell growth.
Large scale PHB production and implementation in MAPLE
In our MAPLE system, the bioplastic P(3HB) is produced from both 3HB monomers and glucose. 3HB is the degradation product from the wasted P(3HB)plastic and glucose is the product from the degradation of mixed waste. Therefore, the overall PHB production rates need to be determined by the model.
The result shows that the PHB yield can reach 70g/L after one day with both inputs whereas about 30g/L with glucose. It proves that using both glucose and 3HB can double the yield of P(3HB). The production rate 70g/L/Day is also relatively high for industrial scale of bioplastic production.
Assumption in the production
- Conditions and considerations accompanying this value are:
- volume of the system is 1 litre
- growth medium: LB broth
- Cultivation temperature: 37°C
- wild-type E. coli K-12 strain MG1655 (NB: though not exactly our engineered one, it is the correct strain)
- Conditions and considerations accompanying this value are:
- Assume stationary growth phase.
- Assume that the amount of P(3HB) accumulated during the time course of simulation doesn't exceed the cell's capacity or ability to contain it.
- Assume that all initial concentrations of the species in metabolic pathways and the synthetic pathways are in a large population level. The concentrations are maintained by approximately 1.5x10¹²cells in a 1L broth, calculated from value obtained from BioNumbers. A range was given: 1-2x10⁹ cells/ml, so 1.5x10⁹ was taken. [http://bionumbers.hms.harvard.edu/bionumber.aspx?s=n&id=104831&ver=5]
Video: How to run a simulation in the metabolic model (please refresh if it's not here)
Metabolic model:Download
3.0 PLA Degradation Model▼
Introduction
The efficiency of degrading Polylactic acid (PLA) is important for the performance of MAPLE. Therefore, we chose a strong enzyme Proteinase K which is suggested by many literature as an efficient PLA degrading enzyme. We performed several assays in order to determine the kinetic properties of Proteinase K. The PLA degradation model was then built based on the experimental results.Objective and Design
1. With the defined kinetic properties of Proteinase K. The model can predict the time needed to degrade a certain amount of PLA. It will produce useful information when degrading large amount of plastic.
2. The model also involves the gene expression model of the Proteinase K with an inducible promoter. Gene expression can be regulated by adjusting the inducer concentration.
3. A secretion module is contained in the model which assumes the efficiency of enzyme secretion to the culture.
Specifications of the model
Polylactic acid (PLA) degradation involves proteinase K:
| enzyme | source organism | biobrick | reference |
|---|---|---|---|
| Proteinase K | Engyodontium album | [http://parts.igem.org/Part:BBa_K1149002 BBa_K1149002] | [http://www.ncbi.nlm.nih.gov/nuccore/X14689.1] |
The overall PLA degradation model is shown as below:
There are two compartments which represents cells and the culture from left to right. The "cell" compartment contains the gene expression module whereas the "culture" compartment contains the degradation module. The "secretion" block that connects two compartments is the secretion module.
Parameters and assumptions
Gene expression module of Proteinase K
| Parameter | Description | Value | Units | Sources | Assumptions |
|---|---|---|---|---|---|
| β | maximum rate of transcription | 0.020 | mM/min | Please see derivation 1 below. | Please see derivation 1 below. |
| K | Activation coefficient | 0.0031 | mM | [http://parts.igem.org/Part:BBa_K206000:Characterization] | Taking the "switch point" as the activation coefficient |
| dmRNA | mRNA degradation rate | 0.10 | 1/min | [http://www.ncbi.nlm.nih.gov/pmc/articles/PMC420366/pdf/07X.pdf] | Taking the value of mRNA half-life in E.coli strain MG1655 as 6.8min. rate = ln2/half-life = ln2/6.8 = 0.10 |
| dprotein | Protein degradation rate | 0.050 | 1/min | [http://jb.asm.org/content/189/23/8746.full] | There is no active degradation pathway and that dilution is the dominant way by which the protein level decreases in a cell. Rate = 1/doubling time, where doubling time = 20min. Assuming steady-state growth in LB broth as presented in paper. |
| k2 | Protein production rate (Proteinase K) | 3.0 | 1/min | Please see derivation 2 below. | Please see derivation 2 below. |
| [Arabinose] | Concentration of arabinose | Initial: 0.008 | mM | - | - |
| [mRNA] | Concentration of mRNA | - | mM | - | - |
| [Proteinase K] | Concentration of Proteinase K | - | mM | - | - |
1.Derivation of the maximal expression rate,β
- Average molecular weight (Mw) of a base pair = 660g/mol[http://www.geneinfinity.org/sp/sp_dnaprop.html][http://www.lifetechnologies.com/uk/en/home/references/ambion-tech-support/rna-tools-and-calculators/dna-and-rna-molecular-weights-and-conversions.html]
- Average mass of a base pair = 660g/mol x 1.66x10-24 = 1.1x10⁻²¹g
- Volume of an E.coli cell = 1µm3[http://kirschner.med.harvard.edu/files/bionumbers/fundamentalBioNumbersHandout.pdf] = 1x10-15L
- BioBrick assembly plasmid pSB1C3 is a high copy number plasmid (100-300 copies per cell)[http://parts.igem.org/Part:pSB1C3?title=Part:pSB1C3]
- assume 200 copies per cell
- ∴ concentration of the gene per cell = N x 200 x 1.66x10-6mM, where N = number of base pairs
- ∴ concentration of the gene proteinase K (N = 1194) in the volume of an E.coli cell is = 0.40mM
- Transcription rate in E.coli = 80bp/s[http://kirschner.med.harvard.edu/files/bionumbers/fundamentalBioNumbersHandout.pdf] = 80 x 1.66x10-6mM/s = 80 x 1.66x10-6 x 60mM/min = 7.97x10⁻³mM/min
- ∴ Rate of mRNA_Proteinase K production under the control of pBAD = 7.97x10⁻³ ÷ 0.40 = 0.020/min
- Average molecular weight(Mw) of an amino acid(aa)= 110g/mol[http://www.genscript.com/conversion.html][http://www.promega.com/~/media/Files/Resources/Technical%20References/Amino%20Acid%20Abbreviations%20and%20Molecular%20Weights.pdf]
- Average mass of an amino acid = 110g/mol x 1.66x10-24=1.83x10⁻²²g/L
- Translation rate = 20aa/s = (20 x 1.66x10-5 x 60)mM/min = 0.020mM/min
- Proteinase K comprises of 398aa[http://www.ncbi.nlm.nih.gov/nuccore/X14689.1]
- ∴concentration of Proteinase K's aa in the volume of an E.coli = 1.66x10-5mM x 398 = 6.61x10⁻³mM
- ∴ Rate of protein production = 0.020 ÷ 4.25x10-3 = 3.0/min
Degradation
The reaction equation of the PLA degradation is:
[Polylactic acid]+[Proteinase K]= 660 [lactic acid] + [Proteinase K]
Assumptions:
1. We assumed 1 mole of polylactic acid can produce 660 moles of lactic acid.
2. The molecular weight of a single polylactic acid monomer is 90 g/mol [http://www.chemspider.com/Chemical-Structure.592.html]whereas the molecular weight of the solid polylactic acid is around 59500 g/mol.[http://www.sciencedirect.com/science/article/pii/S0014305711003582]Therefore, the short-chain polylactic acid consists approximately 660 monomers. 660 molecules of lactic acid will be produced by degrading one chain of polymer.
3. Assumed the polylactic acid only contains one length of chain, however in reality the plastic chain has a range of lengths.
4. Considerations of temperature change and PH change are not included in the model. Therefore, the assumption is that they remain constant during the degradation
5. We also assumed a simple Michaelis-Menten mechanism for proteinase K.
"[Proteinase K]" here is the concentration of the enzyme Proteinase K in mM, whereas "[Polylactic acid]" represents the concentration of polylactic acid in mM.
The parameters for the kinetic equations are:
| Parameter | Description | Value | Units | Sources |
|---|---|---|---|---|
| Km | Michaelis constant | 0.032 | mM | - |
| Vmax | Maximum velocity | 2.472 | mM/min | - |
| Proteinase K | Concentration of the enzyme in assays | 30 | mg/L | - |
| Kcat | turnover number | 2348.4 | 1/min | See derivation below |
| Mw | Molecular weight of proteinase K | 28.5 | KDa | [http://www.sigmaaldrich.com/etc/medialib/docs/Sigma/Datasheet/2/p4850dat.Par.0001.File.tmp/p4850dat.pdf] |
Derivation:Turnover number (Kcat) = Vmax*Mw/[proteinase K] = 2348.4
The efficiency of Secretion is assumed to be 90% secretion over 2 hours.[http://www.ncbi.nlm.nih.gov/pmc/articles/PMC1251600/] The rate of secretion in the model is therefore:
rate of secretion = 0.9[concentration of Proteinase K]/120 (mM/mins)
Simulations and Results
The initial concentration of Polylactic acid is 40mM, which can be converted to 2380g/L. The derivation is: 40*59500/1000 = 2380g/L. There is approximately 2kg of polylactic acid in the 1 litre bioreactor, which is a really large amount. The simulation result is:
Results and explanations:The simulation shows a very fast degradation of large amount of polylactic acid by proteinase K. 2kg/L of the plastic can be completely degraded in 6 minutes. The reason for fast degradation is that we have relative large kinetic parameters for the enzyme. Polylactic acid was not used as the substrate in our kinetic assays. Therefore, we made an assumption that polylactic acid in the model has similar chain length as that of the substrate in the assays. In reality, the PLA plastic is in solid form which enzymes can only degrade the plastic from the surface. The efficiency of degradation will be massively reduced due the 3D geometry. A 3D model is needed for future improvements of plastic degradation. The kinetic data of degrading solid form of PLA also need to be defined.
PLA degradation model:Download
Our chassis can grow with P(3HB) and 3HB▼
Summary
Our chassis can grow and survive in reasonable concentrations of P(3HB) and 3HB. To increase tolerance to 3HB we have re-designed our system to include expression of Bdh2 (BBa_K1149050, 3HB dehydrogenase), which breaks down 3HB to acetoacetate. Acetoacetate toxicity was examined and these data are being utilised along with our metabolic models to determine the effects of differing levels of 3HB and acetoacetate on bioplastic (P3HB) production.
MG1655 transformed with either native phaCAB or empty vector (control) plasmid were grown for 6h in LB containing 3-HB or P-3HB to assess any potential toxicities associated with these bioplasrics.
3-hydroxybutyrate (3HB)
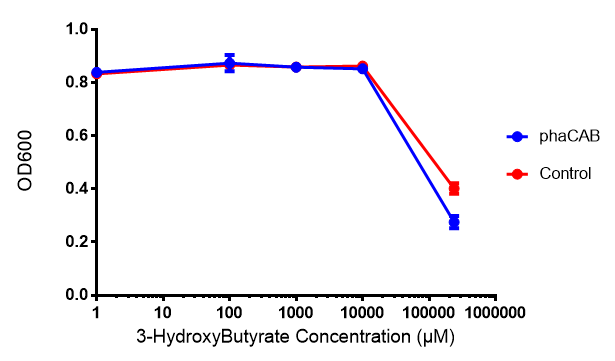
Poly(3-hydroxybutyrate) P(3HB)
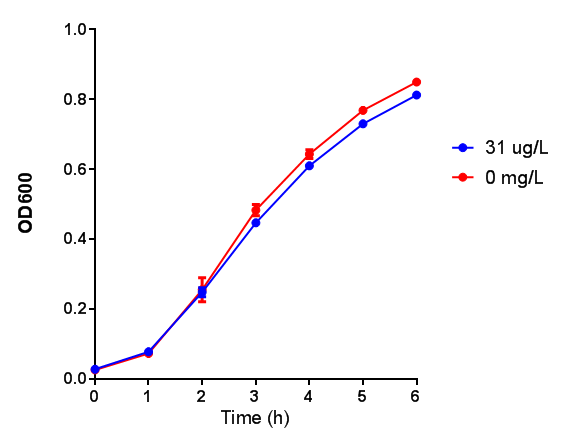
Conclusion:3HB is toxic above 10mM and P(3HB) had no effect on growth at 31 μg/L. These data can be utilised to determine the maximum level of 3HB which should be present in our final bioreactor design. We have shared these data with our modelling team in order to determine maximum P(3HB) production at or below 10mM (3HB). In light of these data we have modified our design to include the expression of bdh2 (BBa_K1149050)</b>, which is a 3HB dehydrogenase that can convert 3HB into acetoacetate, a common metabolite in E.coli. Expression of bdh2 should overcome the toxicity limit of 3HB, since E. coli can metabolise acetoacetate</b>To this end we tested whether an increase in acetoacetate would present any toxicities.
Acetoacetate
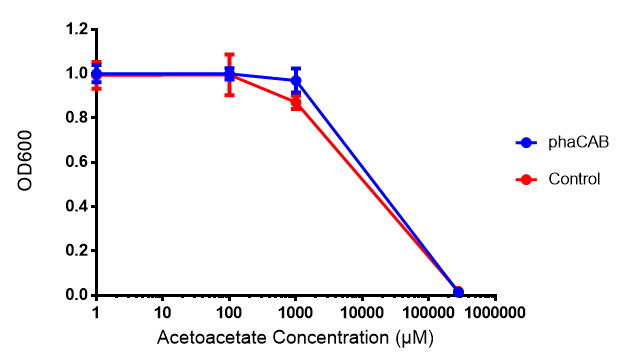
Conclusion:Acetoacetate toxicity lies somewhere between 1mM and 287 mM.
Bioplastic degradation: Phaz1 enzymatic assays▼
Enzyme activity of PHB depolymerase (phaz1)
It can be seen from the Western Blot results that phaz1 [http://parts.igem.org/Part:BBa_K1149010 BBa_K1149010] was being expressed. To show that this enzyme has esterase activity, colourimetric assays were performed using the substrate analog para-Nitrophenyl butyrate. When the ester bond in this substrate is cleaved, 4-Nitrophenol is released. This is accompanied by an increase in absorbance at the wavelength 405 nm and a colour change from colourless to yellow. The concentration of 4-Nitrophenol produced could then be calculated with the Beer-Lambert Law, as the extinction coefficient of 4-NP at 405 nm is 18,000 M-1 cm-1. This experiment was performed with both the crude cell lysate and purified PHB depolymerase. Our data shows that this enzyme is definitely active.

Cell lysate assay
After 48 hours of growing and inducing the phaz1 culture, the cells were lysed by probe-sonication, spun down and resuspended in 50mM Tris-HCl buffer. A reaction mixture containing 5 µL of crude phaz1 lysate, 4 µL of para-Nitrophenyl butyrate solution and 1 mL of 50 mM Tris-HCl pH 7.4 buffer was incubated in the [http://www.eppendorf.com/int/index.php?sitemap=2.1&action=products&contentid=1&catalognode=87236 Eppendorf BioSpectrometer] for 570 seconds, whilst the absorbance at 405 nm was automatically recorded every 30 seconds.
The above graph shows that greater esterase activity occurs when the phaz1 cell lysate is in the reaction mixture. The graph shows that there is also esterase activity occuring in the Empty Vector and Substrate alone reaction mixtures, but this is due to the imidazole present in the Tris-HCl buffer, which acts as a general base catalysis. [http://pubs.acs.org/doi/pdf/10.1021/ja00874a035 (6)]
Purified enzyme assay
Since the phaz1 [http://parts.igem.org/Part:BBa_K1149010 BBa_K1149010] construct contains a His tag, the protein could be purified by metal affinity chromatography. The colourimetric assay was carried out, as with the cell lysate. 100 mM potassium phosphate (pH 7.4) buffer was used instead of the Tris-HCl buffer, to eliminate the esterase activity caused by imidazole in the buffer used previously. Every 30 seconds for 30 minutes the absorbance at 405 nm of the reaction mixture was recorded. The reaction mixture contained 1 ml of phosphate buffer, 2.5 µL of purified PHB depolyermase (stock concentration 0.230 mg/ml) and para-Nitrophenyl butyrate to make final concentrations of 50 µM, 100 µM, 150 µM, 200 µM and 250 µM of substrate.
The above graph shows how the concentration of 4-Nitrophenol produced is greater when the para-Nitrophenyl butyrate substrate concentration is greater. This data shows that we have successfully purified active PHB depolyermase.
Michaelis-Menten kinetics of phaZ1 PHB depolymerase
To gain the kinetic parameters for our P(3HB) degradation model, purified phaZ1 PHB depolymerase was used in the same activity assay as described above. The para-Nitrophenyl butyrate substrate concentrations used were 0.5 mM,1.0 mM, 2.5 mM and 5.0 mM and 5 µL of purified PHB depolymerase (stock concentration 360 ng/µL). From these preliminary results and using graphpad, we have predicted the kinetic parameters to be a Vmax of 29.59 µM/s and a Km 1.56 mM.
Bioplastic degradation: Phaz1 degrades P(3HB)▼
Clearing Zone Assay
Clearing zone experiment was conducted to semi-quantitatively test the ability of PhaZ1 to break down P3HB. PhaZ1 cell lysate was tested on a P3HB LB agar plate. The protocol can be found here.
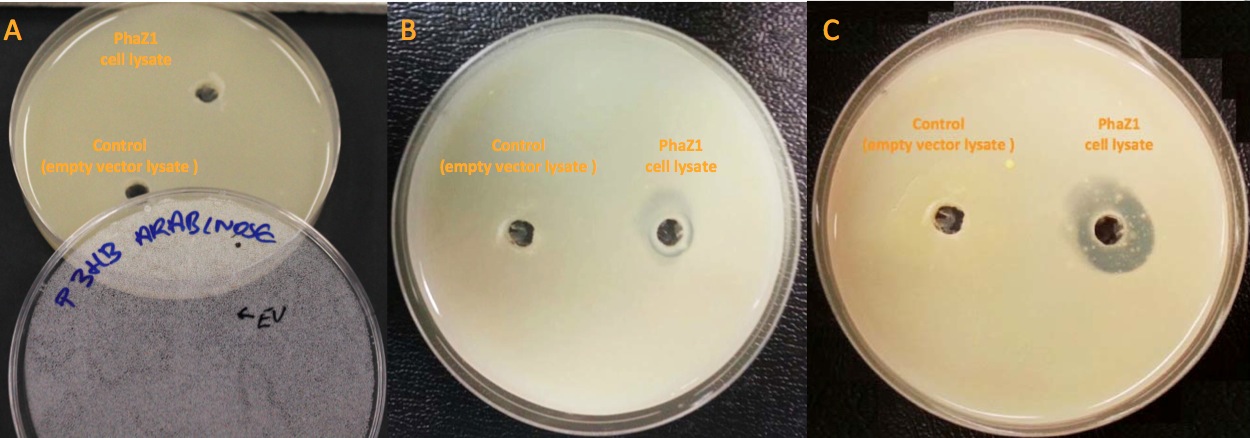
3HB assay
In order to show that phaZ1 is functional, we have measured the amount of 3HB monomers produced due to the degradation of the polymer, when incubated with the enzyme. We have repurposed a 3HB colorimetric assay kit that is used for 3HB detection from animal tissue and bodily fluid samples. Please see the [https://2013.igem.org/Team:Imperial_College/ Protocols#3HB_assay protocol] and the data sections for details.
It is clear from our results that enzyme treatment produces a lot more 3HB than the control. We do expect to see some background 3HB from the untreated sample since it was in the shaking incubator at 37°C in the Buffer solution. PHB is a bioplastic and degrades spontaneously as well as enzymatically. However, the spontaneous degradation occurs slowly.
Our chassis can utilise 3HB▼
bdh2 improves growth on 3HB
We have previously observed that MG1655 cells can survive in minimal media that contains 3HB as sole carbon source. This is evidence for that some uptake mechanism and a metabolic pathway is active at a low level in the cells. We hypothesised that the 3HB dehydrogenase could improve growth since it can convert 3HB into acetoacetate, a common metabolite in E.coli.
In order to test this, we run a growth experiment with various 3HB concentrations where the growth of cells containing bdh2 (BBa_K1149050) and Empty vector was recorded on a 96 well plate. We have calculated the growth rates from this data and plot it on the graph below.
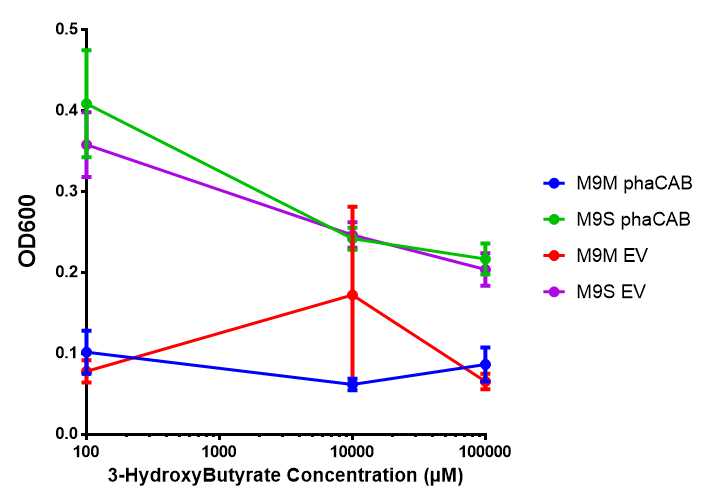 3HB sole carbon source growth in minimal media with phaCAB and EV. MG1655 phaCAB were grown in supplemented and minimal M9 media. Relative to the empty vector control, there was no significant difference in growth as t-test gave p = 0.8072 > 0.05. However, an ANOVA of the data gave (F 3,8 = 6.589, p < 0.0149), thus the null hypothesis, there is no difference between M9M and M9S must be rejected. Indeed if we look closer, we see that both M9M EV and M9S EV are significantly different from another (p = 0.045), as are M9M phaCAB and M9S phaCAB (p = 0.0284). Data points show final time point after 6h growth for each concentration. Growth was at 37°C with shaking over 6h. Error bars are SEM, n=4. Figure made by Imperial College London 2013 iGEM. | 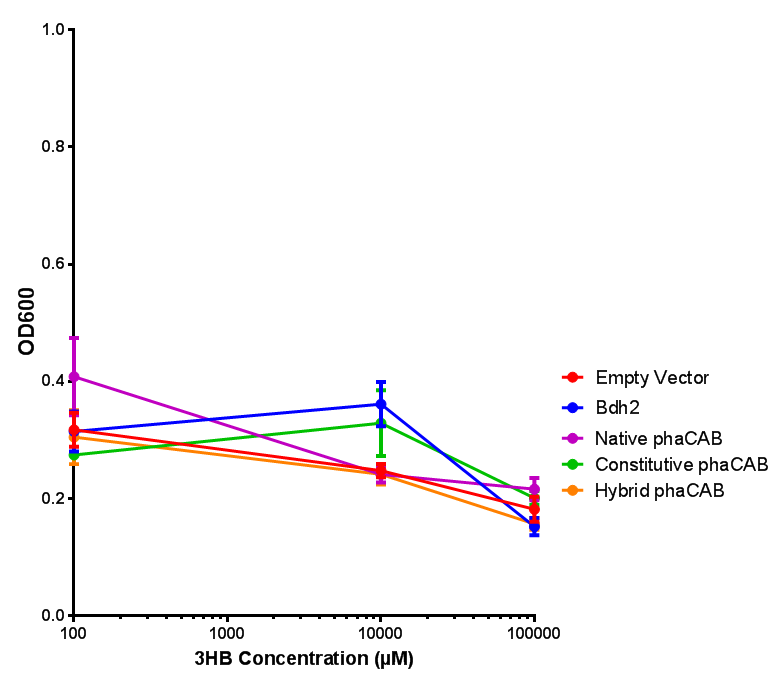 3HB sole carbon source growth in M9S with P3HB synthesis pathway genes. The 3 phaCAB promoter constructs are represented with native phaCAB, constitutive phaCAB and hybrid phaCAB. In addition bdh2 was tested to see whether its presence increased growth for the cells. This was completed with 3 3HB concentrations - 100 μM, 10 mM and 100 mM. ANOVA analysis shows that there is no significant difference between any of the constructs (F 4,10 = 0.1875, p < 0.9396). Data points show final time point after 6h growth for each concentration. Growth was at 37°C with shaking over 6h. Error bars are SEM, n=4. Figure made by Imperial College London 2013 iGEM. |
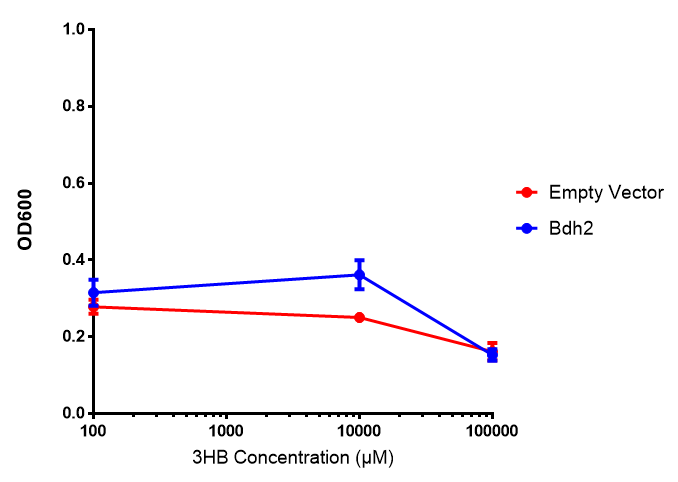 Bdh2 with no pelB secretion tag growth. Bdh2 MG1655 cells were grown in M9S media to gauge growth, the growth does not differ from the control as p = 0.5543. Data points show final time point after 6h growth for each concentration. Growth was at 37°C with shaking over 6h. Error bars are SEM, n=4. Figure made by Imperial College London 2013 iGEM. | 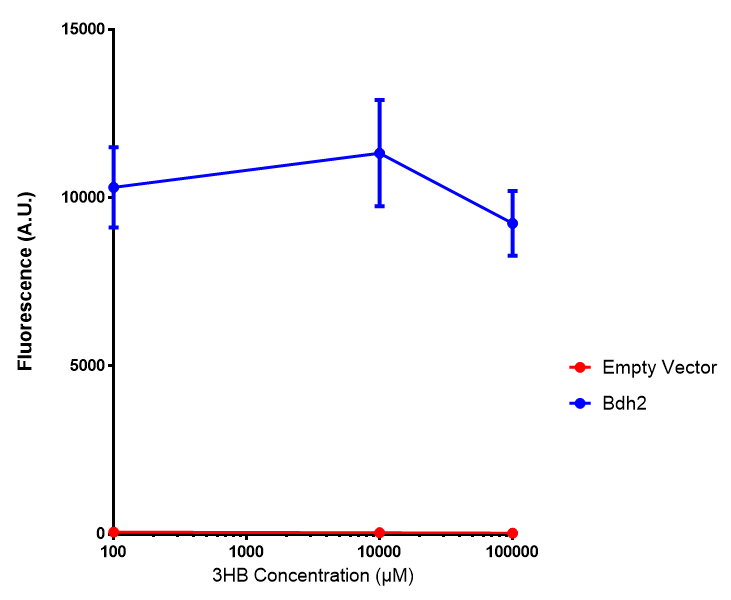 Bdh2 with no pelB secretion tag fluorescence. MG1655 cells with bdh2 were grown in M9S and then tested for fluorescence by measuring their GFP output. There is significant fluorescence as p < 0.0001. Data points show final time point after 6h growth for each concentration. Growth was at 37°C with shaking over 6h. Error bars are SEM, n=4. Figure made by Imperial College London 2013 iGEM. |
Conclusion:We can conclude that there is a slight increase in the growth rate of bdh2 containing cells at 10 000 uM 3HB. This suggests that bdh2 is able to function as expected and produces acetoacetate which is used by the cell`s central metabolic pathways for growth. At 100uM or 100 000 uM, we did not observe any differences in growth. This could be be because the rate limiting step at low concentrations could be the uptake of 3HB rather than it`s conversion to acetoacetate. We hope that we could observe an increase in growth if we added the putative permease we designed to the system. At higher level, there is a drop in growth rates in both bdh2 and control cells, probably because of toxicity issues. In addition, fluorescence is highly elevated in bdh2 compared to empty vector control.
Completing the cycle▼
We can degrade the PHB made by our own bacteria
With this experiment, we demonstrate that the material that we purified in various experiments is Poly-Hydroxy-Butyrate bioplastc. One of the samples analysed was extracted from bacteria growing on waste, therefore we made PHB bioplastic directly from waste.
We can close the loop and degrade our own bioplastic, with our own enzyme, [http://parts.igem.org/Part:BBa_K1149010 PhaZ1].
The amount of 3HB monomers freed from the polymer is more in case of all PhZ1 treated samples, than the untreated sample. There is less 3HB produced from the samples that were purified from bacteria than from the pure polymer, purchased from Sigma. This could be because I put less amount in the assay to start with, because there was less available. I put about a 0.01-0.03 g of our own and 0.5 grams of Sigma-PHB.
Please see our protocols and data pages for methods and details of the data.
Bioplastic degradation: Proteinase K enzymatic assays▼
Proteinase K kinetic activity
According to the literature, protease K breaks down poly L-lactic acid as well as fibrous proteins, such as silk fibroin. In the active site of proteinase K is a catalytic triad containing serine, histidine and aspartic acid. L-lactic acid is analogous to L-alanine. Poly L-lactic acid, therefore, can bind to and be catalysed by the catalytic triad, as it mimics silk fibroin which is rich with L-alanine residues. Proteinase K cannot catalyse the breakdown of poly D-lactic acid, because the catalytic triad will not accommodate it. [http://www.sciencedirect.com/science/article/pii/S014139101100142X] [http://www.biomedcentral.com/1472-6750/7/16]To obtain parameters to use in our PLA degradation model that kinetic activity of proteinase K was measured with a substrate analogue, N-succinyl Ala-Ala-Pro-Leu p-nitroanilide (AAPL p-NA). Cleavage of AAPL p-NA releases 4-nitroaniline (4-NA), which can be recorded by an increase in absorbance at wavelength 405nm. For this assay, [http://www.sigmaaldrich.com/catalog/product/sial/p2308?lang=en®ion=GB proteinase K] and [http://www.sigmaaldrich.com/catalog/product/sigma/s8511?lang=en®ion=GB AAPL p-NA] were purchased from Sigma.
The extinction coefficient of 4-nitroaniline is 9,500 M-1s-1 at wavelength 405 nm, according to [http://www.sigmaaldrich.com/etc/medialib/docs/Sigma/Product_Information_Sheet/2/m4765pis.Par.0001.File.tmp/m4765pis.pdf Sigma]. Using the Beer-Lambert law, the concentrations of 4-NA were calculated and plotted against time.
The initial velocities were calculated as the gradient between 0 and 30 seconds, when time = 0 seconds. These were plotted against the concentration AAPLp-NA and [http://www.graphpad.com/ graphpad] was used to estimate the Michaelis-Menten fit. It determined the Vmax as 46.31 µM/s and the Km as 19.28 µM.
Bioplastic degradation: Proteinase K degrades PLA▼
Proteinase K degrades PLA cup
Our bacteria are capable of growing on lactic acid, however the substance is toxic and results in a pronounced lag phase before growth commences:
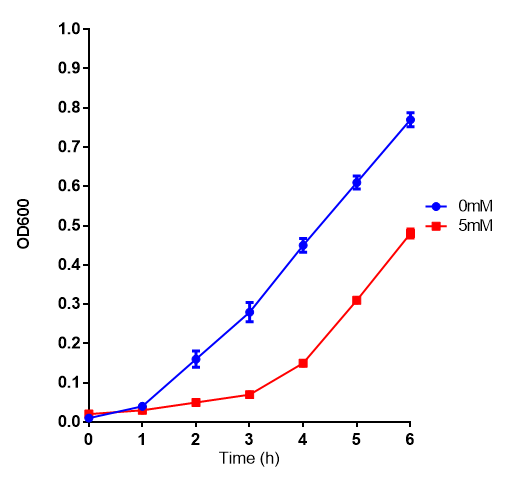
We have demonstrated that Proteinase K can degrade PLA. The below images are Scanning electron micrographs from the surface of a PLA cup after incubation with the enzyme. Please see our SEM data page for full description of expreiment and all SEM images.
References▼
Papers Referenced
- ANDERSON A, DAWES E. Occurrence, Metabolism, Metabolic Role, and Industrial Uses of Bacterial Polyhydroxyalkanoates. Microbiol Rev 1990 DEC;54(4):450-472.
- Harding KG, Dennis JS, von Blottnitz H, Harrison STL. Environmental analysis of plastic production processes: Comparing petroleum-based polypropylene and polyethylene with biologically-based poly-beta-hydroxybutyric acid using life cycle analysis. J Biotechnol 2007 MAY 31;130(1):57-66.
- Kim S, Dale BE. Energy and Greenhouse Gas Profiles of Polyhydroxybutyrates Derived from Corn Grain: A Life Cycle Perspective. Environ Sci Technol 2008 OCT 15;42(20):7690-7695.
- Jendrossek D, Handrick R. Microbial degradation of polyhydroxyalkanoates. Annu Rev Microbiol 2002;56:403-432.
- Philip S, Keshavarz T, Roy I. Polyhydroxyalkanoates: biodegradable polymers with a range of applications. Journal of Chemical Technology and Biotechnology 2007 MAR;82(3):233-247.
- Thomas C. Bruice , Thomas H. Fife , John J. Bruno , Patricia. BenkovicHydroxyl Group (V)1 and Imidazole (X)2 Catalysis. The General Base Catalysis of Ester Hydrolysis by Imidazole and the Influence of a Neighboring Hydroxyl Group. J. Am. Chem. Soc., 1962, 84 (15), pp 3012–3018
- Fusako Kawai, Kosuke Nakadai, Emiko Niskioka, Hajime Nakajima, Hitomi Ohara, Kazao Masaki, Haruyaki Lefuji.Different enantioselectivity of two types of poly (lactic acid) depolymerases toward poly (L-lactic acid) and poly (D-lactic acid).Polymer Degradation and Stability Volume 96, Issue 7, July 2011, Pages 1342–1348
- Jun Liao, Manfred K Warmuth, Sridhar Govindarajan, Jon E Ness, Rebecca P Wang, Claes Gustafsson, Jeremy MinshullEngineering proteinase K using machine learning and synthetic genes.BMC Biotechnology 2007, 7:16 doi:10.1186/1472-6750-7-16
Protocols▼
Clearing zone assay
- Prepare 10 ml cell culture and induce phaZ1 expression using 2% xylose media.
- Centrifuge the cell cultures at 4500 RCF (equivalent to 6221g) for 20 minutes at 4°C.
- Add 2 ml of 50mM Tris buffer (pH 7.4) to the pellet and mix well by vortexing the tube.
- Transfer the buffered pellet into 7ml tubes and keep the samples on ice.
- Perform probe sonication with 2-minute cycles of 2 seconds on, 2 seconds off, at 60% amplitude. Keep the sample on ice while sonicating.
- Centrifuge the samples again at 4000 g for 10 minutes and extract the supernatant, in order to separate cell debris and proteins.
- Each cuvette contains 700 ul of 0.5 mg/ml PHB emulsion and 300 ul of cell lysate. Use the 50mM Tris buffer as blank.
- Measure the absorbance at OD650 every 24 hours.
- Mix 0.5g of P3HB powder with 300 ml LB agar, make P3HB plates.
- Use sterilised pipette tip to cut two wells, each has a 0.5 mm diameter.
- Pipette 200ul of PhaZ1 cell lysate sample in one of the wells, and same amount of empty vector cell lysate sample in the other well.
- Observe the plate every 24 hours.
Protein purification by metal affinity chromatography
- Preparation: 10 mL cultures were incubated overnight. These were diluted in 500 mL the next morning and incubated until the OD reached 0.5-0.6. The cultures were then induced with 6mM arabinose or 2% xylose (final concentration)and left overnight. The cells were then pelleted by centrifugation, 4,000 rpm for 10 minutes and kept in a -80ºC freezer.
- Cell lysis The frozen pellets were allowed to thaw and resuspended in 10 mL of Tris-HCl binding buffer. The cells were lysed by probe-sonication at 60% amplitude with 2 minute cycles of 2 seconds on, 2 seconds off. The samples were kept on ice throughout the sonication process. The cell debris was pelleted by spinning and the supernatant removed for purification.
- Purification with a Ni-NTA column: The column was washed with Buffer A (10 mM imidazole, 40 mM Tris pH 8, and 400 mM NaCl) to equilibrate the resin. The samples are added and the column is washed with Buffer A, and then eluted with increasing concentrations of Buffer B (500 mM imidazole, 40 mM Tris pH 8 and 400 mM NaCl).
- SDS PAGE: Samples were prepared for SDS PAGE by adding 7 µL of SDS running buffer to 20 µL of the fractions of interest. 8-20 µL of each sample were run on a polyacrylamide gel against a molecular weight marker.
- Concentration: PHB depolymerase (phaZ 1) and PUR esterase (EstC2) were concentrated with 10 mM potassium phosphate buffer.
- Tris-HCl buffer ingredients: 1 litre of millicule water 10.5 g of NaCl (180 mM) 0.65 g of CaCl2 (5 mM) 1.7g of imidazole (25 mM) 6 g of Tris base (50 mM) Add HCl to bring the pH to 7.4
- Programme the spectrometer: Cuvette: 10 mm Wavelength: 405 nm Temperature: 37°C Measuring time: 10:00 min:sec Delay: 00:00 min:sec Interval: 00:30 min:sec
- Reagent preparation: Lyophilized powder proteinase K from Tritirachium album from Sigma-Aldrich was used, made into a 10 mg/ml stock solution with the buffer. The spectrometer was blanked with 1mL of buffer and 3 µL of proteinase K stock solution; this is equivalent to one unit of enzyme. We used N-Succinyl Ala-Ala-Pro-Leu p-nitroanilide (AAPLp-NA) from Sigma-Aldrich as a substrate analog. Make a stock solution with buffer (10 mg/ml). The reagents were incubated at 37°C just before use. The absorbance of each reaction mixture was measured at 405 nm, for 10 minutes at 30 second intervals. The reaction mixtures contained 3 µL of proteinase K stock solution and AAPLp-NA in Tris-HCl buffer to make final concentrations of 10 µM, 25 µM, 50 µM, 75 µM, 100 µM, 250 µM and 500 µM.
Proteinase K kinetic activity assay
MSDS▼
Chemical reagents
Some of the reagents we used were slightly toxic to human. In order to reduce the risks of using toxic reagents, we always wear gloves and labcoats. For some toxic reagents, we performed in fume cupboard. Click on the reagents to see the MSDS.
1. [http://www.sigmaaldrich.com/MSDS/MSDS/DisplayMSDSPage.do?country=GB&language=en&productNumber=363502&brand=ALDRICH&PageToGoToURL=http%3A%2F%2Fwww.sigmaaldrich.com%2Fcatalog%2Fproduct%2Faldrich%2F363502%3Flang%3Den Poly(R)-3-hydroxybutyric acid].
2. [http://www.sigmaaldrich.com/MSDS/MSDS/PleaseWaitMSDSPage.do?language=&country=GB&brand=SIAL&productNumber=P2308&PageToGoToURL=http://www.sigmaaldrich.com/catalog/product/sial/p2308?lang=en®ion=GB Proteinase K].
3. [http://www.sigmaaldrich.com/MSDS/MSDS/DisplayMSDSPage.do?country=GB&language=en&productNumber=54965&brand=ALDRICH&PageToGoToURL=http%3A%2F%2Fwww.sigmaaldrich.com%2Fcatalog%2Fproduct%2Faldrich%2F54965%3Flang%3Den Sodium 3-hydroxybutyrate].
4. [http://www.sigmaaldrich.com/MSDS/MSDS/DisplayMSDSPage.do?country=GB&language=en&productNumber=A3256&brand=SIGMA&PageToGoToURL=http%3A%2F%2Fwww.sigmaaldrich.com%2Fcatalog%2Fproduct%2Fsigma%2Fa3256%3Flang%3Den Arabinose].
5. [http://www.sigmaaldrich.com/MSDS/MSDS/DisplayMSDSPage.do?country=GB&language=en&productNumber=A8509&brand=ALDRICH&PageToGoToURL=http%3A%2F%2Fwww.sigmaaldrich.com%2Fcatalog%2Fproduct%2Faldrich%2Fa8509%3Flang%3Den Acetoacetate].
We are changing the pelB secretion tag to OsmY-fusion partner for better secretion
As seen in the Western Blot results, some of the enzymes designed for secretion were not secreted. These proteins may have been stuck in the periplasmic space. Thus we are optimising enzyme secretion by building a new construct with OsmY [http://parts.igem.org/Part:BBa_K892008 BBa_K892008] fusion for secretion. OsmY is naturally secreted from E.coli and will carry our PUR esterase enzyme with. Once in the culture medium, we think that the enzyme is going to be functional in the fusion form but we included a TEV site in between the domains that can be cleaved by TEV protease if needed.
The linker sequence we have designed between the domains is T G S E N L Y F Q G S (ACCGGCAGCGAGAACCTGTACTTCCAAGGCAGC) and includes the 7 amino acids of the TEV site as well as 4 other amino acids for flexibility.
This construct will be a substitute for [http://parts.igem.org/Part:BBa_K1149010 BBa_K1149010] and [http://parts.igem.org/Part:BBa_K1149008 BBa_K1149008] biobricks which are the PHB depolymerase PhaZ1 and ProteinaseK with the pelB seretion tag.
Proteinase K activity
The Western Blot results show that proteinase K was expressed, however, no activity was detected in a cell lysate assay and no proteinase K could be purified from the cells. The proteinase K cultures were induced overnight with 6 mM (final concentration) of arabinose. According to the literature, proteinase K self-digests [http://www.biomedcentral.com/1472-6750/7/16 (8)]. Perhaps the induction strength and time was too long. Next time we will reduce the time and concentration of induction for proteinase K.
 "
"


