Team:Edinburgh/Modeling/Modelling Results
From 2013.igem.org
Hristianita (Talk | contribs) |
Hristianita (Talk | contribs) m |
||
| (One intermediate revision not shown) | |||
| Line 3: | Line 3: | ||
<div class='content'> | <div class='content'> | ||
| + | ===Modelling Results=== | ||
== Effect of nutrient environment on growth rate == | == Effect of nutrient environment on growth rate == | ||
| Line 26: | Line 27: | ||
* The modified cells also have a plasmid for antibiotic resistance, and they are tested in the presence of this antibiotic to ensure that the population doesn't lose the plasmid. However, it is possible that even though the cells are resistant to the antibiotic, it might still slow down its growth rate. As future work, it would be good to perform an experiment which compares the growth rate of cells with the whole inserted circuit with those which have the antibiotic resistance but lack the ethanol producing gene. | * The modified cells also have a plasmid for antibiotic resistance, and they are tested in the presence of this antibiotic to ensure that the population doesn't lose the plasmid. However, it is possible that even though the cells are resistant to the antibiotic, it might still slow down its growth rate. As future work, it would be good to perform an experiment which compares the growth rate of cells with the whole inserted circuit with those which have the antibiotic resistance but lack the ethanol producing gene. | ||
| + | |||
== Effect of different nutrient environments on productivity == | == Effect of different nutrient environments on productivity == | ||
Latest revision as of 02:58, 5 October 2013
Contents |
Modelling Results
Effect of nutrient environment on growth rate
The model as it is assumes only one generic type of resource which is supposed to combine all resources that the cell needs. As such, we did not have a way to translate between different influx levels of this generic resource and the actual resource environments. We tried to perform growth rate experiments in the lab to study how LB medium + different glucose concentrations affect growth rate and we expected to be able to create a conversion table from that. We also expected to be able to test the predictions of the model regarding the effect of different nutrient environments on the growth rate. However, we started the lab experiments really late, and we only had time for one run. The results showed too high variability to be usable - probably because the LB medium is very rich anyway and adding a bit of glucose to it doesn't change a lot. So we didn't manage to create this conversion table.
However, we still used the whole cell model to make several types of predictions:
Effect of gene modifications on growth rate
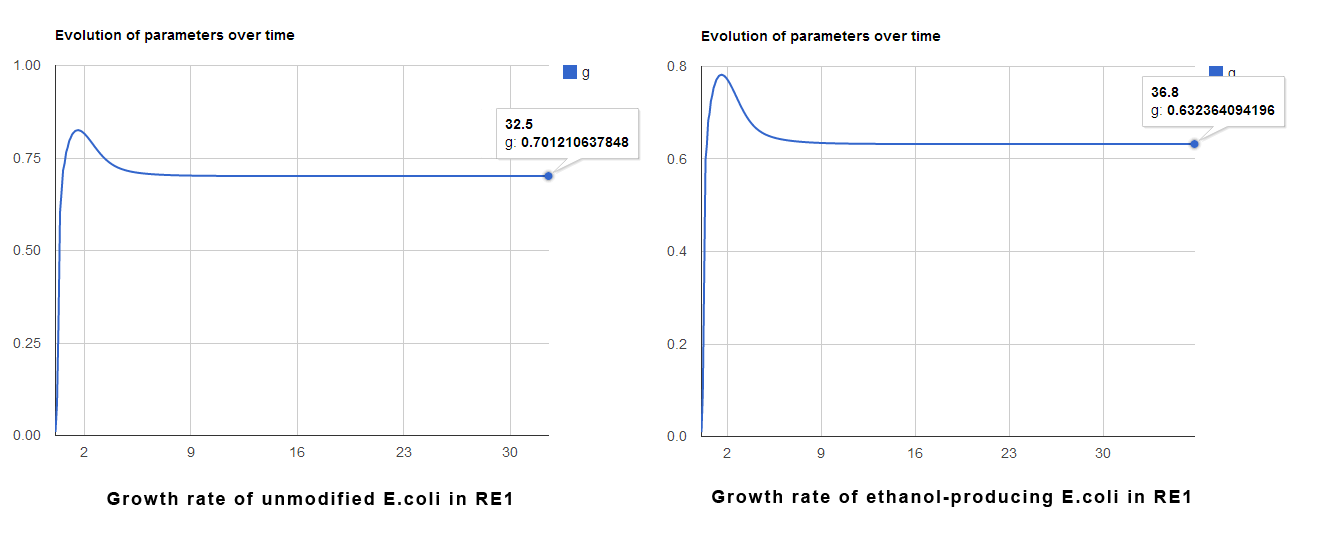
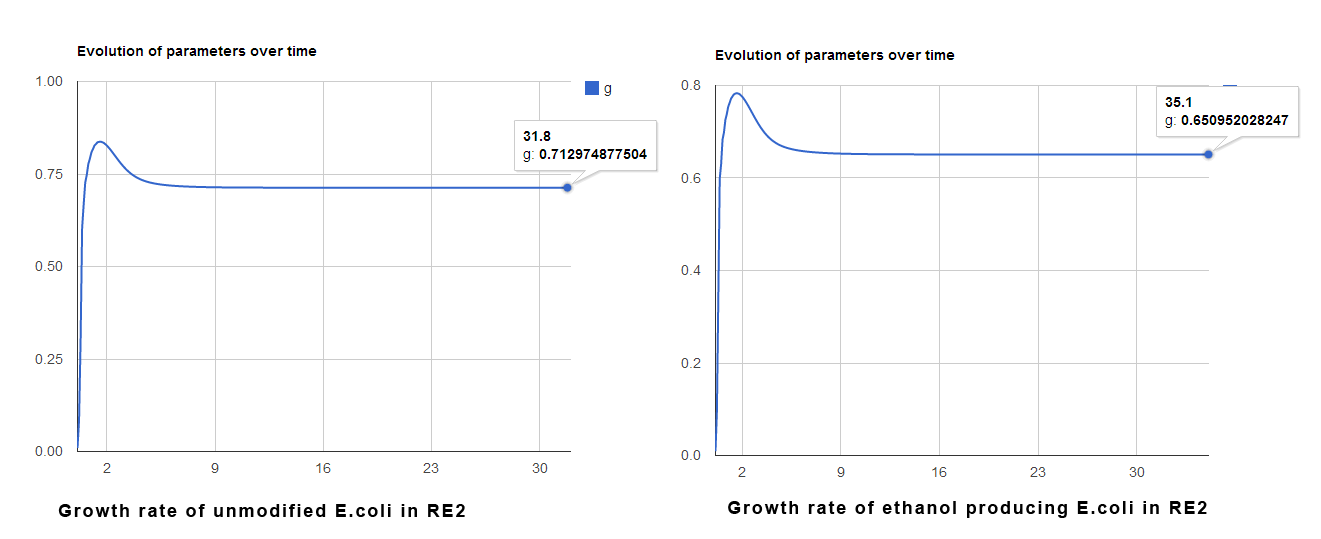
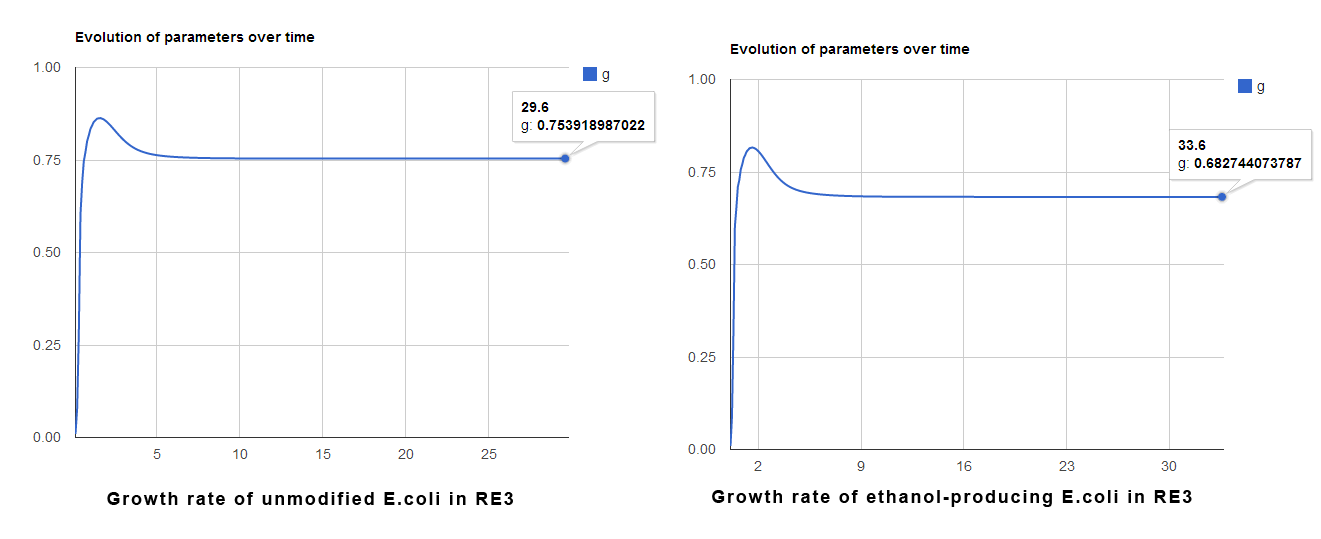
We predicted the difference between the growth rate of the unmodified cells and the cells with the plasmid inserted. We did this for three different nutrient environments (represented by different resource influx rates for the model). The resource influx rates were randomly picked and are not aimed to correspond to actual resource environments.
The graphs below show the evolution of the growth rate over the time of the simulation from the initial state until steady state is reached. The number shown is the final value of the growth rate at steady state. On the left we can see the results for the unmodified cells, and on the right are the results for the cells modified to produce bioethanol. The results are shown for three different nutrient environments (RE1, RE2, RE3). RE1 is the least reach environment, RE2 is medium, and RE3 corresponds to the highest resource influx rate.
As we can see, in all cases, the modified cells are predicted to have a smaller growth rate, by approximately 10%.
We tried to verify these results by experiments in the lab as well. However, the results showed that the modified cells grew several times slower than the unmodified cells. There could be two reasons for that.
- The model may be underestimating the effect of ethanol production on the cell. It is possible that ethanol production draws upon more resources than is estimated by the model. Additionally, the produces ethanol is toxic to the cell - and this is not captured by the model.
- The modified cells also have a plasmid for antibiotic resistance, and they are tested in the presence of this antibiotic to ensure that the population doesn't lose the plasmid. However, it is possible that even though the cells are resistant to the antibiotic, it might still slow down its growth rate. As future work, it would be good to perform an experiment which compares the growth rate of cells with the whole inserted circuit with those which have the antibiotic resistance but lack the ethanol producing gene.
Effect of different nutrient environments on productivity
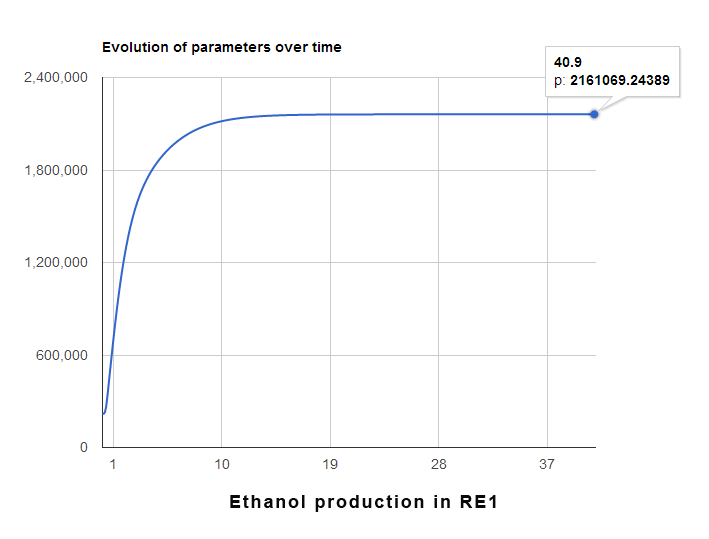
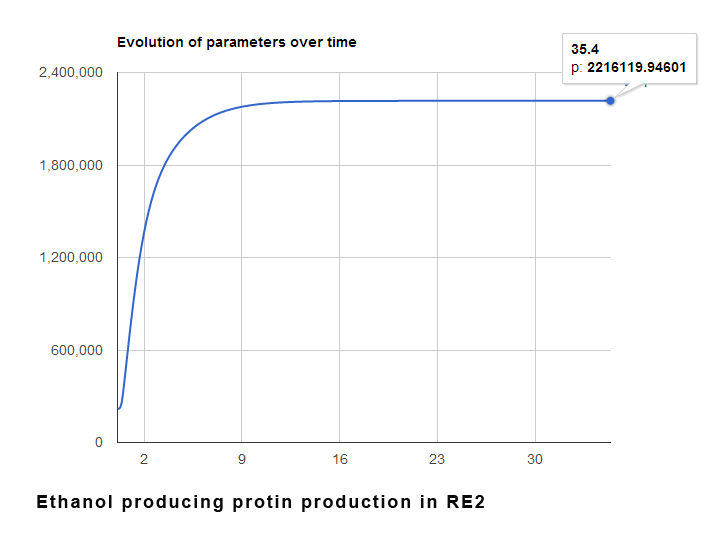
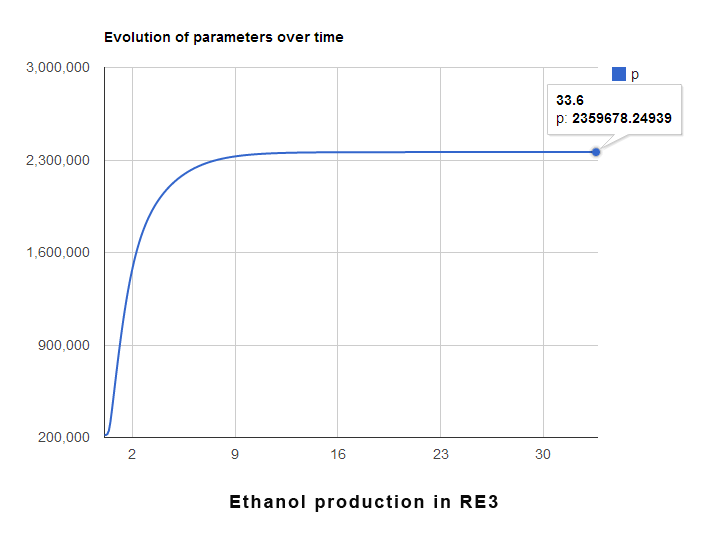
We used the model to predict how different nutrient environments would change the amount of the gene product produced by the cell (i.e. its productivity). We can see below the evolution of the internal level of the gene product as a function of time until steady state is reached. The results are for the same three resource rates as in the previous experiment. However, because we have no way to relate those resource influx rates to real nutrient environments, these predictions have little practical use unless a conversion table is obtained.
We can see that the model predicts the amount of protein produced would increase with increasing the resource influx rate - an expected effect.

| 
| | | | 
|
| This iGEM team has been funded by the MSD Scottish Life Sciences Fund. The opinions expressed by this iGEM team are those of the team members and do not necessarily represent those of MSD | |||||
 "
"

