Team:Goettingen/Team/DAC
From 2013.igem.org
FMCommmichau (Talk | contribs) |
(→Results and Discussion) |
||
| (4 intermediate revisions not shown) | |||
| Line 57: | Line 57: | ||
The truncated DacA protein ([http://parts.igem.org/Part:BBa_K1045003 BBa_K1045003]) was extended with an N-terminal ''Step''-tag allowing the rapid purification using the ''Strep''-tag:Streptactin purification system. Synthesis of our protein is driven by a T7 promoter. This promoter is recognized by the T7 polymerase, which is encoded in the genome of the <i>E. coli</i> strain BL21. Synthesis of the T7 polymerase can be controlled by Isopropyl-β-D-thiogalactopyranoside (IPTG). The generated plasmid was then used to transform the <i>E. coli</i> strain BL21, which is a powerful strain for synthesis of recombinant proteins. In contrast to Gram-positive bacteria, the Gram-negative bacterium ''E. coli'' does not produce c-di-AMP and growth is not affected by the signaling molecule. | The truncated DacA protein ([http://parts.igem.org/Part:BBa_K1045003 BBa_K1045003]) was extended with an N-terminal ''Step''-tag allowing the rapid purification using the ''Strep''-tag:Streptactin purification system. Synthesis of our protein is driven by a T7 promoter. This promoter is recognized by the T7 polymerase, which is encoded in the genome of the <i>E. coli</i> strain BL21. Synthesis of the T7 polymerase can be controlled by Isopropyl-β-D-thiogalactopyranoside (IPTG). The generated plasmid was then used to transform the <i>E. coli</i> strain BL21, which is a powerful strain for synthesis of recombinant proteins. In contrast to Gram-positive bacteria, the Gram-negative bacterium ''E. coli'' does not produce c-di-AMP and growth is not affected by the signaling molecule. | ||
| - | In order to analyze the DAC activity ''in vivo'', the ''E. coli'' clones | + | In order to analyze the DAC activity ''in vivo'', DAC production by the ''E. coli'' clones was induced by adding IPTG. The cells were then lysed to extract c-di-AMP from the cells. |
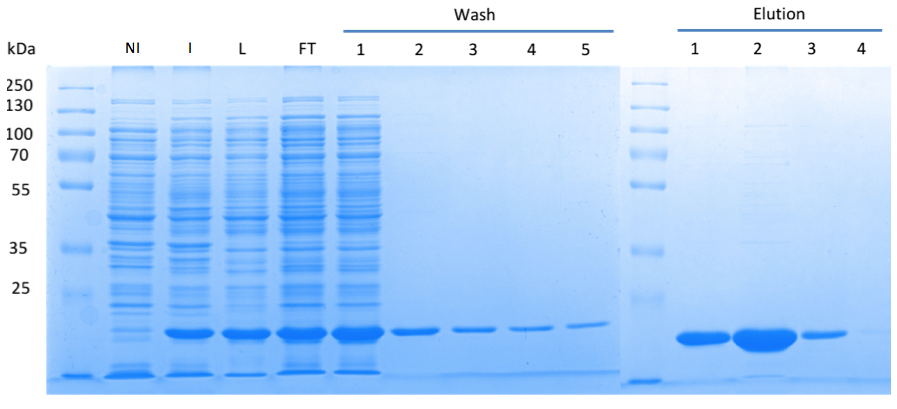
By performing the SDS PAGE, we could nicely show that the desired protein was well-produced (Fig. 1). Furthermore, the presence of c-di-AMP in the supernatant of the lysed bacteria was confirmed using LC-MS/MS. Thus, we can conclude that the truncated DacA protein codes for an DAC domain that is active ''in vivo''. | By performing the SDS PAGE, we could nicely show that the desired protein was well-produced (Fig. 1). Furthermore, the presence of c-di-AMP in the supernatant of the lysed bacteria was confirmed using LC-MS/MS. Thus, we can conclude that the truncated DacA protein codes for an DAC domain that is active ''in vivo''. | ||
| Line 89: | Line 89: | ||
<html><a href="https://static.igem.org/mediawiki/2013/a/a8/Goe-dac-fig-4.png" target="_blank"><img src="https://static.igem.org/mediawiki/2013/a/a8/Goe-dac-fig-4.png" width="750"></a></html> | <html><a href="https://static.igem.org/mediawiki/2013/a/a8/Goe-dac-fig-4.png" target="_blank"><img src="https://static.igem.org/mediawiki/2013/a/a8/Goe-dac-fig-4.png" width="750"></a></html> | ||
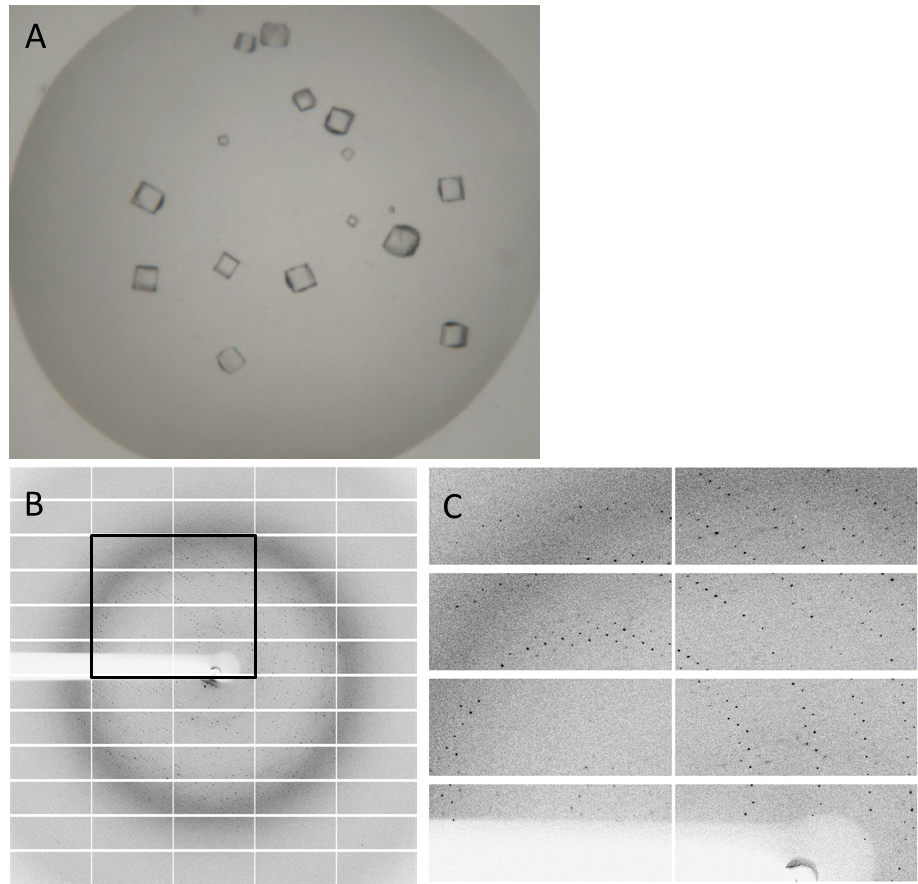
| - | Fig. 4. '''Crystals and diffraction pattern.''' Nice crystals were obtained with a medium concentration of alcohol and other supplements (confidential :-])'''(A).''' X-ray diffraction image of the DacA DAC domain crystals'''(B)'''; the highlighted box is shown enlarged '''(C)'''. The dataset was measured at the EMBL Hamburg Beamline P13 | + | Fig. 4. '''Crystals and diffraction pattern.''' Nice crystals were obtained with a medium concentration of alcohol and other supplements (confidential :-]) '''(A).''' X-ray diffraction image of the DacA DAC domain crystals '''(B)'''; the highlighted box is shown enlarged '''(C)'''. The dataset was measured at the EMBL Hamburg Beamline P13 in the PETRA III synchrotron on the DESY campus. |
https://static.igem.org/mediawiki/2013/3/36/Goe-dac-fig-5.png | https://static.igem.org/mediawiki/2013/3/36/Goe-dac-fig-5.png | ||
| Line 95: | Line 95: | ||
Fig. 6.''' Protein structure of the DacA DAC domain.''' (A, B) Ribbon model of the DAC domain in its ATP-bound state. (C, D) Surface structure of the DAC domain and the ATP-binding pocket. (E) Magnified view into the ATP-binding pocket | Fig. 6.''' Protein structure of the DacA DAC domain.''' (A, B) Ribbon model of the DAC domain in its ATP-bound state. (C, D) Surface structure of the DAC domain and the ATP-binding pocket. (E) Magnified view into the ATP-binding pocket | ||
| + | <html><object width="420" height="315"><param name="movie" value="//www.youtube.com/v/9BQOEIVsF-Y?hl=zh_CN&version=3&rel=0"></param><param name="allowFullScreen" value="true"></param><param name="allowscriptaccess" value="always"></param><embed src="//www.youtube.com/v/9BQOEIVsF-Y?hl=zh_CN&version=3&rel=0" type="application/x-shockwave-flash" width="420" height="315" allowscriptaccess="always" allowfullscreen="true"></embed></object></html> | ||
'''References''' | '''References''' | ||
Latest revision as of 09:45, 28 October 2013
 "
"


