Team:SydneyUni Australia/Modelling Output
From 2013.igem.org
Jbergfield (Talk | contribs) m (fixed one reference) |
|||
| (4 intermediate revisions not shown) | |||
| Line 8: | Line 8: | ||
| - | The model was run using MATLAB through the ODE solver ODE45. | + | The model was run using MATLAB through the ODE solver ODE45. |
| + | |||
| + | ===='''initial conditions'''':==== | ||
<center> | <center> | ||
{| class="wikitable" | {| class="wikitable" | ||
| Line 51: | Line 53: | ||
|- | |- | ||
| - | |A, B, C, D, E || 25.55 mM || Estimation from literature [ | + | |A, B, C, D, E || 25.55 mM || Estimation from literature [10], as described in [https://2013.igem.org/Team:SydneyUni_Australia/Modelling_Validation#protein Validation]. |
|- | |- | ||
| Line 61: | Line 63: | ||
===='''Physical conditions:'''==== | ===='''Physical conditions:'''==== | ||
| - | The model assumes that the cells are present in minimal media prior to DCA exposure and that the DCA is instantaneously and evenly present at time = 0 min in a solution of homogeneously mixed cells | + | The model assumes that the cells are present in minimal media prior to DCA exposure and that the DCA is instantaneously and evenly present at time = 0 min in a solution of homogeneously mixed cells. |
Many other assumptions have been made in the construction of the model and are outlined in the [https://2013.igem.org/Team:SydneyUni_Australia/Modelling_Model mathematical model] section. | Many other assumptions have been made in the construction of the model and are outlined in the [https://2013.igem.org/Team:SydneyUni_Australia/Modelling_Model mathematical model] section. | ||
| Line 127: | Line 129: | ||
[[File: DCAcominin.png|950px]] | [[File: DCAcominin.png|950px]] | ||
| - | '''Graph 1''': The blue line represents how the concentration of DCA in solution (extracellular) decreases due to the action of our DCA degraders | + | '''Graph 1''': The blue line represents how the concentration of DCA in solution (extracellular) decreases due to the action of our DCA degraders. One can see that an initial concentration of 2 x 10<sup>8</sup> cells/mL completely removes the DCA with a concentration 1 mM in (roughly) 150 min. |
<div id="graph2"></div> | <div id="graph2"></div> | ||
| - | '''The | + | '''The rate at which the intracellular concentration of the metabolites change over time:''' |
[[File: intermediates1111.png|950px]] | [[File: intermediates1111.png|950px]] | ||
| Line 143: | Line 145: | ||
<div id="graph3"></div> | <div id="graph3"></div> | ||
| - | '''Rescaling the graph once again: the rate at which the metabolic | + | '''Rescaling the graph once again: the rate at which the metabolic intermediates change over time.''' |
[[File: intermediates2222.png|950px]] | [[File: intermediates2222.png|950px]] | ||
| Line 177: | Line 179: | ||
[[File: Igem_ode_22.png|450px]] | [[File: Igem_ode_22.png|450px]] | ||
| - | + | Again, this system of ODE has been explained and justified in the [https://2013.igem.org/Team:SydneyUni_Australia/Modelling_Model#ODE previous section]. Below it is converted to MATLAB, allowing a computer to generate a visual representation of the model. | |
====Raw MATLAB code:==== | ====Raw MATLAB code:==== | ||
| Line 228: | Line 230: | ||
<div id="graph6"></div> | <div id="graph6"></div> | ||
| - | '''The | + | '''The rate at which the intracellular concentration of the metabolites change over time:''' |
[[File: intermediates111.png|950px]] | [[File: intermediates111.png|950px]] | ||
| Line 263: | Line 265: | ||
<div id="graph9"></div> | <div id="graph9"></div> | ||
| - | '''Rescaling | + | '''Rescaling shows a lag effect on cell growth:''' |
[[File: cellscellscelllllllllllls.png|950px]] | [[File: cellscellscelllllllllllls.png|950px]] | ||
| - | '''Graph 9''': The blue line represents the increase of cells due to the presence of intracellular glycolate. This graph is a rescaling of graph 8 to show the | + | '''Graph 9''': The blue line represents the increase of cells due to the presence of intracellular glycolate. This graph is a rescaling of graph 8 to show the initial lag in cellular growth. |
Latest revision as of 00:42, 29 October 2013


Contents |
Running the Model
The model was run using MATLAB through the ODE solver ODE45.
initial conditions':
| Constant | Value | Comment |
|---|---|---|
| KM A | 0.530 mM | From literature [1] |
| kcat A | 3.3 s-1 | From literature [1] |
| KM B | 0.940 mM | From literature [2] |
| kcat B | 0.0871 s-1 | From literature [2] |
| KM C | 7.2 mM | From literature [3] |
| kcat c | 89.8 s-1 | From literature [3] |
| KM D | 0.160 mM | From literature [4] |
| kcat D | 0.600 s-1 | From literature [4] |
| KM E | 20 mM | From literature [5] |
| kcat E | 25.4 s-1 | From literature [5] |
| β, γ, δ & ε | 0 mM | Not naturally present in cells. |
| αout | 1 mM | Initial concentration of DCA in solution (arbitrary) |
| αin | 0.001 mM | Initial concentration of DCA in cell |
| A, B, C, D, E | 25.55 mM | Estimation from literature [10], as described in Validation. |
| 2 x 10⁸ cells / mL | Initial cell concentration which allows appropriate growth |
Physical conditions:
The model assumes that the cells are present in minimal media prior to DCA exposure and that the DCA is instantaneously and evenly present at time = 0 min in a solution of homogeneously mixed cells. Many other assumptions have been made in the construction of the model and are outlined in the mathematical model section.
Flux rate:
By using the constants summarised in the previous section the flux, J, took the value (alongside the bacterial surface area, S):
The Non-monooxygenase Pathway
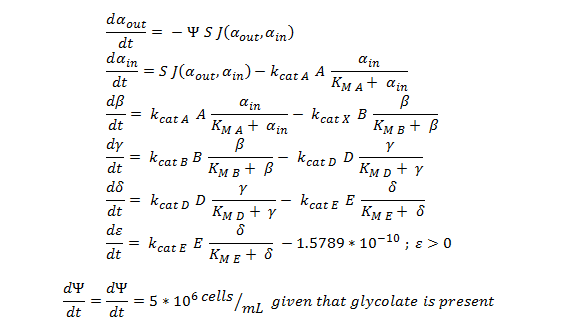
Summary of the ODE:
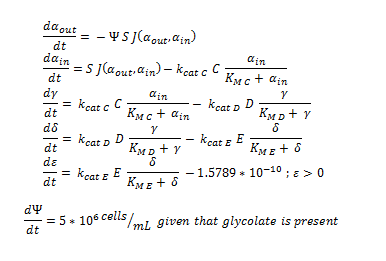
This system of ODE has been explained and justified in the previous section. It has been converted into MATLAB code in order to run the model, allowing a computer to generate the graphs below.
Raw MATLAB code:
function dy = nop450(t,y)

dy=zeros(7,1);

dy(1)= -y(7)*(6*10^(-12))*0.0463067*(y(1)-y(2));
dy(2)= ((6*10^(-12))*0.0463067*(y(1)-y(2)))-3.3*25.55*(y(2)/(0.53+y(2)));
dy(3)= 3.3*25.55*(y(2)/(0.53+y(2)))-0.0871*25.55*(y(3)/(0.94+y(3)));
dy(4)= .0871*25.55*(y(3)/(0.94+y(3)))- 0.6*25.55*(y(4)/(0.16+y(4)));
dy(5)= 0.6*25.55*(y(4)/(0.16+y(4))) - 25.4*25.55*(y(5)/(20+y(5)));

   if y(6) >  2*10^(-10)
      dy(6)= 25.4*25.55*(y(5)/(20+y(5))) -1.5789*10^(-10)
   else
       dy(6) = 25.4*25.55*(y(5)/(20+y(5)))
   end

   if y(6) > 0.0005
        if y(7) > 1.6*10^11
            dy(7)=0
        else
            dy(7) = 5*10^6
        end
   else
        dy(7) = 0
   end

end
MATLAB output:
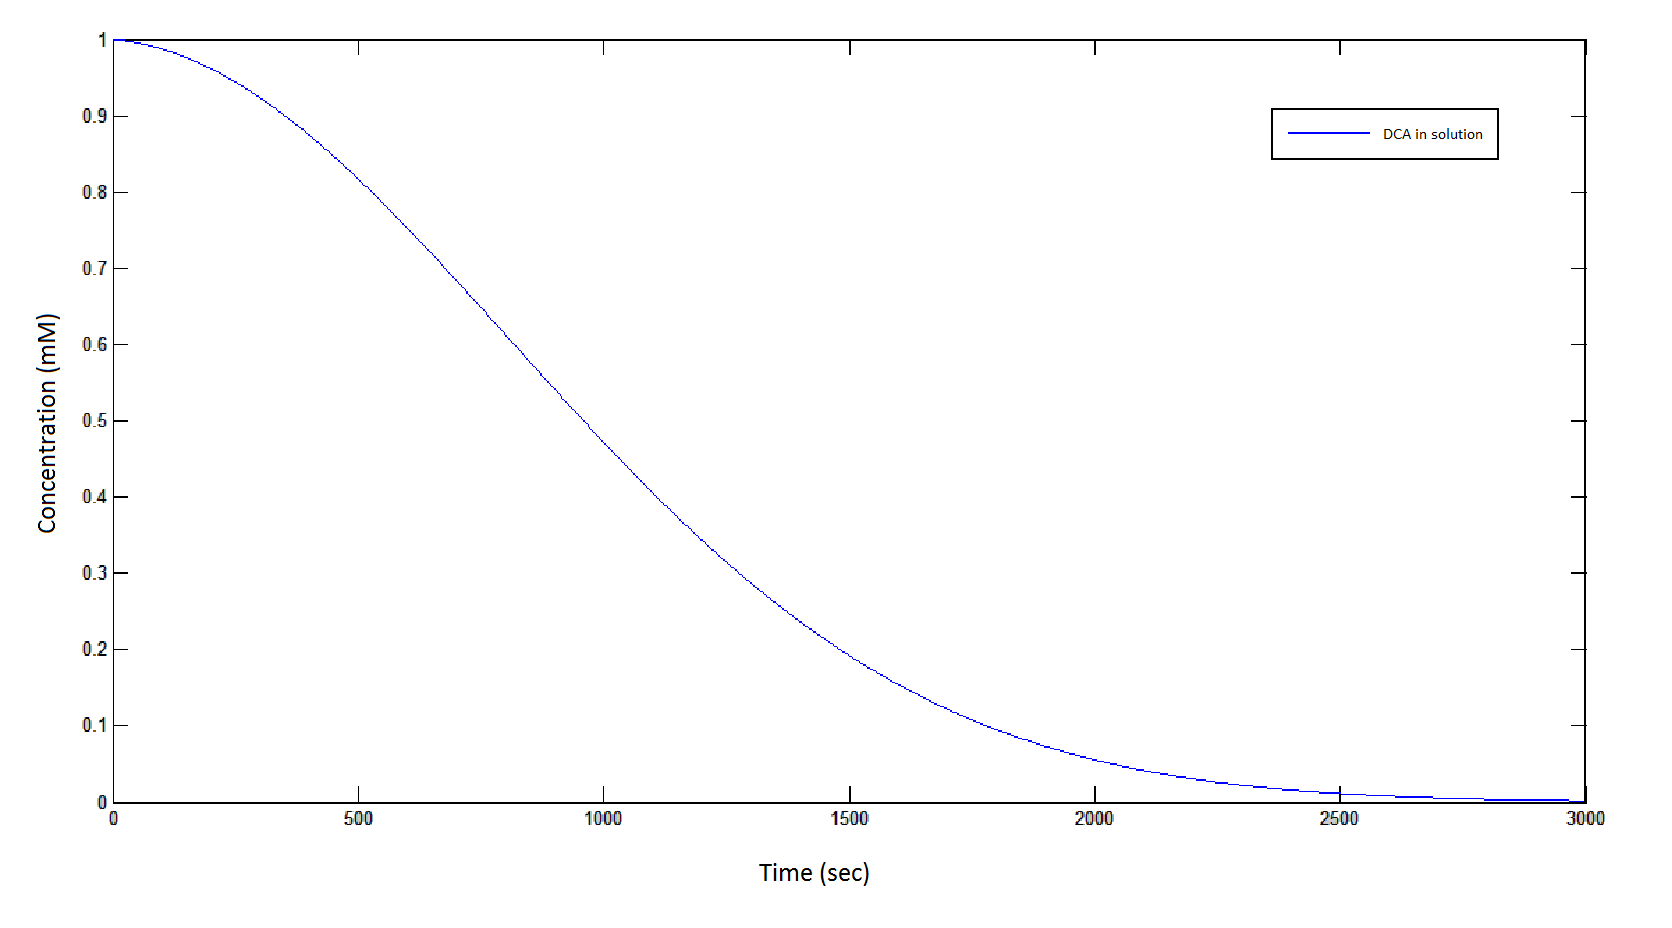
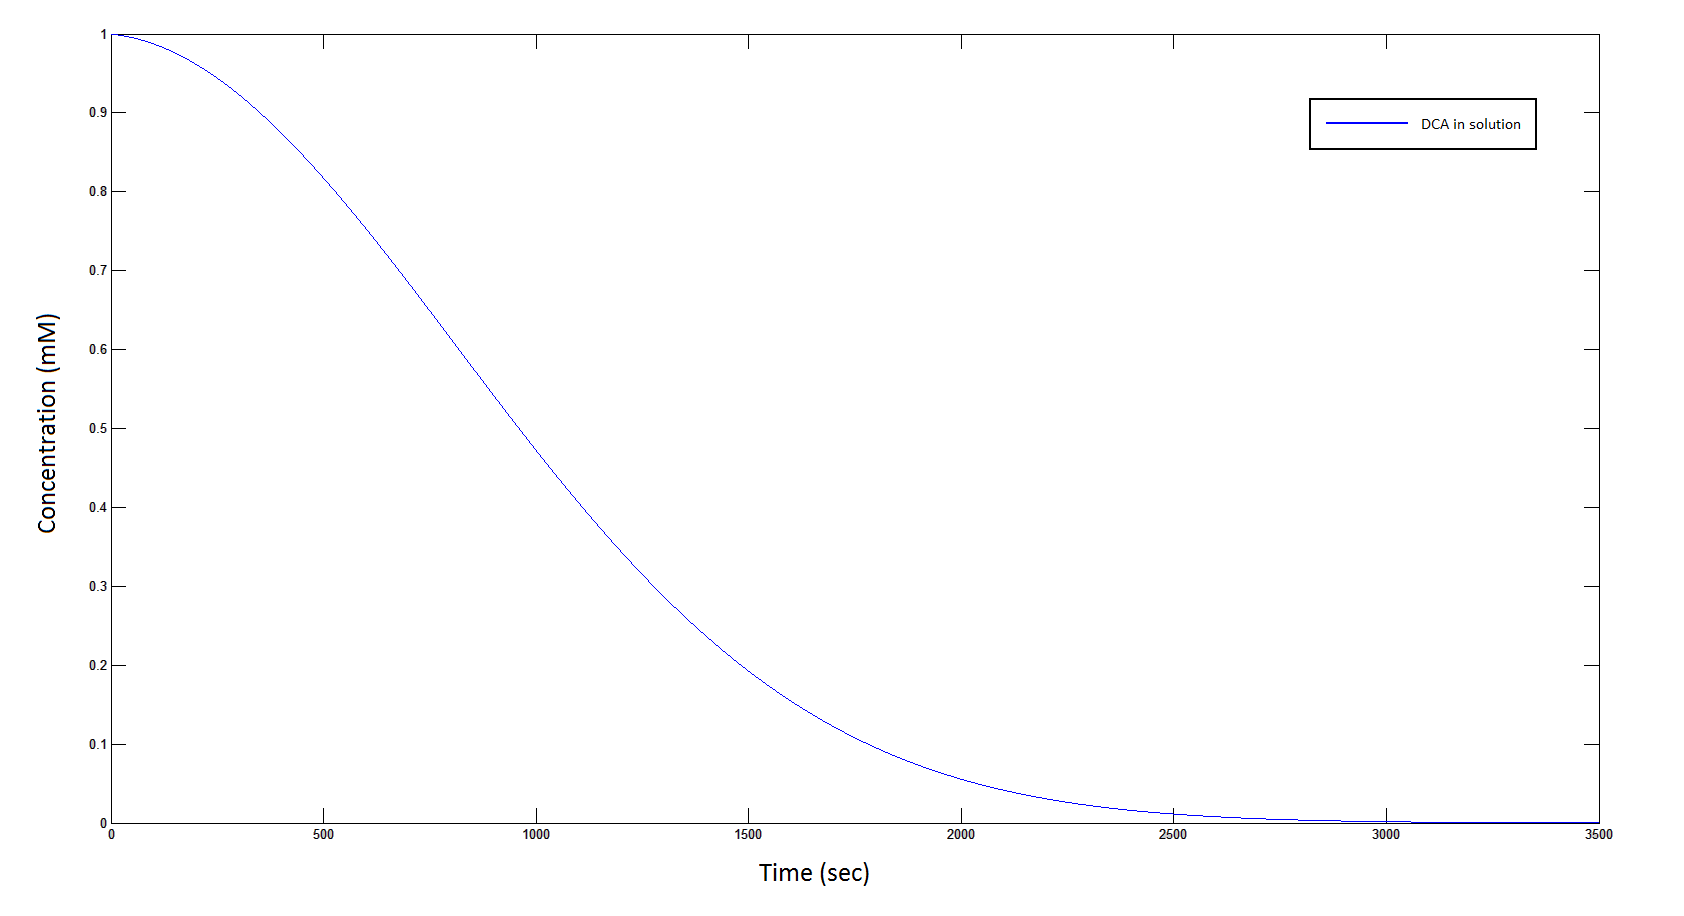
The rate at which DCA is removed in solution:
Graph 1: The blue line represents how the concentration of DCA in solution (extracellular) decreases due to the action of our DCA degraders. One can see that an initial concentration of 2 x 10⁸ cells/mL completely removes the DCA with a concentration 1 mM in (roughly) 150 min.
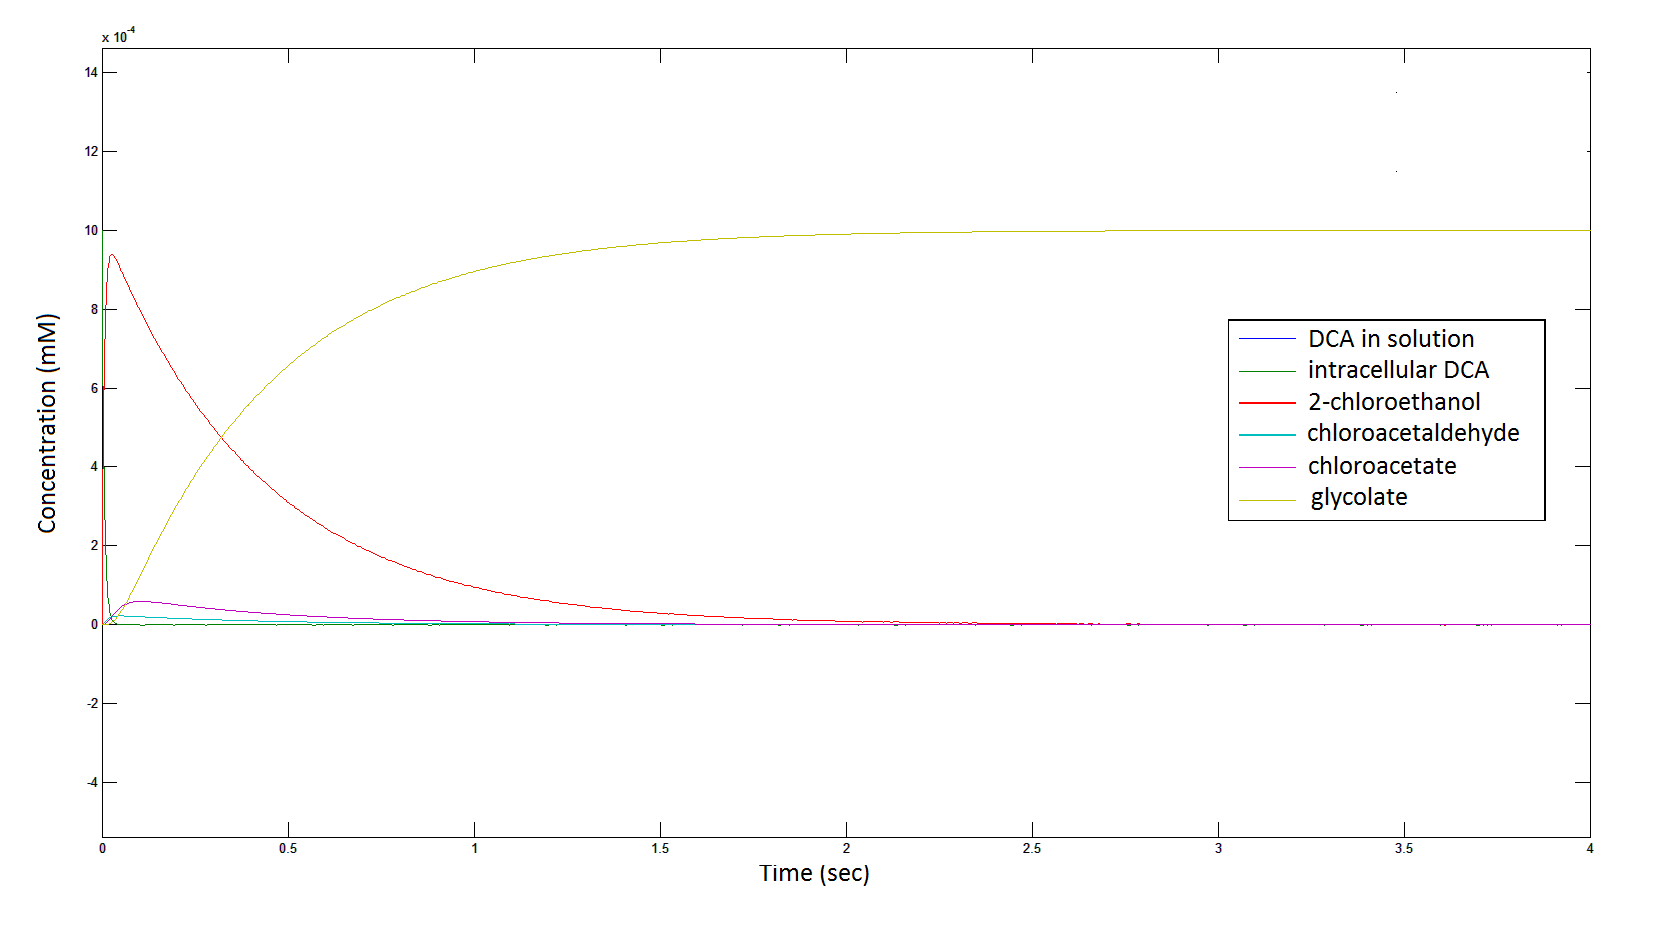
The rate at which the intracellular concentration of the metabolites change over time:
Graph 2: Each line represents the concentration of each of the metabolites. This graph is simply a rescaling of graph 1. Note: the glycolate won’t accumulate in the cell because it is metabolised. The model had glycolate as the final product and can be used to show how the presence of glycolate can lead to cell growth.
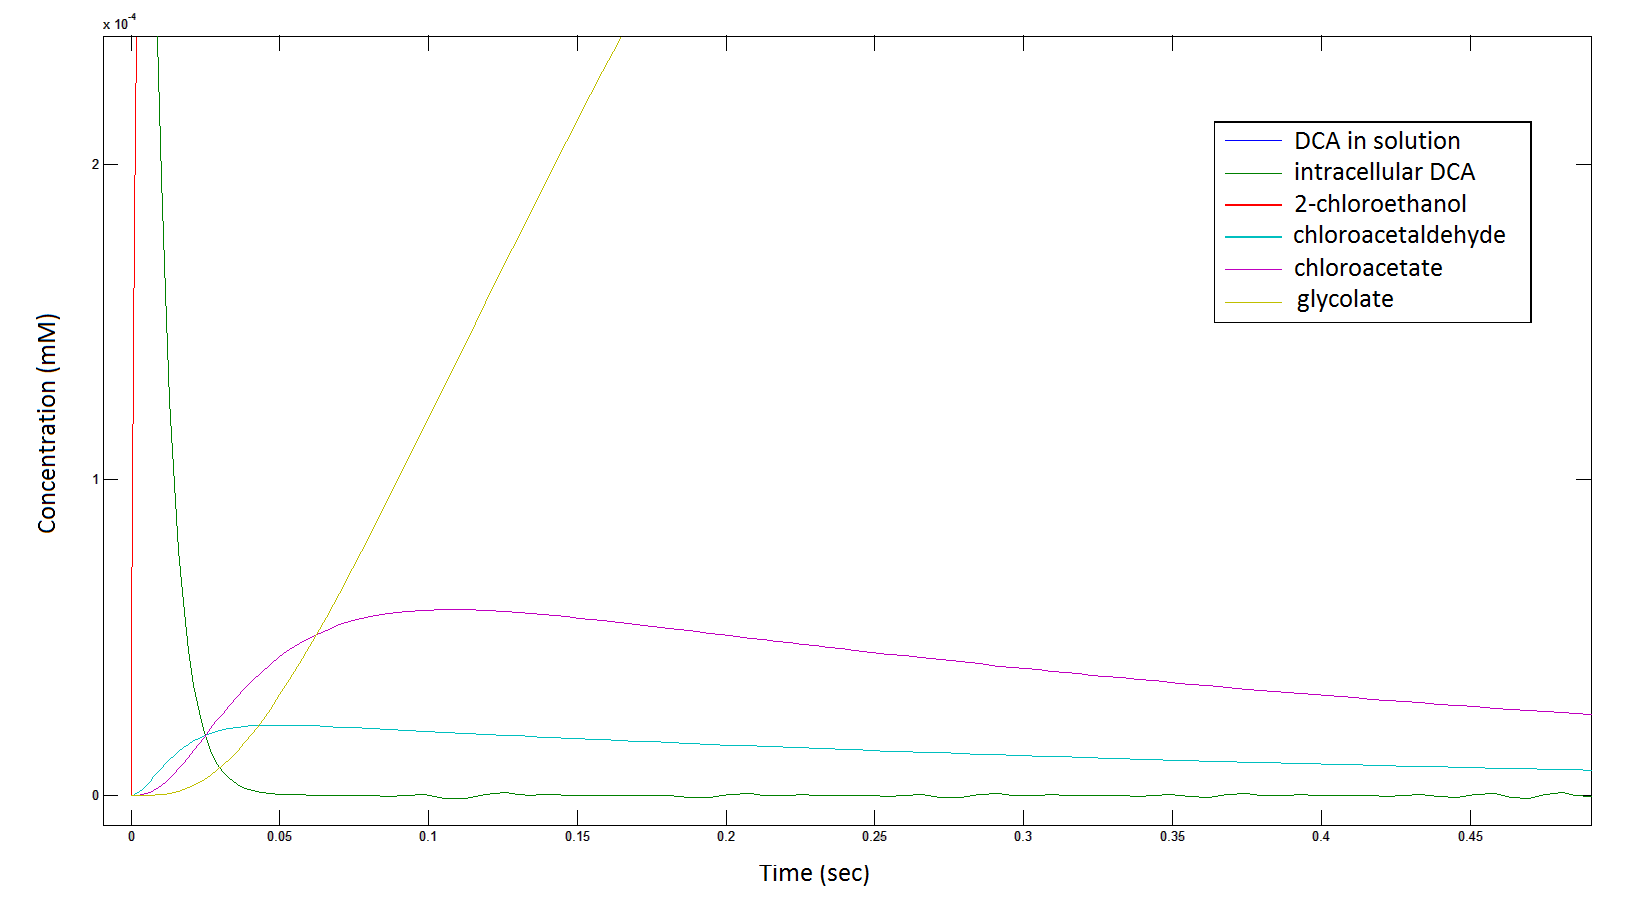
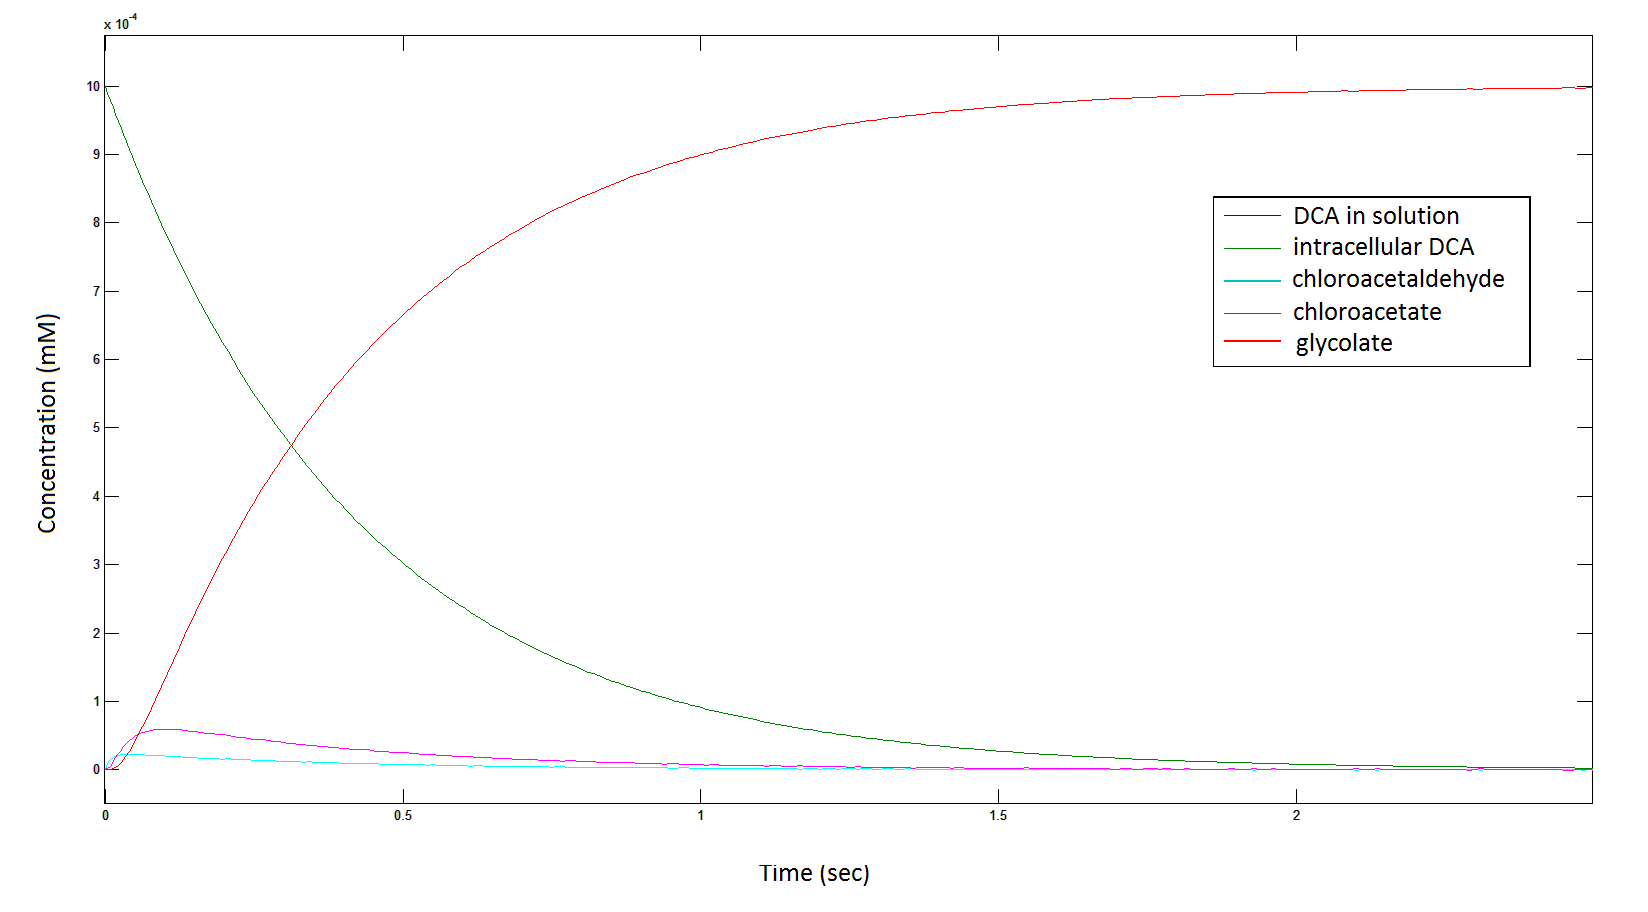
Rescaling the graph once again: the rate at which the metabolic intermediates change over time.
Graph 3: Each line represents the concentration of each of the metabolites . This graph is simply a rescaling of graph 1 and 2.
The rate at which the cells grow over time:
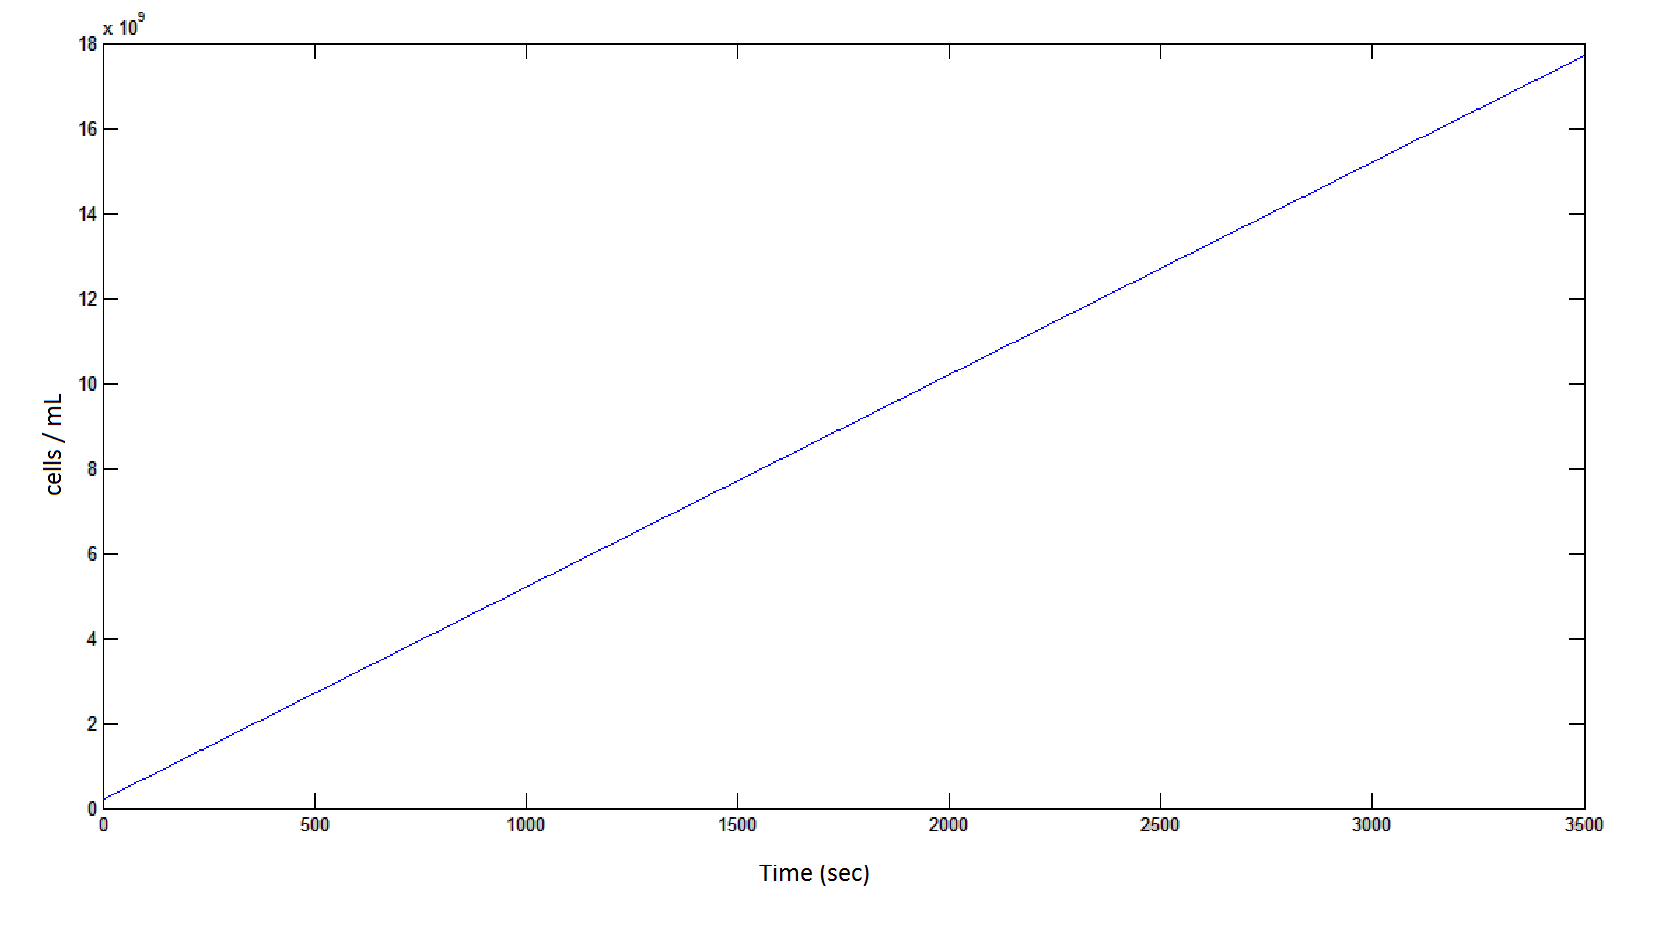
Graph 4: the blue line represents the linear increase of cells due to the presence of intracellular glycolate.
The Monooxygenase Pathway
ODE overview:
Again, this system of ODE has been explained and justified in the previous section. Below it is converted to MATLAB, allowing a computer to generate a visual representation of the model.
Raw MATLAB code:
function dy = p450(t,y)

dy=zeros(6,1);

dy(1)= -y(6)*(6*10^(-12))*0.0463067*(y(1)-y(2));
dy(2)= ((6*10^(-12))*0.0463067*(y(1)-y(2))) - 0.0113*25.55*(y(2)/(.12+y(2)));
dy(3) = 0.0113*25.55*(y(2)/(.12+y(2))) - 0.6*25.55*(y(3)/(0.16+y(3)));
dy(4)= 0.6*25.55*(y(3)/(0.16+y(3))) - 25.4*25.55*(y(4)/(20+y(4)));


   if y(5) >  2*10^(-10)
      dy(5)= 25.4*25.55*(y(4)/(20+y(4))) -1.5789*10^(-10)
   else
       dy(5) = 25.4*25.55*(y(4)/(20+y(4)))
   end

   if y(5) > 0.0005
        if y(6) > 1.6*10^11
            dy(6)=0
        else
            dy(6) = 5*10^6
        end
   else
        dy(6) = 0
   end

end
MATLAB output:
The rate at which DCA is removed in solution:
Graph 5: The blue line represents how the concentration of DCA in solution (extracellular) decreases due to the action of our DCA degraders.
The rate at which the intracellular concentration of the metabolites change over time:
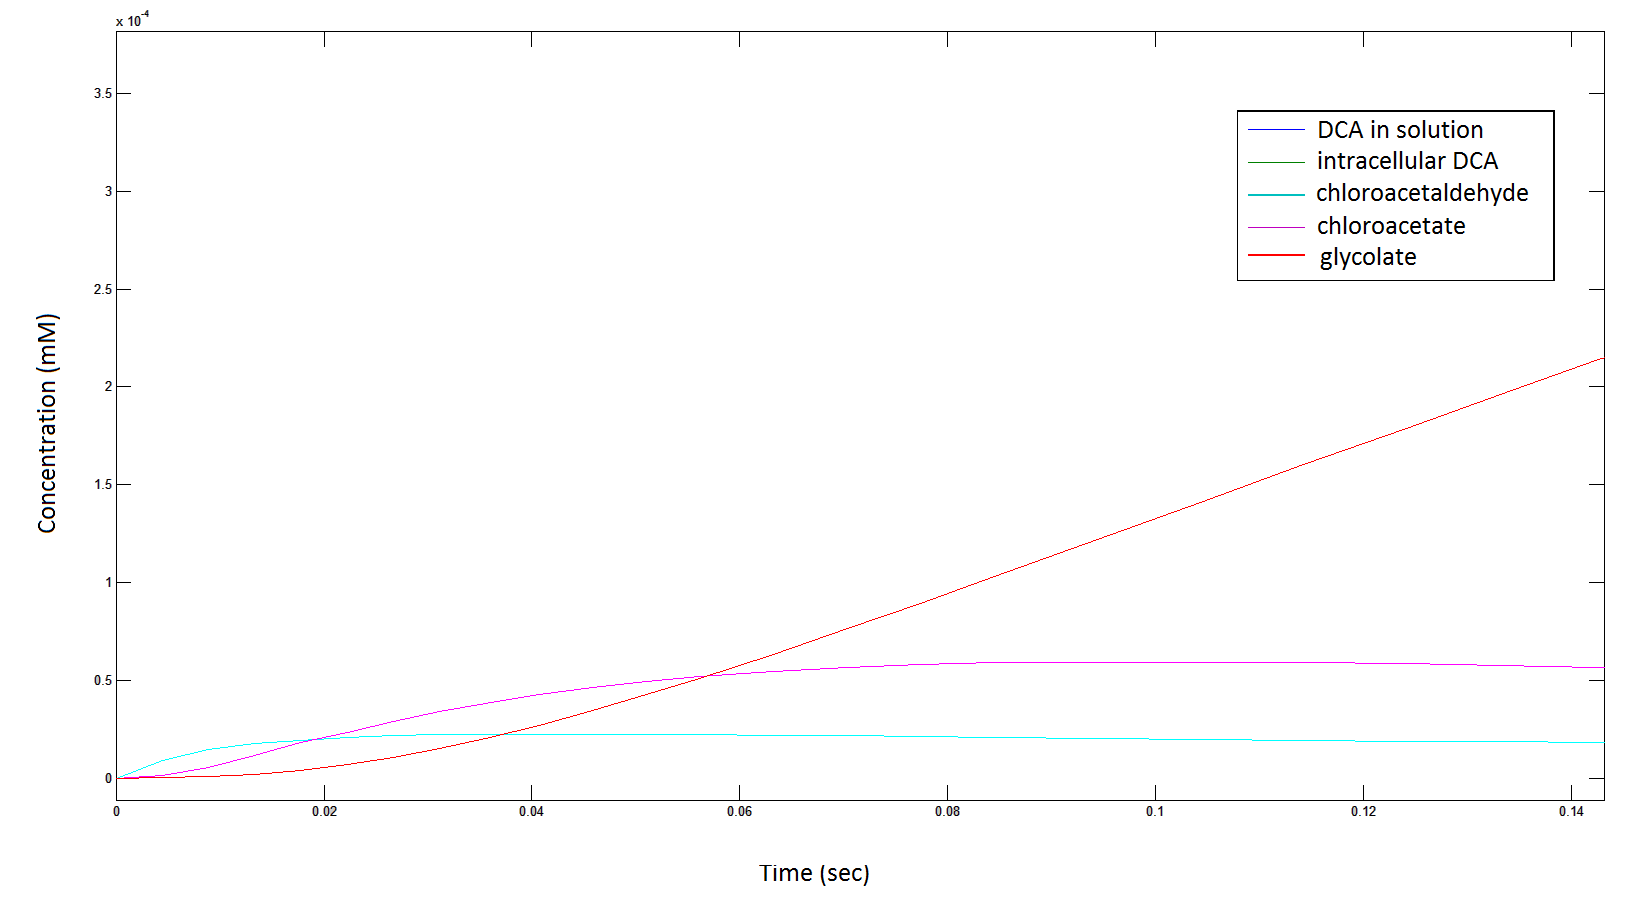
Graph 6: Each line represents the intracellular concentration of each of the metabolites over time within a single cell. The colour associated with each metabolite is depicted in the figure legend. This graph is simply a rescaling of graph 5.
Rescaling the graph once again: the rate at which the metabolic intermediate change over time.
Graph 7: Again, each line represents the intracellular concentration of each of the metabolites over time within a single cell. This graph is simply a rescaling of graph 5 and 6.
The rate at which the cells grow over time:
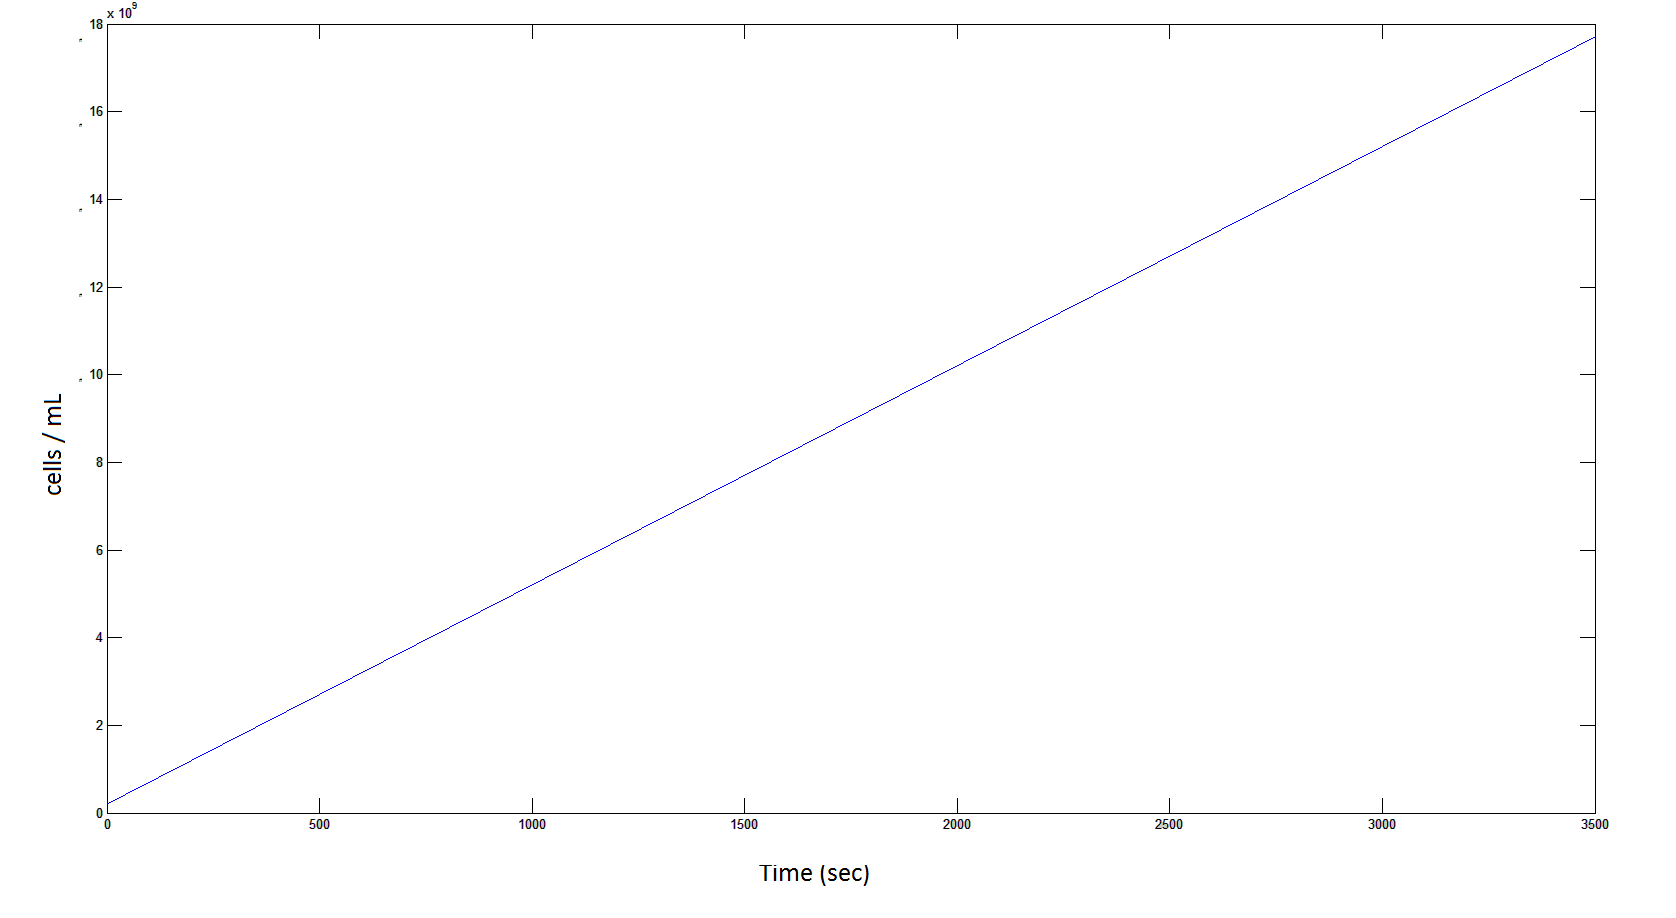
Graph 8: The blue line represents the linear increase of the total number of cells due to the presence of intracellular glycolate.
Rescaling shows a lag effect on cell growth:
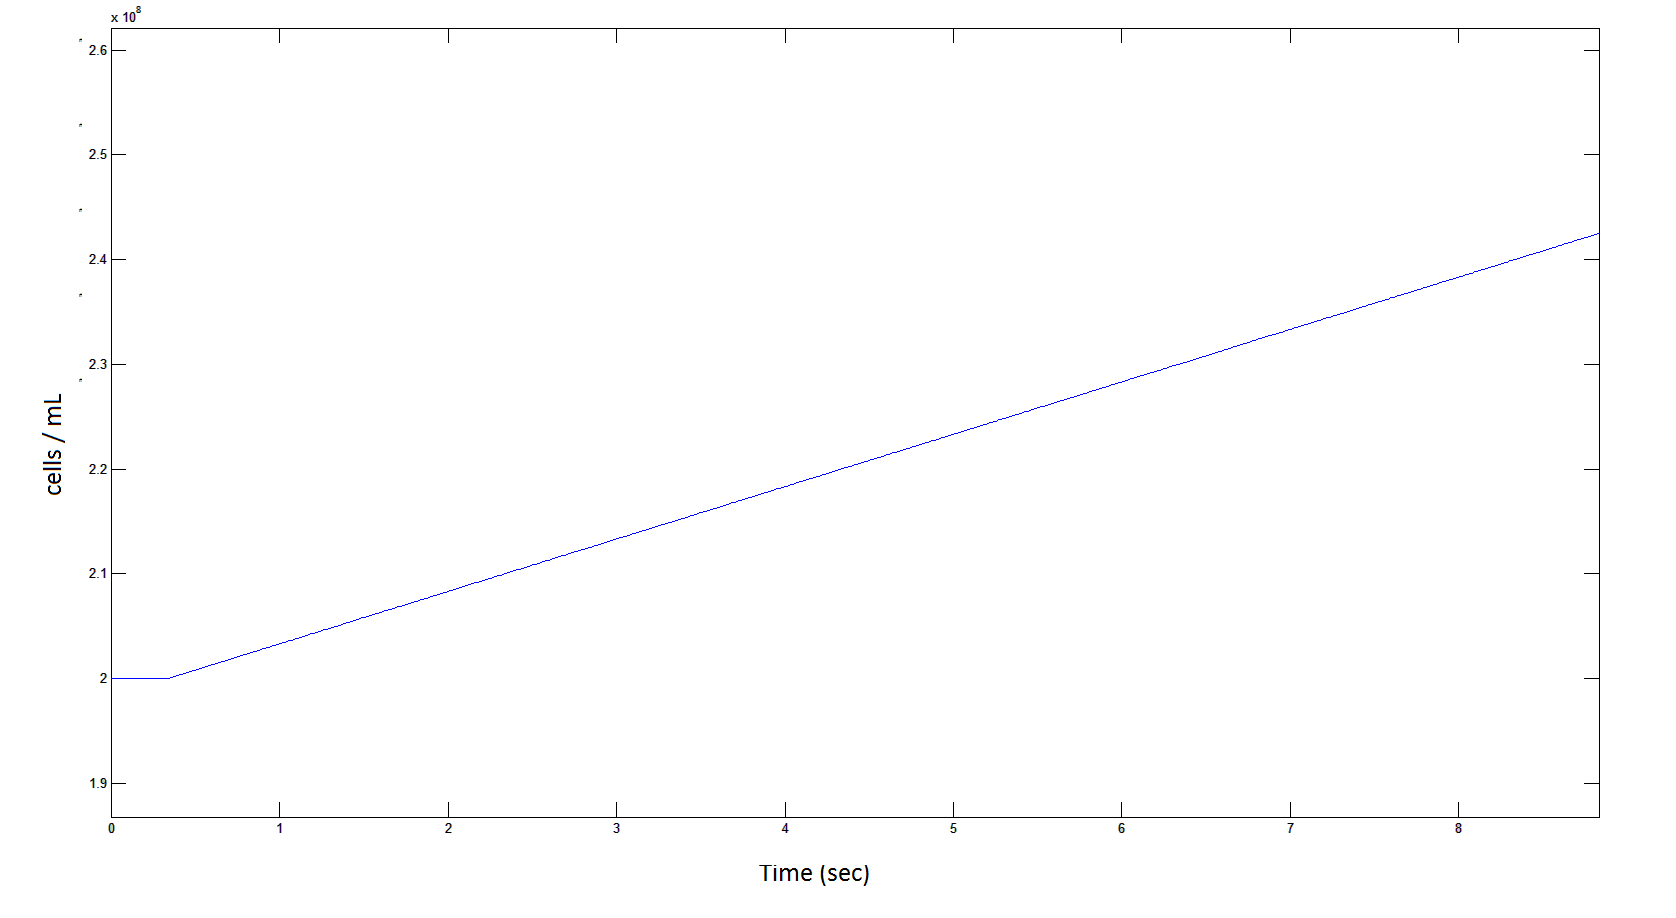
Graph 9: The blue line represents the increase of cells due to the presence of intracellular glycolate. This graph is a rescaling of graph 8 to show the initial lag in cellular growth.
 "
"

