Team:SUSTC-Shenzhen-A/Project
From 2013.igem.org
(→project results) |
(→results) |
||
| Line 153: | Line 153: | ||
=== results === | === results === | ||
<p>We chose four biobricks to detect after search. They are xylose,KNO<sub>3</sub>,glucose and 12HSL.</p> | <p>We chose four biobricks to detect after search. They are xylose,KNO<sub>3</sub>,glucose and 12HSL.</p> | ||
| - | '''BBa_K733018: xylose''' | + | '''[http://parts.igem.org/Part:BBa_K733018:Experience BBa_K733018]: xylose''' |
[[File:xylose-gfp.jpg|500px]] | [[File:xylose-gfp.jpg|500px]] | ||
Revision as of 20:52, 27 September 2013
| Home | Team | Official Team Profile | Project | Parts Submitted to the Registry | Modeling | Protocol and notes | Safety and security | Attributions | Human Practice |
|---|
Contents |
Overall project
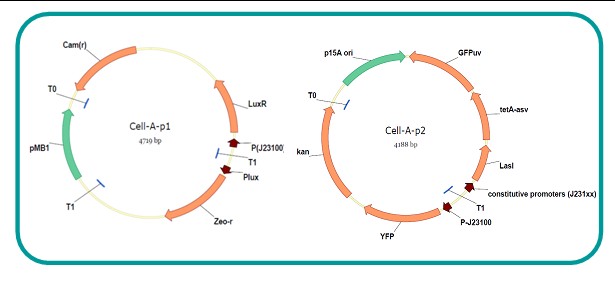
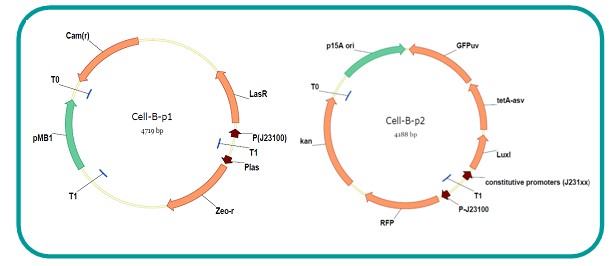
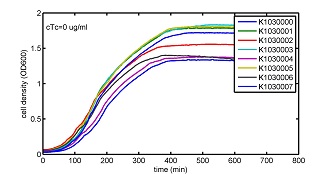
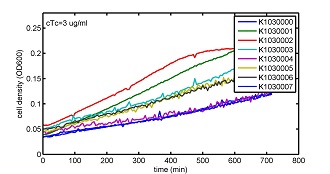
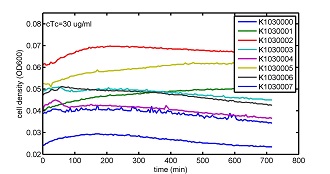
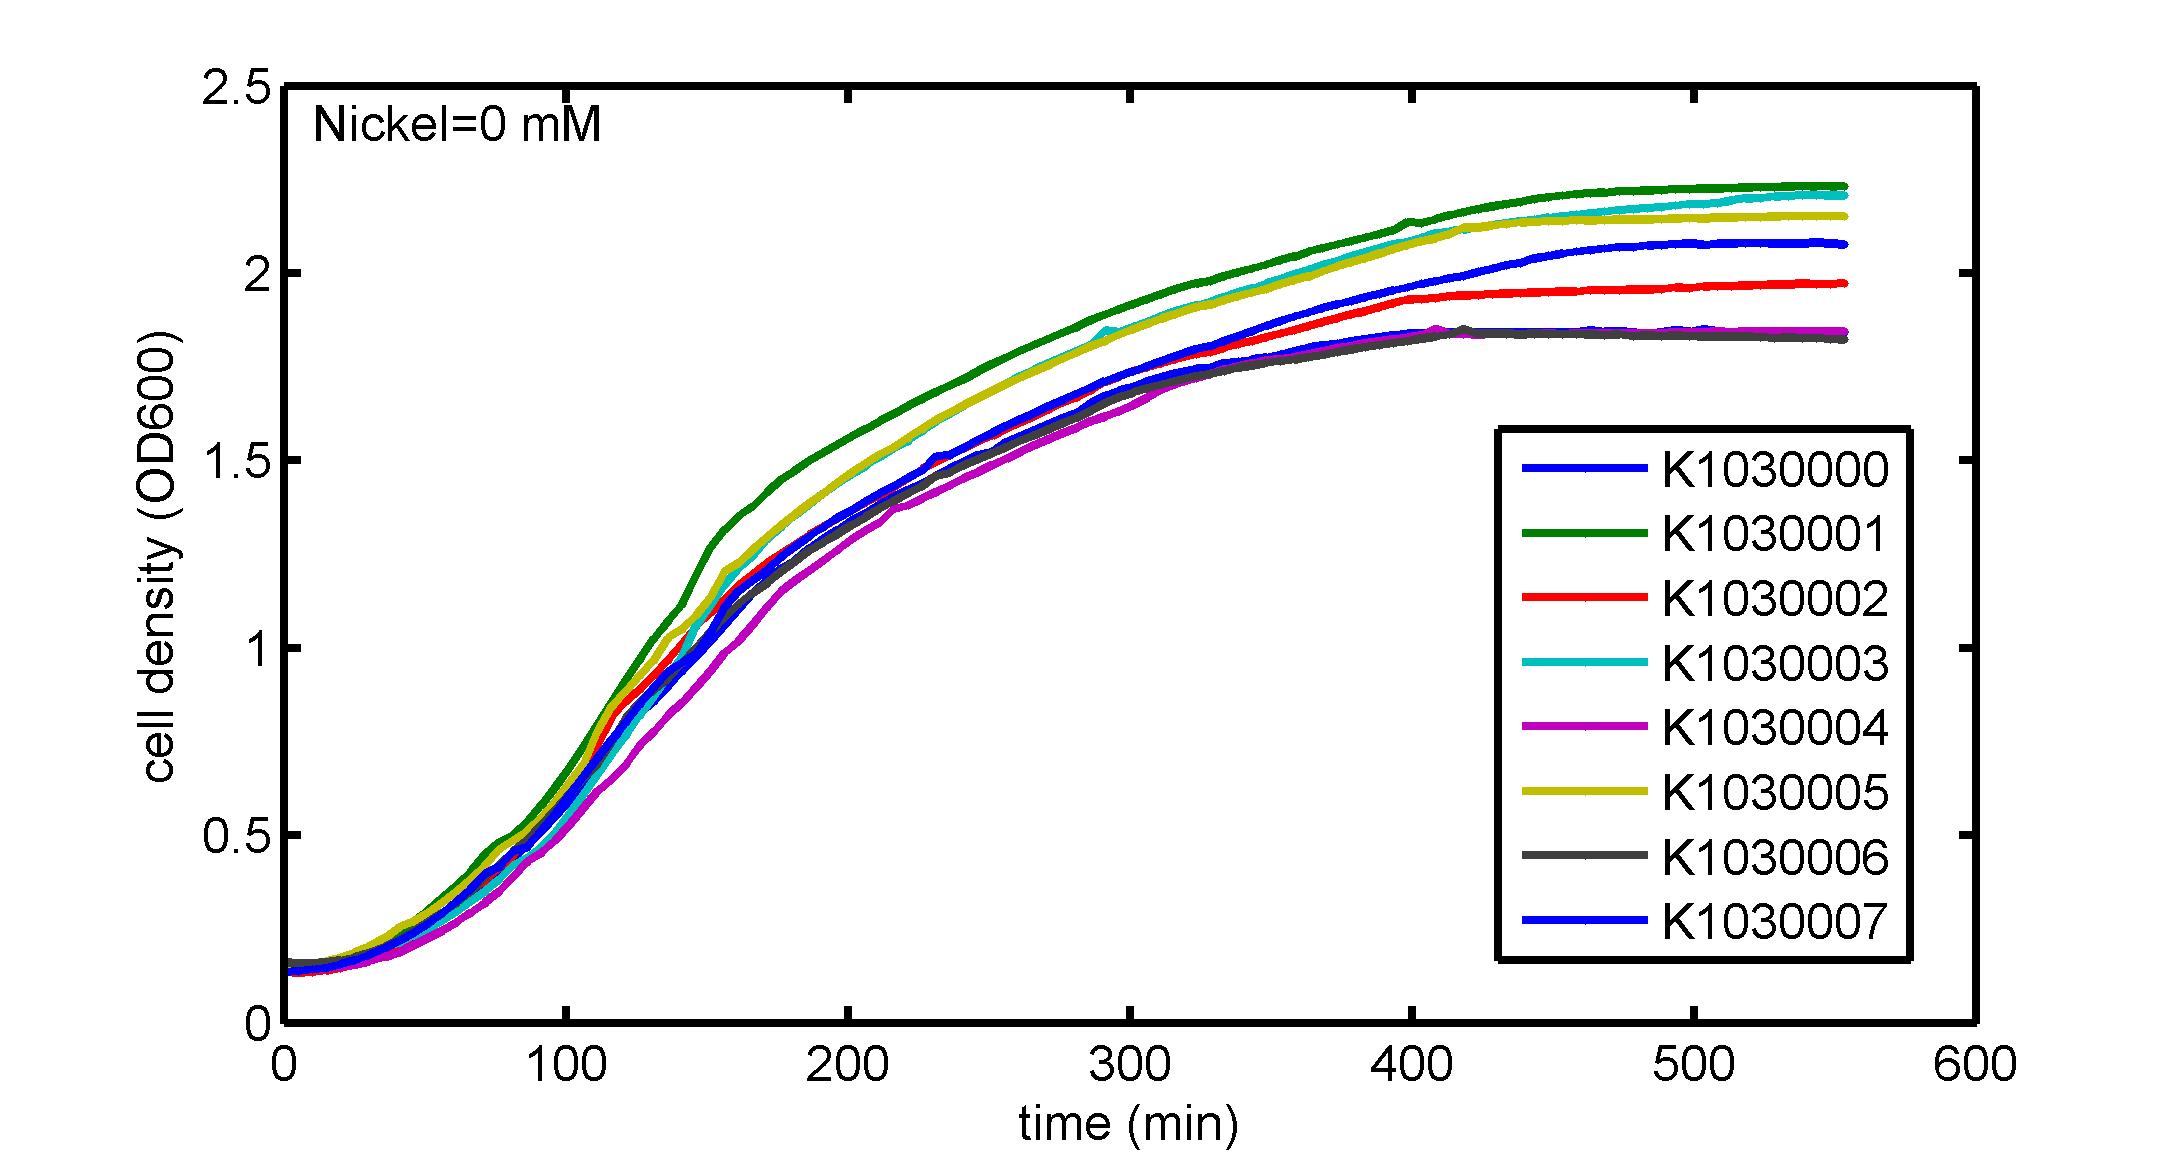
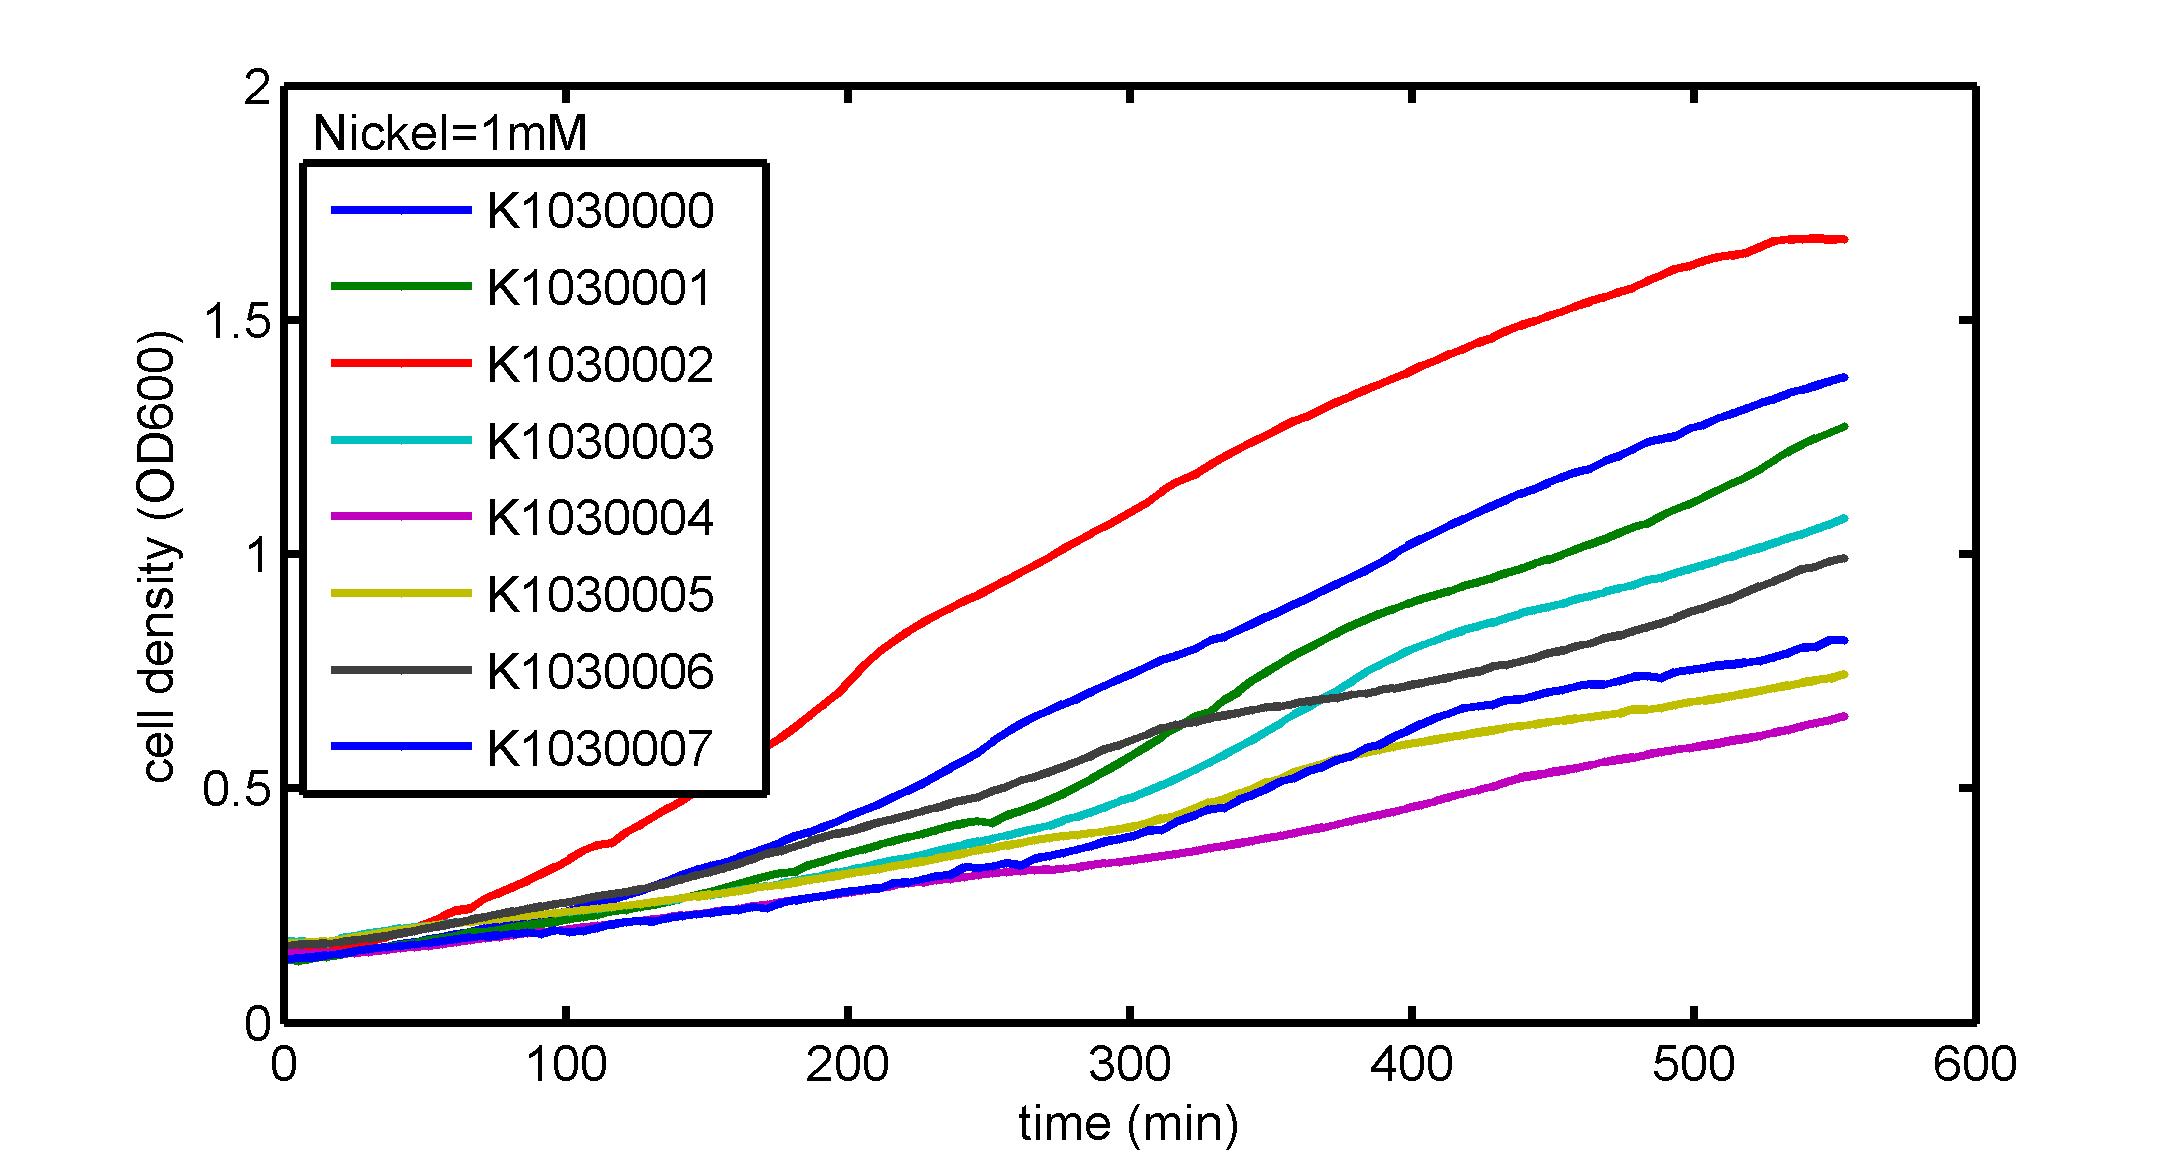
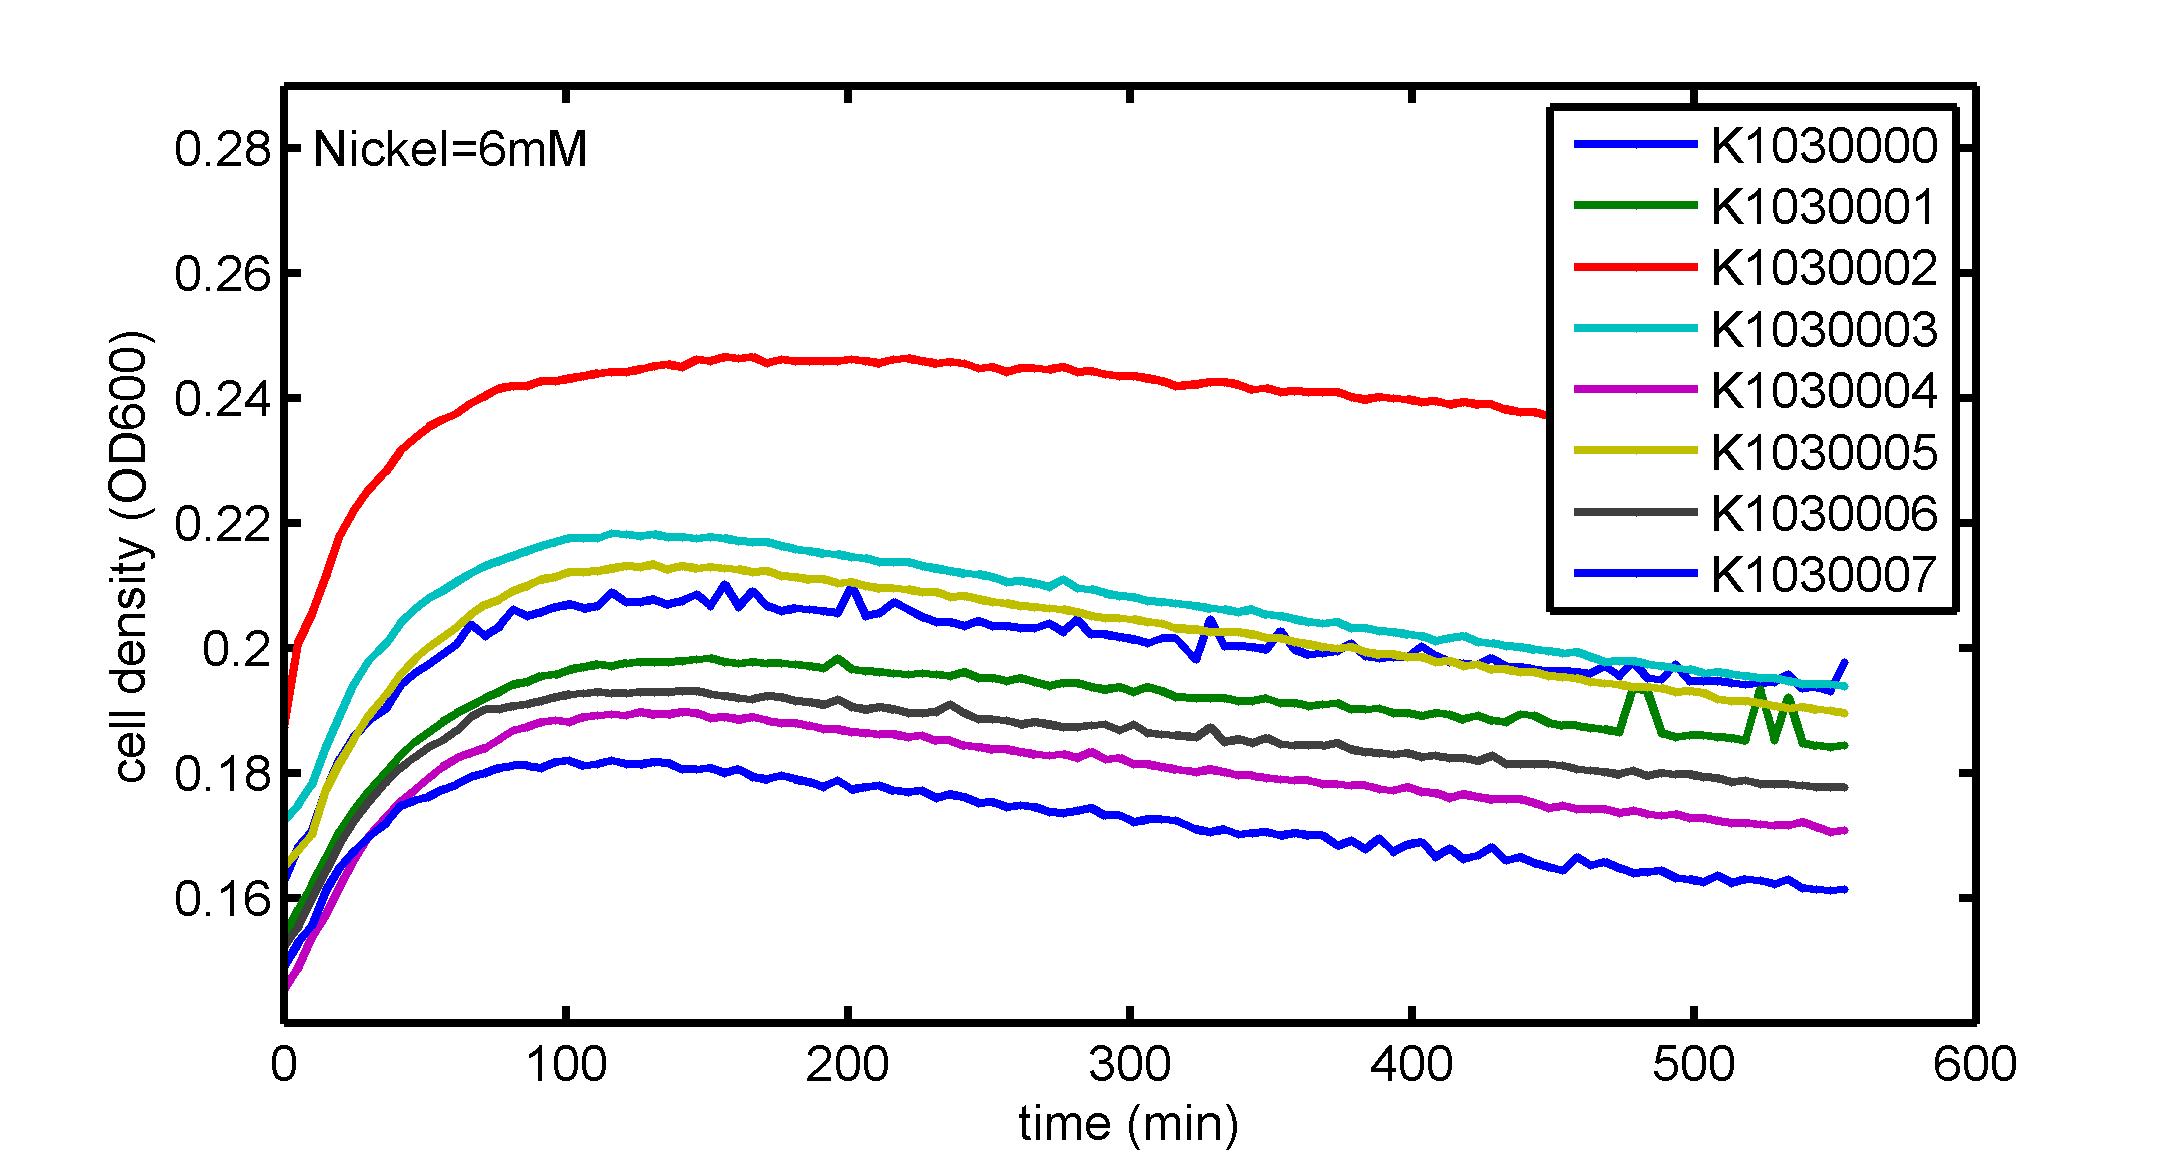
AbstractThere are many applications of the game theory in some aspects of our life. Each individual has two kinds of choices--to betray or stay silent, and the choice you make would determine your fate. To betray the other side, you may risk being revenged. While staying silent, companion's betrayal may hurt you deeply. As for our project, we work out a new way to imitate the game theory by constructing a community of two E. Coli bacteria. Here we use the growth rate of each species to represent its fate. The effect of one's silent or betrayal on the other species' fate is acted through intercellular signal molecules of two quorum sensing systems. Each signal molecule regulates the expression of toxic genes in the other species and reduces its growth rate. We characterize the consequence of each strategy by quantitatively measure the growth rates of each species in the community. BackgroundWhy do we want to do this project?We find that most of the researches in synthetic biology aim to study the interaction between parts of a single system. But few focus on the interaction between systems with multi-elements. However, in the real world, there are complex competition and cooperation among the various creatures. And they can work together to achieve a certain function, for example, different kinds of yeast in brewing beer. There is no lack of the ideas of game theory in these processes. So we chose a classical method—prisoner's dilemma as a model to design our project. The importance of our project:Our project can simulate the interaction among multiple systems in reality and the final state of them. Through a well-known issue of game theory, we can give synthetic biology and iGem greater publicity from many perspectives. Furthermore, after a slight modification, the project can provide us with an interesting solution to security. Project Detailsour designParts: Communication: quorum sensing LuxI produces 6HSL, 6HSL cross membrane, 6HSL binds to LuxR, LuxR activate promoter Plux LasI produces 12HSL, 12HSL cross membrane, 12HSL binds to LasR, LasR activate promoter Plas Poissonness genes: tetA: import Nickel into cell, which kills cell Zeo-r: Zeocin damage DNA and kills cell, Zeo-r binds and neutralize Zeocin Truth Table Tuning gene expression: repressor and inducer Cell A: Constant expressions: LuxR(with C6HSL, activate pLux, express Zeo-r): promoter J23100 and rbs B0034 Pcon: promoter J23100 to J23107 and rbs B0034 YFP (yellow fluorescent protein labeled cell A): promoter pCon, rbs Adjustable expressions: Zeo-r, adjusted by C6HSL, produced by LuxI from cell B, depends on cell B density LasI: adjusted by Pcon, LasI produces C12HSL, control cell B tetA: adjusted by Pcon Zeocin, Nickel concentration are controlled by you C12SHL concentration: controlled by cell A concentration Nickel either kill cell or slow cell growth: tetA increase sensitivity of cell B to Nickel: zeocin either kill cell or slow cell growth:Zeo-r decreases sensitivity of cell B to zeocin -asv: amino acid sequence that increase response time of LuxI, tetA and Zeo-r to regulation pMB1 and p15A: control plasmid replication in E coli Kan and Cam(r): with antibiotics Kanamycin and chloramphenicol, prevent lost of plasmids Cell B: Constant expressions: LasR (with C12HSL, activate pLux, express Zeo-r): promoter J23100 to J23107 and rbs B0034 RFP (red fluorescent protein labeled cell B): promoter pCon, rbs Adjustable expressions: Zeo-r, adjusted by C12HSL, produced by LasI from cell A, depends on cell A density and Pcon. LuxI: adjusted by Pcon, LuxI produces C6HSL, control cell A tetA: adjusted by Pcon Zeocin, Nickel concentration are controlled by you C6HSL concentration: controlled by cell B concentration and Pcon tetA increase sensitivity of cell B to Nickel: Nickel either kill cell or slow cell growth Zeo-r decreases sensitivity of cell B to zeocin: zeocin either kill cell or slow cell growth -asv: amino acid sequence that increase response time of LuxI, tetA and Zeo-r to regulation pMB1 and p15A: control plasmid replication in E coli Kan and Cam(r): with antibiotics Kanamycin and chloramphenicol, prevent lost of plasmids Experiment processPlease refer to our protocol and notes for more details. Resultsproject results[http://parts.igem.org/wiki/index.php?title=Part:BBa_K1030000 BBa_K1030000] [http://parts.igem.org/wiki/index.php?title=Part:BBa_K1030001 BBa_K1030001] [http://parts.igem.org/wiki/index.php?title=Part:BBa_K1030002 BBa_K1030002] [http://parts.igem.org/wiki/index.php?title=Part:BBa_K1030003 BBa_K1030003] [http://parts.igem.org/wiki/index.php?title=Part:BBa_K1030004 BBa_K1030004] [http://parts.igem.org/wiki/index.php?title=Part:BBa_K1030005 BBa_K1030005] [http://parts.igem.org/wiki/index.php?title=Part:BBa_K1030006 BBa_K1030006] [http://parts.igem.org/wiki/index.php?title=Part:BBa_K1030007 BBa_K1030007] We use a strong synthetic constitutive promoter, J23100 to drive the expression of tetA, an tetracycline transporter that can also transport toxic nickel ion into cell which reduce e coli growth rate and kill cells. an asv degradation tag is added to the c-terminal of tetA. A superfolder GFP is expressed under the control of the same promoter so that we can use fluorescent plate reader, flow cytometer and microscope to monitor the expression level of tetA. They are not fused. We generated plasmids, in which tetA and GFP are under control of 8 constitutive promoters of various intensities. There are J23100 through J23107. We first check the growth curve of E coli containing our biobricks with various tetracyclin concentration. We grow then in Luria Broth (LB) using plate reader. The data is shown in biobricks section. With gradually increasing in tetracylcin concentration,the growth is slowing down and eventually turning negative. We fit the growth rate to the exponential growth phase of each sample and plot them against the mean GFP level, which representing the tetA level. It clearly shows the positive correlation between growth rates of E coli and the levels of tetA, an transporter than pump tetracyclin out of E coli. We then added Nickel Chloride of various concentrations to the E coli containing the biobricks above, and growth them in Luria Broth (LB) using fluorescent plate reader. The growth curves are shown in the biobricks section. With increasing in Nickel concentration, the growth is also slowing done to negative. We then plot the growth rate against the mean GFP level. Most of the biobricks fit the negative relation between tetA and growth rate with Nickel. However, the trend is not as robust as with tet. In addition, even with lowest tetA level, there is still toxic effect with nickel, which reduced the significance of tuning growth rate via tuning tetA. We will try to find out why.
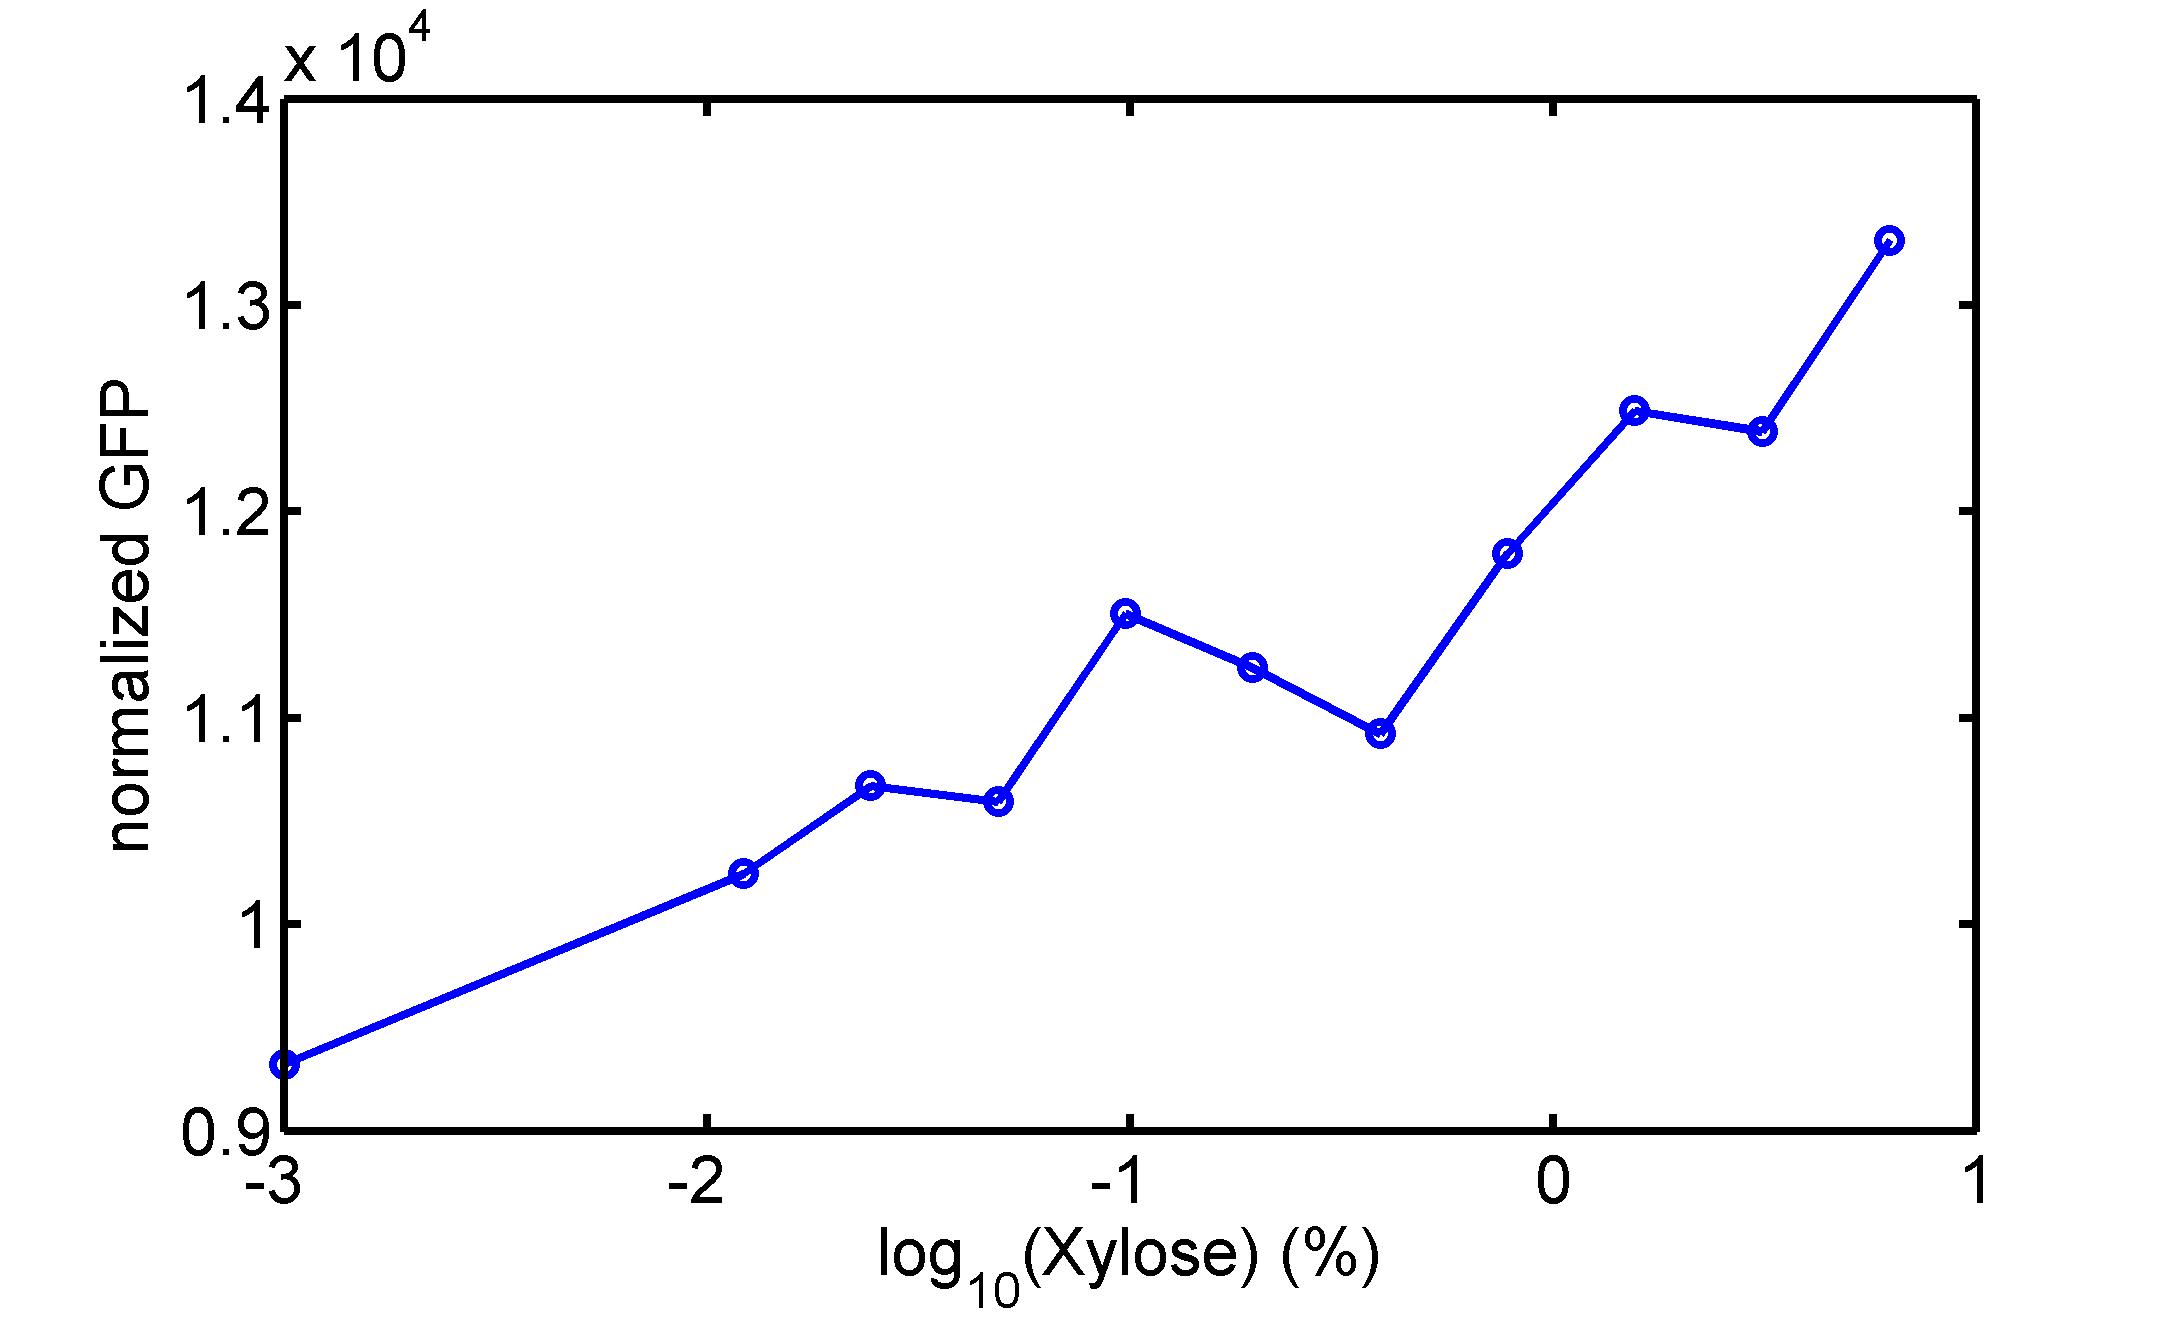
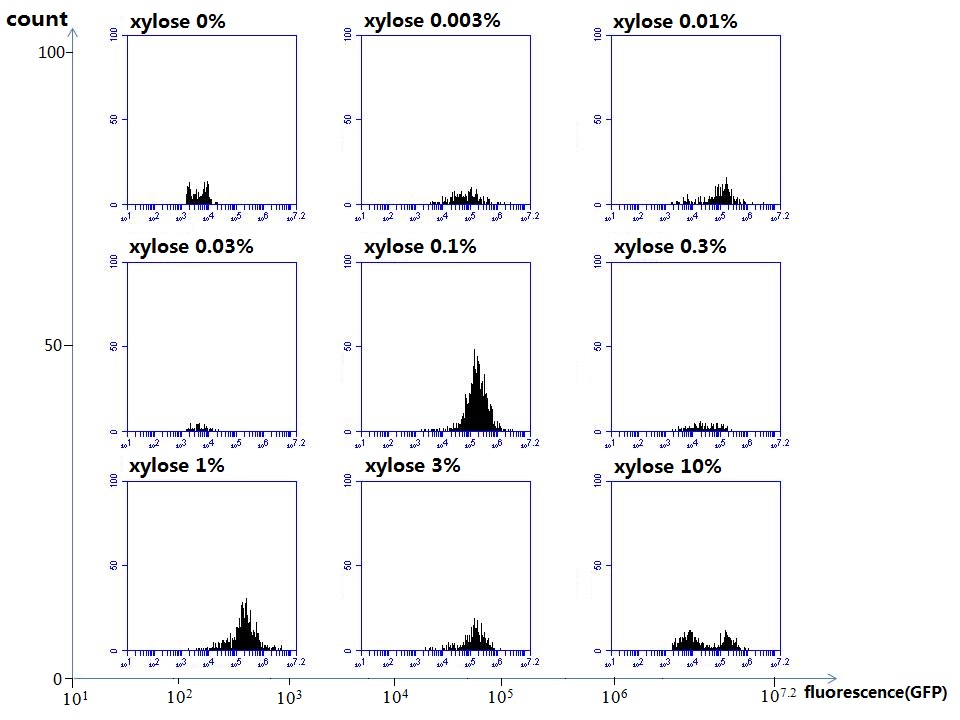
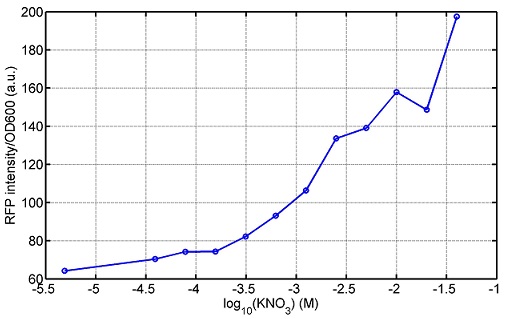
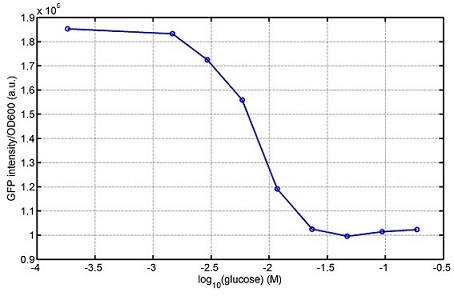
[http://parts.igem.org/wiki/index.php?title=Part:BBa_K1030008 BBa_K1030008] What we have done are the plasmid construction and the early experiments ,because of the time limite. Here are some results of our project modeling resultsBiobricks checkingresultsWe chose four biobricks to detect after search. They are xylose,KNO3,glucose and 12HSL. [http://parts.igem.org/Part:BBa_K733018:Experience BBa_K733018]: xylose First we used the microplate to detect the fluorescence of this part, because we could not see the transition point and we were wondering what it would be look like. The data we got is not so good, for we didn’t see the transition point obviously, and also has some differences comparing to the data from HKUST. According to the detecting from HKUST, fluorescence produced in about 5% xylose is more than that in 10% xylose, however what we got is fluorescence produced in 5% xylose than that in 10% xylose. Since we didn’t get what we really want using microplate, we tried FCM this time. In 0% xylose culture, we almost got no fluorescence produced and in 0.003% xylose culture we saw obvious fluorescence came out. There was an obvious tendency that the efficiency of the promoter increased as the xylose concentration gathered up. However, with the increase of xylose concentration, the fluorescence increased choppily. What was amazing was that the fluorescence we got was 10 times brighter than the result the HKT got, which appeared to be great. Another interesting thing is most of the cell we detected had no fluorescence produced. Then we guess that may because the xylose molecules taken in the different cell are different, or may because the copy number in each cell is different. Maybe it has some relationship with epigenetics. BBa_K774007: KNO3 Like the BBa_K733018, we were wondering where the transition point is the production of fluorescence from off to on. So we have made more concentrations increasing exponentially to foster bacteria with BBa_K774007 and tested them by microplate.The result came out that with the increasing of nitrate of potash, the fluorescence produced by single cell increases slowly at the beginning but rapidly later. What a pity that we didn't see the obvious turning point between off and on. BBa_K741002: glucose Seeing BBa_K741002’s figure prepared by USTC_China, we were thinking whether we could get it more efficient in decreasing the fluorescence produced by the bacteria. Besides, we though it lacked the data under the low concentration of glucose. So we measured this part by microplate in the concentration showing below. The result came out to be very good: in about 10-2.4M glucose, the fluorescence has left only a half in one cell.With the increasing of glucose, the fluorescence/OD continuously decreases, and at about 10-1M glucose, the fluorescence/OD remains very low.
References Click the Reference to get more information. |
 "
"


