From 2013.igem.org
(Difference between revisions)
|
|
| Line 1: |
Line 1: |
| - | __NOTOC__
| |
| - |
| |
| | {{Team:SydneyUni_Australia/Style}} | | {{Team:SydneyUni_Australia/Style}} |
| | {{Team:SydneyUni_Australia/Header}} | | {{Team:SydneyUni_Australia/Header}} |
| | + | |
| | + | __NOTOC__ |
| | | | |
| | =='''A Brief Background on Michaelis-Menton Kinetics'''== | | =='''A Brief Background on Michaelis-Menton Kinetics'''== |
Revision as of 01:46, 28 September 2013


A Brief Background on Michaelis-Menton Kinetics
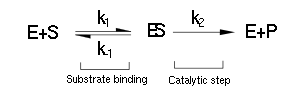
The majority of single-substrate metabolic enzymes follow MM kinetics, for which the equations accurately describe enzyme activity. The system is based on the forward and reverse kinetic rate (k1 and k-1 respectively) of substrate-enzyme binding followed by the irreversible catalytic step of product formation (k2) as depicted in the figure below:
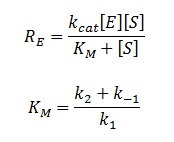
The rate of catalysis for an enzyme is a function of the enzyme and substrate concentration and incorporates the catalytic constant Kcat and the Michaelis constant Km, which are given in most of the literature that involves enzyme kinetics. The symbol denotes the reaction rate: the rate of product formation, i.e.
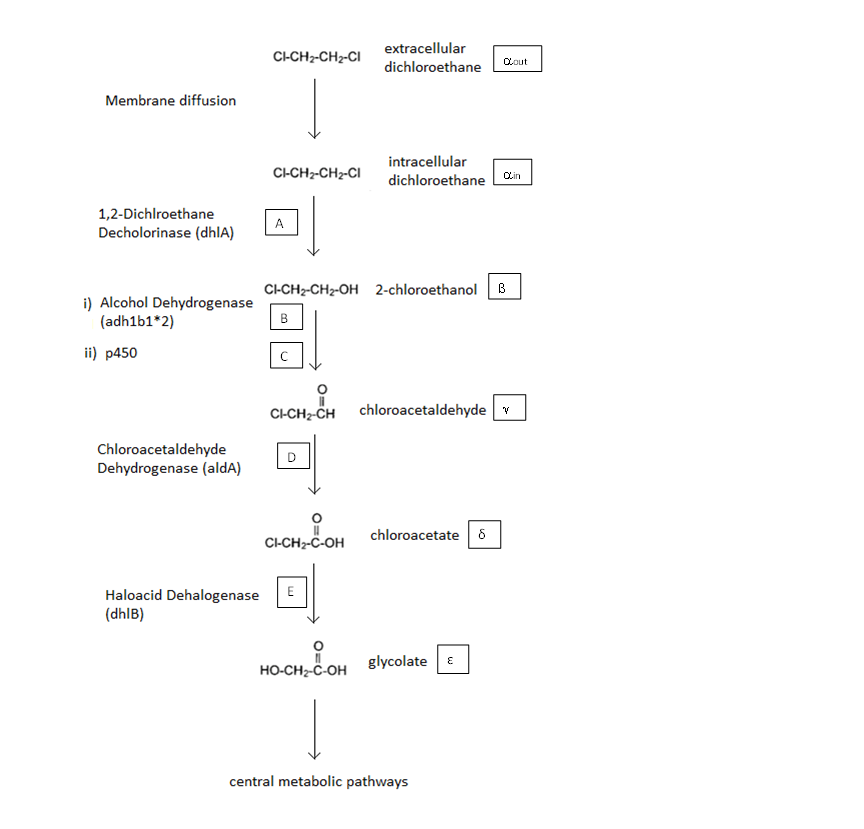
A Schematic of the Engineered Metabolic Pathway:
In the above figure the symbols represent the intracellular concentration of the associated metabolite or enzyme. More information is given below
General Information regarding the Enzymes Involved in the Metabolic Pathway
| Enzyme | Gene | Symbol | Constants | Substrate | Product | Ref
|
| 1,2-Dichloroethane Dechlorinase | dhlA | A | KM A=0.53mM, kcat A = 3.3 s-1 | DCA | 2-chloroethanol | [1]
|
| Alcohol Dehydrogenase | Adhlb 1/2* | B | KM B=0.94 mM, kcat B = 0.0871 s-1 | 2-chloroethanol | chloroacetaldehyde | [2]
|
| p450 | ? | C | KM C = 7.2 mM, kcat C = 89.8 s-1 | 2-chloroethanol | chloroacetaldehyde | [3]
|
| Chloroacetaldehyde Dehydrogenase | aldA | D | KM D = 0.0.6mM, kcat D = 0.60 s-1 | chloroacetaldehyde | chloroacetate | [4]
|
| Haloacetate Dehydrogenase | dhlB | E | KM E= 20 mM, kcat E = 25.4 s-1 | chloroacetate | glycolate | [5]
|
* values based on ethanol as a substrate
ODE Model
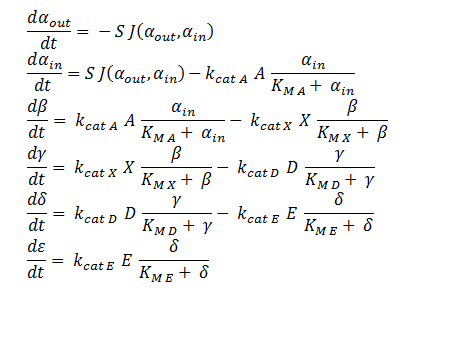
System of ODEs used to model the intracellular concentration of the metabolic intermediates inside a single cell. The concentrations of each metabolite are determined through the associated MM equation of the introduced enzymes.
The symbols A, X, D & E represent the intracellular enzyme concentrations, where X = B or C, and the symbols αin,αout, β, γ & δ represent the concentrations of the metabolic intermediates.
The function J(αout,αin ) represents the flux of extracellular DCA across the plasma membrane and is a function of the extra and intracellular concentrations of DCA. The value S represents the average surface area of the cellular membrane of E. coli. See below for the derivation of J.
The initial conditions for the system are αin=β=γ=δ=0 M at t=0 min, ε=εphys & αout=αout(t=0) . Where is the physiological concentration of non-DCA-derived glycolate and αout(t=0) is the initial concentration of DCA outside of the cellular membrane.
The intracellular enzyme concentrations will be determined experimentally.
DCA Diffusion Across the Plasma Membrane
The diffusion of DCA across the cell membrane was modelled based on Fick’s first law of diffusion:
Fick’s first law of diffusion is appropriate since 1,2-DCA is non-polar. The law states that the flux, J, of DCA across the membrane is equal to the permeability coefficient, P, times the concentration difference of DCA across the cell membrane. The flux has units has units L2 T-1. The permeability coefficient of DCA is not reported in the literature, but can be estimated through the relation:
Where D is the diffusion constant of DCA across the plasma membrane and d is the length of the membrane. The partition coefficient for DCA across a plasma membrane is not documented, but can be estimated to the octanal-water partition coefficient (Kow). This constant states that the equilibrium ratio of DCA in octanol and water:
The diffusion constant, D, is not documented in the literature but can be estimated through the Stokes-Einstein equation based on an estimation of the radius of DCA and viscosity of the cellular membrane.
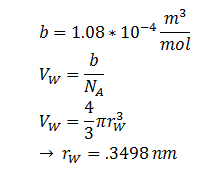
The Stokes-Einstein equation for determining the diffusion constant D. kb, T, η & r represent the Boltzmann constant, temperature, viscosity of the membrane and radius of DCA respectively. Here we must assume DCA is spherical. The ‘radius’ of DCA isn’t described in the literature. But the van der Waal constant, b, can be used to calculate the van der Waal volume, VW, and hence the van der Waal radius, rW3. Note DCA is not spherical, and this method is used to calculate atoms.
In Summary, the flux across the membrane is:
Summary of Constants
| Symbol | Name | Value (units) | Ref
|
| η | Cellular Membrane Viscosity | 1.9 kg/m/s | [6]
|
| S | E. coli Membrane Surface Area | 6E-12 m2 | [7]
|
| r | DCA radius | 0.3498 nm | [8]
|
| Kow | Octanol-water Partition Coefficient for DCA | 28.2 | [9]
|
| d | Length of Cellular Membrane | ??? | [10]
|
Extending the System to Cell Cultures
The model can be extended to a homogeneous solution/culture of cells. Let Ψ represent the concentration of the cells in solution. The overall rate of decrease of DCA (αtotal) in solution is
By applying this change, the resulting values of αin,αout, β, γ & δ represent the metabolite concentration across all cells.
Furthermore the cells are expected to grow due to the production of glycolate (which can be used as a carbon source for growth).
The rate at which E. coli can grow based on the amount of glycolate is not described in the literature. However one will be able to infer the growth as a function of amount of glycolate, ε, in the cell through experimentation.
With thanks to:


 "
"
