Team:Tokyo Tech/Experiment/Inducible Plaque Forming Assay
From 2013.igem.org
| Line 2: | Line 2: | ||
<div id="text-area"><br> | <div id="text-area"><br> | ||
<div class="box" id="title"> | <div class="box" id="title"> | ||
| - | <p style="line-height:0em; text-indent:0em;">Inducible Plaque Forming Assay</p> | + | <p style="line-height:0em; text-indent:0em;" name="top">Inducible Plaque Forming Assay</p> |
</div> | </div> | ||
<div class="box"> | <div class="box"> | ||
| Line 140: | Line 140: | ||
This histogram shows distance from the piece of paper in a horizontal axis, and shows number of plaques over distance squared, which means the rate of plaque formation, in a vertical axis. The bin range is 0.2 cm.]] | This histogram shows distance from the piece of paper in a horizontal axis, and shows number of plaques over distance squared, which means the rate of plaque formation, in a vertical axis. The bin range is 0.2 cm.]] | ||
</div><br> | </div><br> | ||
| + | <html><div align="center"><a href="https://2013.igem.org/Team:Tokyo_Tech/Experiment/Inducible_Plaque_Forming_Assay#top"><img src="https://static.igem.org/mediawiki/2013/f/f0/Titeh2013_backtotop.png" width="200px"></a></div></html> | ||
</div> | </div> | ||
Revision as of 22:19, 26 October 2013
Inducible Plaque Forming Assay
Contents |
1. Introduction
Our previous assay revealed that the M13 phage genes and the M13 origin worked together with the pSB origin. Next, we confirmed whether the release of the M13 phage particle depends on the induction of g2p expression. We inserted lux promoter (which is activated by 3OC6HSL-LuxR complex) upstream of g2p, as an inducible promoter (Fig. 3-4-1)(See more about our plasmid construction). The method for our assay is briefly shown in Fig. 3-4-2. First, we cultured E. coli which is introduced our new part ([http://parts.igem.org/Part:BBa_K1139021 BBa_K1139021]), and added 3OC6HSL, which induces the phage release. Second, we centrifuged the culture and obtained phage particles. Finally, we added the phage particles and lawn culture (E. coli containing pSB6A1-Ptet-luxR) to the soft agar, and poured it on a YT plate.
2. Materials and Methods
2-1. Plasmid construction
pSB3K3-Plux-M13-Plac-GFP ([http://parts.igem.org/Part:BBa_K1139021 BBa_K1139021])
pSB6A1-Ptet-luxR ([http://parts.igem.org/Part:BBa_S03119 BBa_S03119])
2-2. Strains
DH5alpha (E. coli of high competence)
JM109 (F+ strain E. coli)
2-3. Media
LB
Bacto tryptone 10 g/L
Yeast Extract 5 g/L
NaCl 10 g/L
YT soft agar
Bacto tryptone 8 g/L
Yeast Extract 5 g/L
NaCl 5 g/L
Agarose 6 g/L
YT plate
Bacto tryptone 8 g/L
Yeast Extract 5 g/L
NaCl 5 g/L
Agarose 15 g/L
LB
| Bacto tryptone | 10 g/L |
| Yeast Extract | 5 g/L |
| NaCl | 10 g/L |
YT soft agar
| Bacto tryptone | 8 g/L |
| Yeast Extract | 5 g/L |
| NaCl | 5 g/L |
| Agarose | 6 g/L |
YT plate
| Bacto tryptone | 8 g/L |
| Yeast Extract | 5 g/L |
| NaCl | 5 g/L |
| Agarose | 15 g/L |
2-4. Others
3OC6HSL dissolved in DMSO (>100 microM)
Autoclaved pieces of filter paper (about 1.5 cm in diameter)
2-5. Protocol
Preparation
- Transform DH5alpha with pSB3K3-Plux-M13-Plac-GFP and pSB6A1-Ptet-luxR.
- Prepare overnight cultures of the transformed DH5alpha and JM109, each in LB medium containing ampicillin (50 microg/mL) and kanamycin (30 microg/mL) at 37°C.
- Take 30 microL of the overnight cultures into 3 mL LB medium containing ampicillin (50 microg/mL) and kanamycin (30 microg/mL) . (->fresh cultures)
- Incubate the fresh cultures at 37°C for 2 h.
- Add 3 microL of 5 microM 3OC6HSL in DMSO (final concentration of 5 nM) to the fresh cultures and incubate them at 37°C for 4 h.
- Centrifuge the overnight cultures of the transformed DH5alpha at 9,000g for 1 min.
- Pipette the supernatant into a 1.5 mL tube.
- Dilute it 100 times with water. (-> phage-particle-solution)
Plaque formation
- Transform JM109 with pSB6A1-Ptet-luxR
- Prepare overnight cultures of the transformed JM109 at 37°C.
- Melt the YT soft agar using a microwave.
- Add ampicillin to the YT soft agar.
- Dispense 3.5 mL of the melted soft agar to a new round tube, and keep them at 50°C in an incubator.
- Dispense 400 microL of the overnight cultures of the transformed JM109 to a 1.5 mL tube.
- Into the 1.5 mL tube, add 100 microL of the phage-particle-solution.
- Transfer all the content of the 1.5 mL tube to the dispensed soft agar, mix them, and spread all of it on a YT plate.
- Wait for the YT soft agar to solidify at room temperature (for about 5 min.).
- Put an autoclaved piece of filter paper on the plate, and drip 20 mL of 3OC6HSL in DMSO (100 microM, 5 microM or DMSO only) into the piece of filter paper.
Plaque formation
3. Result
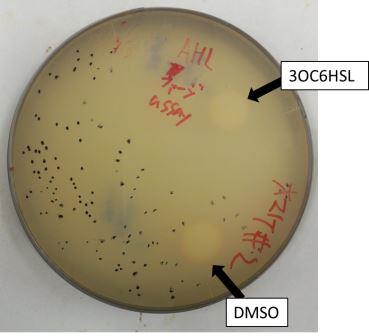
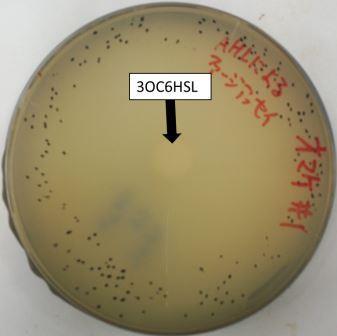
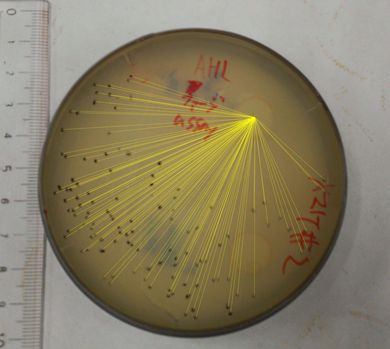
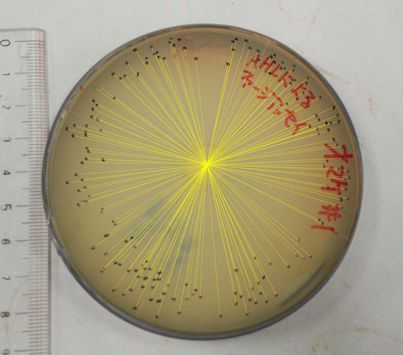
The result of the plaque forming assay is shown in Fig 3-4-3, 3-4-4. On the plate, the plaques were formed at some distance from the piece of filter paper. The result shows that the phage release is regulated by the induction of 3OC6HSL. We also analyzed the distribution of the plaques (Fig. 3-4-5, 3-4-6). The histogram result implicates that the plaques are formed only at the appropriate concentration of 3OC6HSL in the medium (Fig. 3-4-7). In the neighborhood of the piece of filter paper, the expression of g2p is so activated that the phage particles cannot be produced efficiently, because the production of the single stranded DNA largely exceeds that of the coat proteins. In contrast, far from the piece of filter paper, the expression of g2p is so activated that the phage particles cannot be produced efficiently, because the production of the single stranded DNA isn’t enough to produce phage particles.
Fig. 3-4-3, 3-4-4. The plaques formed with 3OC6HSL induction (plaque plotted)
The plaques were formed using the JM109 (with pSB6A1-Ptet-luxR) overnight cultures and the phage-particle-solution. The phage particles were obtained from the supernatant of the fresh cultures (+3OC6HSL) of transformed DH5alpha (with pSB3K3-Plux-M13). A mixture of 3.5 mL YT soft agar, 100 microL of X100 supernatant and 400 microL of the overnight cultures of JM109 (with pSB6A1-Ptet-luxR) was poured on a YT plate. After solidifying the soft agar, we put a piece of filter paper on the plate and dripped 3OC6HSL in DMSO (or DMSO only) on the piece of filter paper.
Fig. 3-4-5, 3-4-6. The analysis of distribution of the plaques
We totalize the distances from the center of the piece of filter paper to each plaque, by using ImageJ.
 "
"


