Team:SydneyUni Australia/Modelling Results
From 2013.igem.org
| Line 53: | Line 53: | ||
| - | + | ||
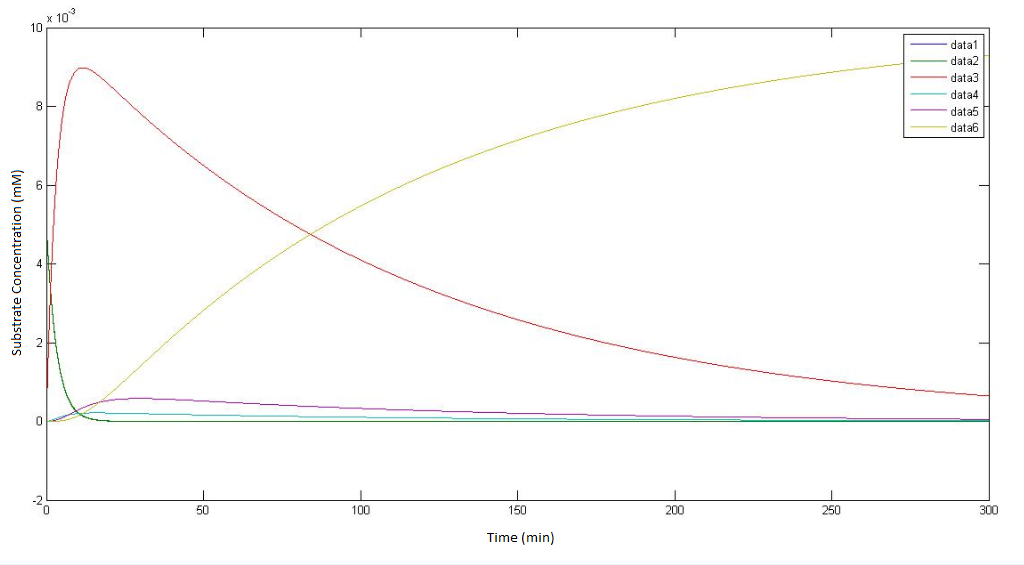
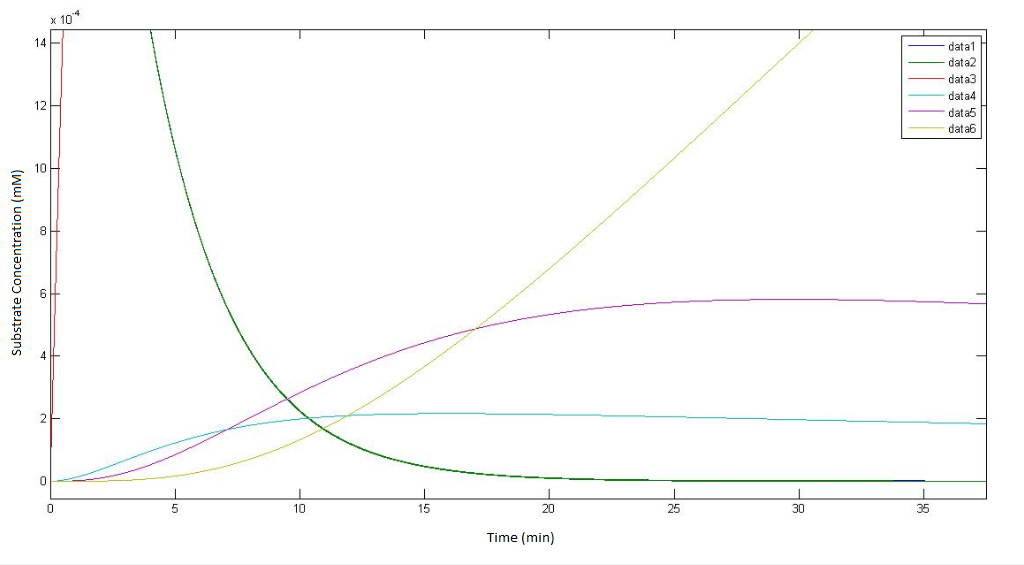
| + | Regarding the figure legends in the graphs themselves, "data 1" - "data 6" represents the concentration of the metabolites αin,αout, β, γ, δ & ε | ||
== '''References:''' == | == '''References:''' == | ||
Revision as of 04:02, 28 September 2013


Running the Model
All enzyme concentrations were given a value of 0.1 mM. The temperature was set as T=298K. A plasma membrane distance of d=2nm was given. The cell concentration was given as 1E8 cells/mL. No cellular growth rate was implemented. Glycolate, ε, was left ‘unprocessed’, i.e. it is left to simply accumulate.
Using the constants above the flux took the value:
Assumptions
- All enzymes follow MM kinetics as described in the literature.
- The enzymes and metabolites are homogeneously distributed within the cell.
- The metabolites in the pathway are processed only by the proposed enzymes.
- The enzyme concentrations remain constant.
- The partition coefficient for DCA in octanol and water is approximately the same as the partition coefficient for the cell membrane.
- The cells only grow/divide through DCA-derived-glycolate.
- Diffusion can accurately follow
- All cells are of the same size (ie equal membrane surface area)
Raw MATLAB code:
function dy = DCA(t,y)

dy=zeros(6,1);

dy(1)= -6*(10^4)*0.0463067*(y(1)-y(2));
dy(2)= 6*(10^4)*0.0463067*(y(1)-y(2))-3.3*0.1*(y(2)/(0.53+y(2)));
dy(3)= 3.3*0.1*(y(2)/(0.53+y(2)))-0.0871*0.1*(y(3)/(0.94+y(3)));
dy(4)= .0871*0.1*(y(3)/(0.94+y(3)))- 0.6*0.1*(y(4)/(0.16+y(4)));
dy(5)= 0.6*0.1*(y(4)/(0.16+y(4))) - 25.4*0.1*(y(5)/(20+y(5)));
dy(6)= 25.4*0.1*(y(5)/(20+y(5)));

end
Output:
graphs representing the model of the pathway not involving p450
Regarding the figure legends in the graphs themselves, "data 1" - "data 6" represents the concentration of the metabolites αin,αout, β, γ, δ & ε
References:
[1] Krooshof, G. H., I. S. Ridder, et al. (1998). "Kinetic Analysis and X-ray Structure of Haloalkane Dehalogenase with a Modified Halide-Binding Site†." Biochemistry 37(43): 15013-15023.
[2] Janecki, D. J., K. G. Bemis, et al. (2007). "A multiple reaction monitoring method for absolute quantification of the human liver alcohol dehydrogenase ADH1C1 isoenzyme." Analytical Biochemistry 369(1): 18-26.
[3] Pandey, A. V. and C. E. Flück (2013). "NADPH P450 oxidoreductase: Structure, function, and pathology of diseases." Pharmacology & Therapeutics 138(2): 229-254.
[4] van der Ploeg, J., Shmidt, M. P., Landa, A. S., and Janssen, D. B. (1994). "Identification of Chloroacetaldehyde Dehydrogenase Involved in 1,2-Dichloroethane Degradation." Applied Environmental Microbiology (60(5): 1699-1605.
[5] van der Ploeg, J., van Hall, G., Janssen, D. B. (1991) "Characterization of the haloacid dehalogenase from Xanthobacter autotrophicus GJ10 and sequencing of the dhlB gene." Journal of Bacteriology 173(24):7925-33.
[6] Sinensky, Mi “Homeoviscous Adaption – A Homeostatic Process that Regulates the Viscosity of Membrane Lipids in Escheria coli” Proceedings from the National Academy of Science 71(2): 522-525.
[7] CyberCell Database
 "
"


