Team:Edinburgh/Project/Results/Chassis
From 2013.igem.org
| Line 3: | Line 3: | ||
<div class='content'> | <div class='content'> | ||
| + | |||
| + | <h3>Characterisation of ''Bacillus subtilis 168'' as a chassis</h3> | ||
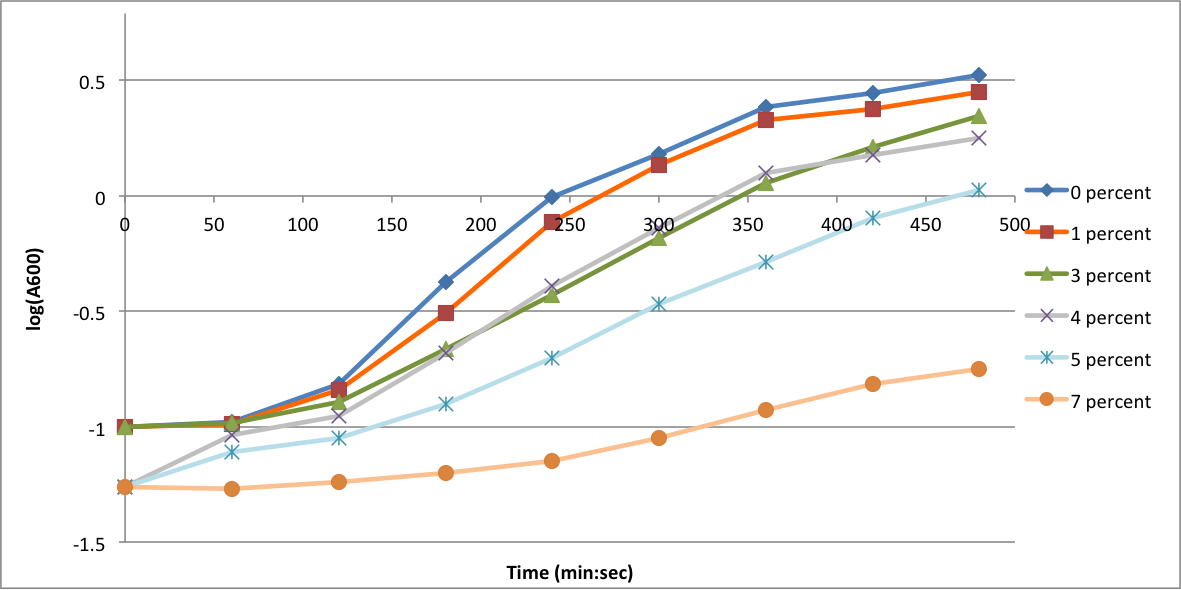
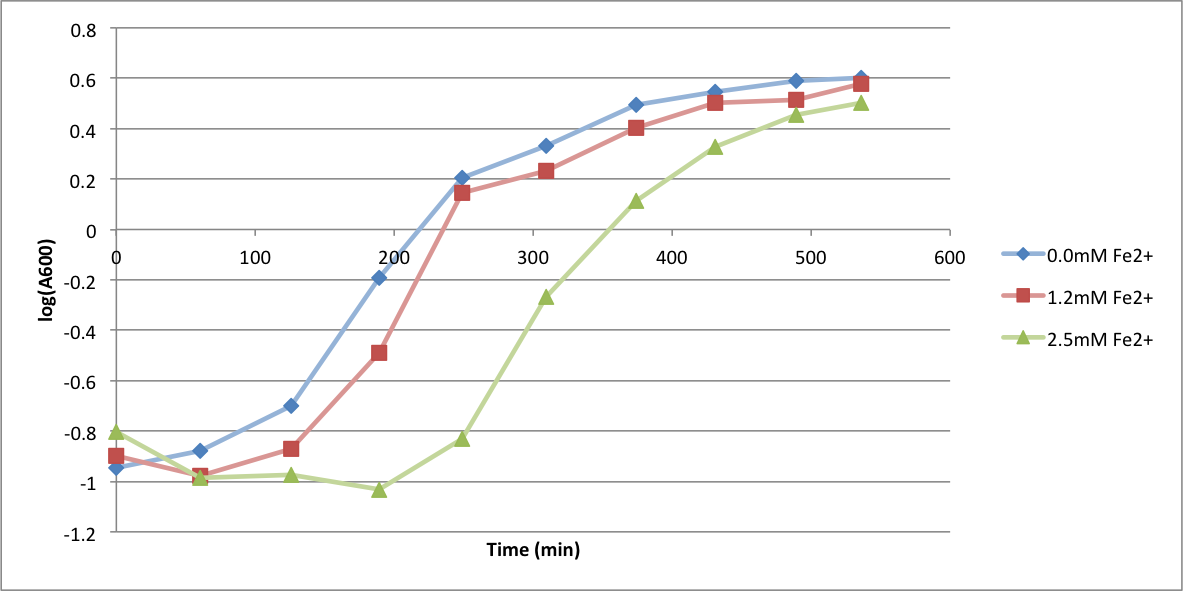
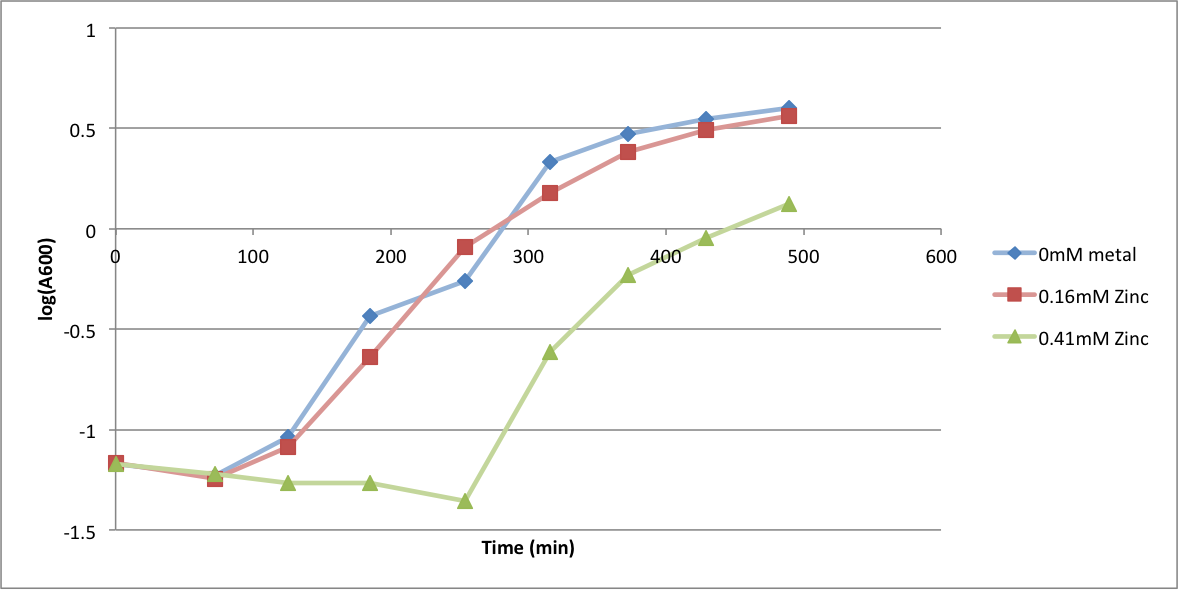
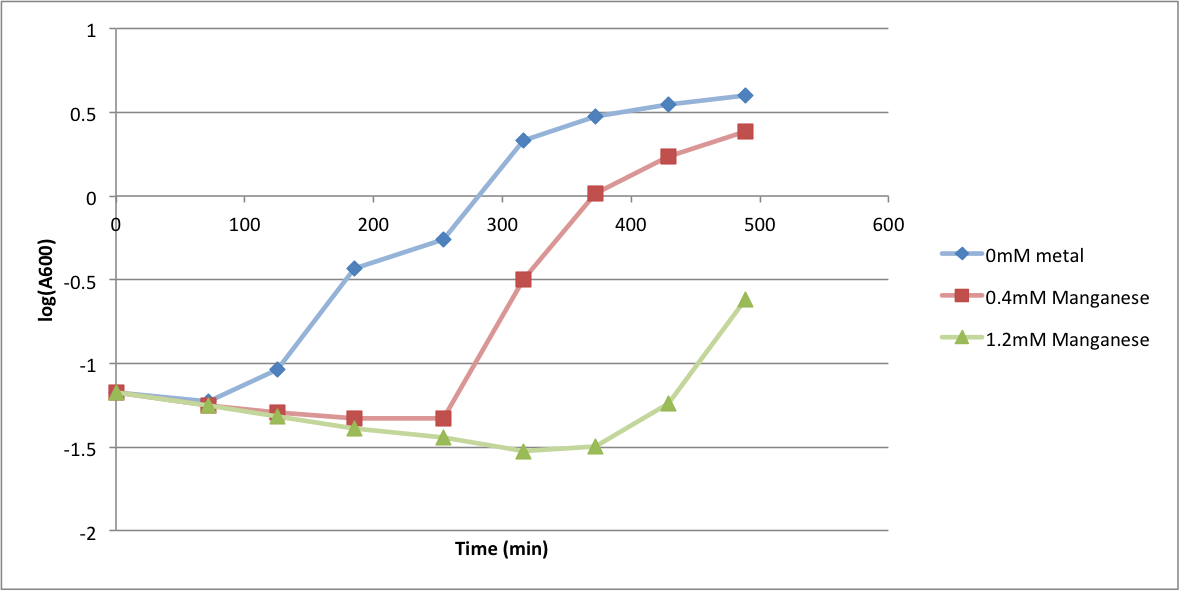
In order to better anticipate what conditions are best suitable from growth for our experimental strain, <i> Bacilus subtilis</i> 168, we tested the growth under various conditions relevant to the work we are going to perform. First we measured the growth curves at various ethanol concentrations to confirm the highest ethanol concentration suitable for cell growth, which was 4%, displayed bellow. Afterwards, we measured the growth curves at various concentrations of iron, copper, nickel, cobalt, zinc and manganese, displayed bellow. | In order to better anticipate what conditions are best suitable from growth for our experimental strain, <i> Bacilus subtilis</i> 168, we tested the growth under various conditions relevant to the work we are going to perform. First we measured the growth curves at various ethanol concentrations to confirm the highest ethanol concentration suitable for cell growth, which was 4%, displayed bellow. Afterwards, we measured the growth curves at various concentrations of iron, copper, nickel, cobalt, zinc and manganese, displayed bellow. | ||
Revision as of 17:57, 4 October 2013
Contents |
Characterisation of Bacillus subtilis 168 as a chassis
In order to better anticipate what conditions are best suitable from growth for our experimental strain, Bacilus subtilis 168, we tested the growth under various conditions relevant to the work we are going to perform. First we measured the growth curves at various ethanol concentrations to confirm the highest ethanol concentration suitable for cell growth, which was 4%, displayed bellow. Afterwards, we measured the growth curves at various concentrations of iron, copper, nickel, cobalt, zinc and manganese, displayed bellow.
Testing the Kanamycin resistance conferred by pTG262 (BBa_I742123) in B.subtilis and E.coli
B.subtilis 168 and E. coli JM109 were each transformed with the vector pTG262 (BBa_I742123) with an RFP biobrick insert cassette.
B.subtilis
WT B. ubtilis 168 and pTG262 transformed B.subtilis 168 colonies were used to inoculate 5ml LB medium in glass standard bottles which were incubated at 37C with shaking and loose lids for ~6h (pTG262 with 5mg.L-1 chloramphenicol to prevent vector loss). This culture was then diluted by a factor of 10-6 and 100ul was plated onto LB agar plates of varying kanamycin concentrations, and incubated overnight at 37C.
The number and size of colonies which grew on each of the agar plates was recorded.
E.coli test of growth on agar plates
WT E.coli JM109 and pTG262 transformed E.coli JM109 colonies used to inoculate 5ml LB medium in glass standard bottles which were incubated at 37C with shaking for 6h30m (pTG262 inoculated in duplicate with no antibiotic and 10mg.L-1 Kanamycin).
The OD600 of the cultures was measured:
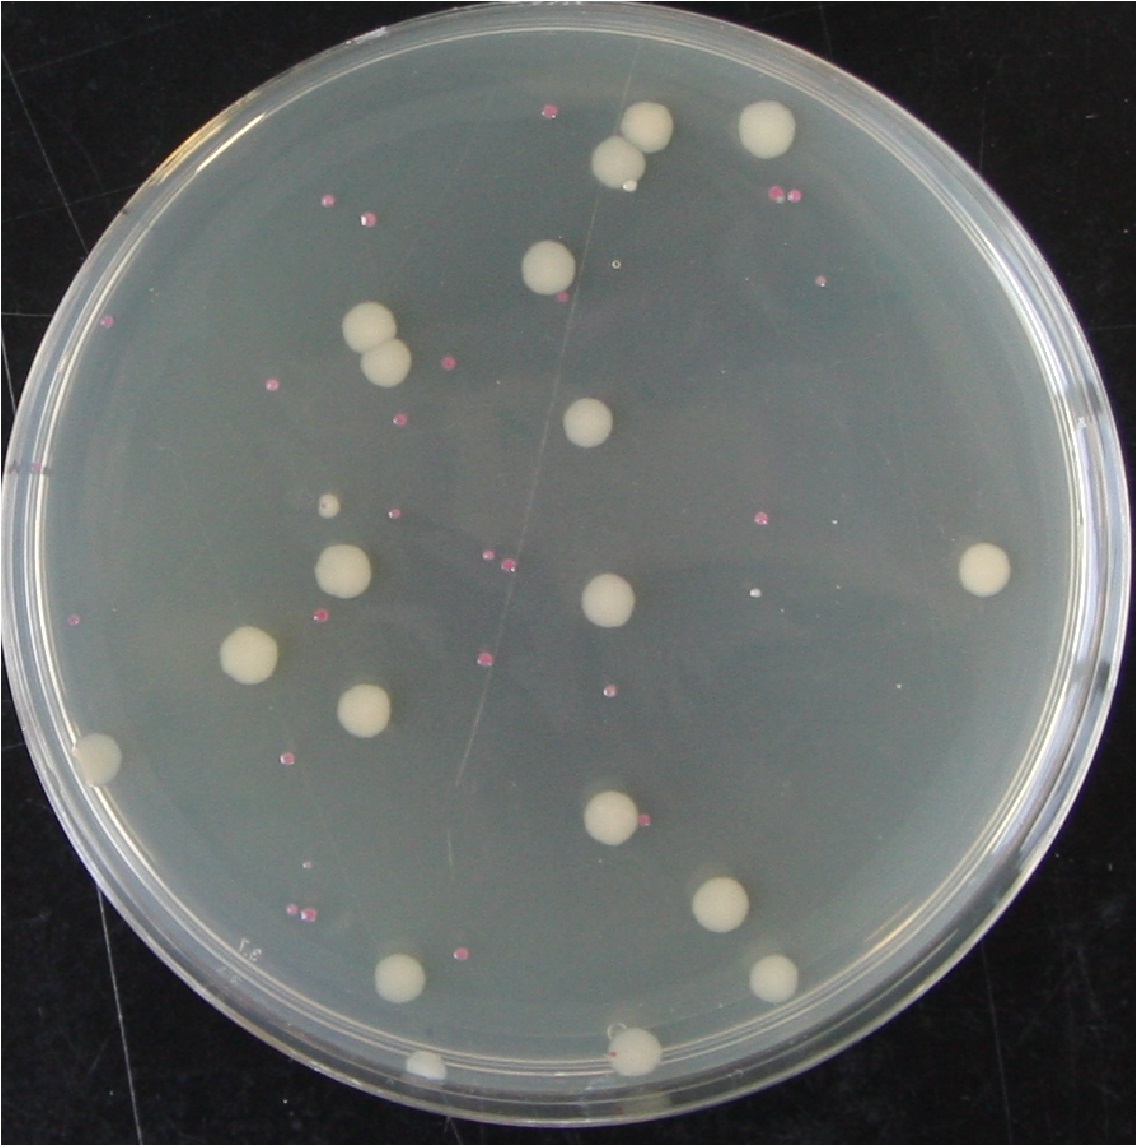
Each of the above cultures were diluted by factors of 10-5 and 10-6. Agar plates of varying kanamycin concentration were plated with 100ul aliquots of the dilutions, and incubated for ~36h at 37C. The number and colour of colonies was recorded (red indicating presence of pTG262, white being WT or representing loss of the plasmid before plating).
Figure 1. A plate from the above experiment after an additional 24 hours on the bench, pTG262 Kan0 10-5 dilution plated onto 0mg.L-1 Kanamycin. This shows the typical colony size as indicated in the above table. It demonstrates both presumed plasmid loss in overnight culture without antibiotic (white colonies) and the decreased growth rate of cells containing pTG262.
E. coli test of growth in Kanamycin liquid culture
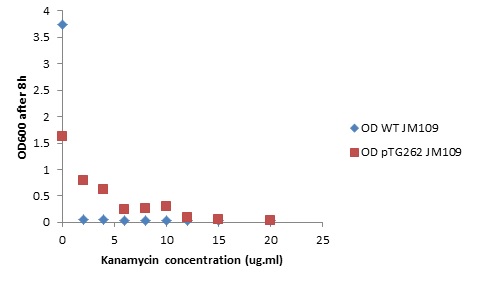
Overnight LB liquid cultures of WT E.coli JM109 and E.coli JM109 transformed with pTG262 were diluted 1:50 in fresh LB medium. 3ml aliquots of each were put in glass standard bottles, along with varying amounts of kanamycin. The Optical density at 600nm was measured at the start and after 8 hours incubation with shaking at 37C.
Initial OD600: WT JM109 - 0.030, pTG262 - 0.028.
OD600 after 8 hours incubation with shaking at 37C:

| 
| | | | 
|
| This iGEM team has been funded by the MSD Scottish Life Sciences Fund. The opinions expressed by this iGEM team are those of the team members and do not necessarily represent those of MSD | |||||
 "
"


