Team:SydneyUni Australia/Modelling Principles
From 2013.igem.org
Jbergfield (Talk | contribs) |
|||
| Line 4: | Line 4: | ||
__NOTOC__ | __NOTOC__ | ||
| - | |||
| - | |||
| - | |||
| - | |||
| - | |||
| - | |||
| - | |||
| - | |||
| - | |||
| - | |||
| - | |||
| - | |||
| - | |||
| - | |||
| - | |||
| Line 27: | Line 12: | ||
<div align="justify"> | <div align="justify"> | ||
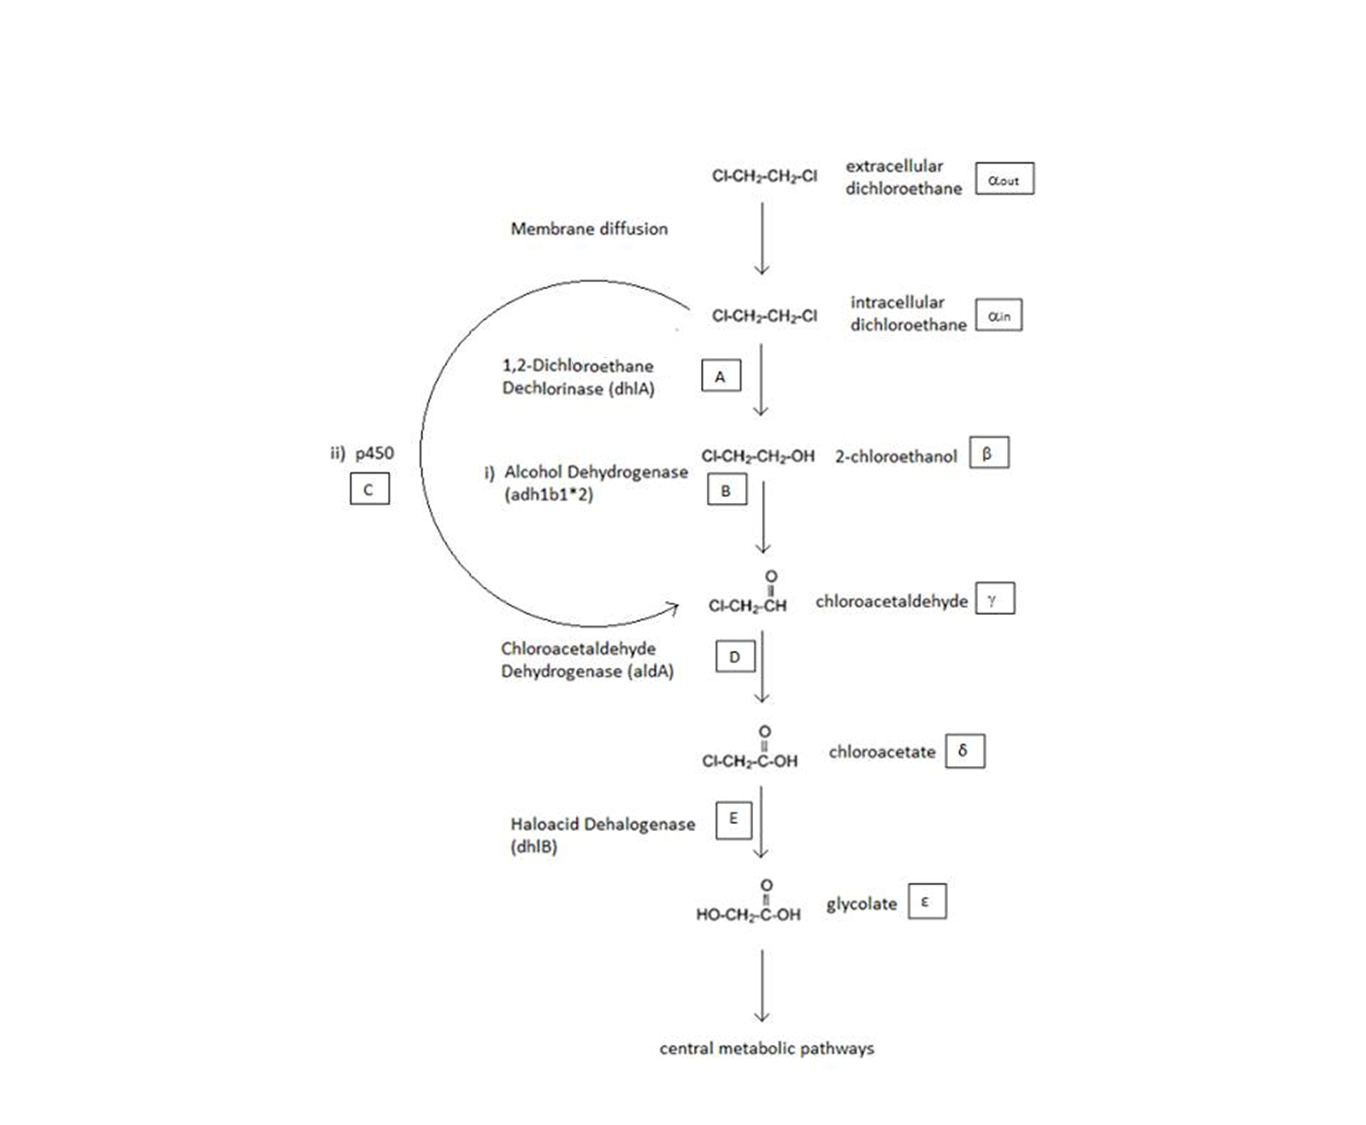
| - | + | The above figure is a simplified schematic of the 2 metabolic pathways which are considered. The symbols in squares signify the intracellular concentrations of the associated metabolite (greek letters) or enzyme (capitol English letters). These symbols will be used throughout the analysis. </div> | |
| Line 49: | Line 34: | ||
</center> | </center> | ||
| - | + | A table that summarises the enzymes that we used in both of the engineered metabolic pathways. The constants presented were (painstakingly) obtained from the literature (referenced). | |
| + | |||
| + | *values based on ethonal as a substrate | ||
| + | |||
=='''ODE Model'''== | =='''ODE Model'''== | ||
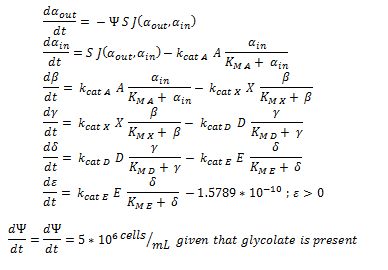
| - | + | Firstly, (and mainly for the mathematical modellers reading this) the overview of the system of ODEs describing the 2 different pathways: | |
| - | |||
| - | + | The non-monooxygenase pathway (with dhlA (A) and adh1b1*2 (B)). | |
| - | + | [[File:Igem ode 11.png|center]] | |
| - | |||
| - | |||
| - | |||
| - | |||
| - | |||
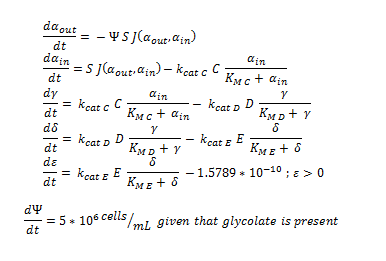
| + | The monooxygeanse pathway (with p450 (C)). | ||
| + | |||
| + | [[File:Igem ode 22.png|center]] | ||
| + | |||
| + | |||
| + | The 2 above system of ODEs were used to model 2 things: | ||
| + | 1.The rate at which extracellular DCA is removed from solution (given the number of cells in solution) . This is considering the rate at which DCA crosses the plasma membrane (from solution to cytoplasm) of all cells in solution. | ||
| + | 2. The rate at which the intracellular concentrations of the metabolic intermediates change over time within a single cell. This considers the relative activities of the enzymes of the metabolic pathway. | ||
| + | |||
| + | |||
| + | The symbols A, B, C, D & E represent the intracellular enzyme concentrations of 1,2-Dichloroethane Dechlorinase, Alcohol Dehydrogenase, Cytochrome p450, Chloroacetaldehyde Dehydrogenase and Haloacetate Dehydrogenase respectively. They have units of mM | ||
| + | The symbols α<sub>in</sub>, β, γ, δ and ε represent the intracellular concentrations of the metabolic intermediates DCA, 2-chloroethanol, chloroacetaldehyde, chloroacetate and glycolate respectively. They have units mM. | ||
| + | α<sub>out</sub> represents the extracellular concentration of DCA, ie the concentration of DCA in solution. It has units mM. | ||
| + | The symbol Ψ represents the concentration of cells in solution and has units cells/mL. | ||
| + | |||
| + | |||
| + | The function J(α<sub>out</sub>,α<sub>in</sub>) represents the rate which extracellular DCA moves across the plasma membrane and into the single cell (the flux rate). It is a function of the extra and intracellular concentrations of DCA and has a value of surface area per time m^2/s. The value S represents the average surface area of the cellular membrane of E. coli. By multiplying S by J one achieves the total amount of DCA flowing into a single cell per unit time. The total amount of DCA flowing from solution is achieved by multiplying Ψ by S and J. | ||
| + | |||
| + | |||
| + | =='''Construction of a model for the metabolic pathway'''== | ||
| + | |||
| + | |||
| + | Each line represents how the metabolic intermediate changes over time; this is dictated by the relative rate at which the intermediate is formed vs the rate at which it is used/removed. | ||
| + | So, for the metabolic component of the ODE, the rate at which the intracellular concentration of metabolites (β, γ, δ and ε) change over time is purely determined through the relative activity (described by MM equations) of the enzymes creating or removing the metabolite. The rate at which once substrate is removed is directly equal to the rate at which the associated product is created, for instance, the rate at which γ is removed is the rate at which δ is formed. | ||
| + | By observing how each intermediate simultaneously acts as a substrate and product, it is easy to see how this process gives rise to a connected system of equations. | ||
| + | |||
| + | (Luckily) the enzymes of our metabolic pathway are accurately described by MM kinetics and all constants were available in the literature. The system is based on the forward and reverse kinetic rate (k<sub>1</sub> and k<sub>-1</sub> respectively) of substrate-enzyme binding followed by the irreversible catalytic step of product formation (k<sub>2</sub>) as depicted in the figure below: | ||
| + | |||
| + | [[File:Igem pathway 1.png|center]] | ||
| + | |||
| + | The rate of catalysis for an enzyme is a function of the enzyme and substrate concentration and incorporates the catalytic constant k<sub>cat</sub> and the Michalies constant K<sub>M</sub>, which are given in most of the literature that involves enzyme kinetics. | ||
| + | |||
| + | [[File:Igem Re.jpg|center]] | ||
| + | |||
| + | The symbol R<sub>E</sub> denotes the reaction rate: ie the rate of product formation (which is equal to the rate of substrate removal). | ||
| + | |||
| + | [[File:Igem Re= dproduct.png|center]] | ||
=='''DCA Diffusion Across the Plasma Membrane'''== | =='''DCA Diffusion Across the Plasma Membrane'''== | ||
Revision as of 08:43, 18 October 2013


A Schematic of the Engineered Metabolic Pathway:
General Information regarding the Enzymes Involved in the Metabolic Pathway
| Enzyme | Gene | Symbol | Constants | Substrate | Product | Ref |
|---|---|---|---|---|---|---|
| 1,2-Dichloroethane Dechlorinase | dhlA | A | KM A = 0.53 mM, kcat A = 3.3 s-1 | DCA | 2-chloroethanol | [1] |
| Alcohol Dehydrogenase | Adhlb 1/2* | B | KM B = 0.94 mM, kcat B = 0.0871 s-1 | 2-chloroethanol | chloroacetaldehyde | [2] |
| p450 | p450 | C | KM C = 7.2 mM, kcat C = 89.8 s-1 | DCA | chloroacetaldehyde | [3] |
| Chloroacetaldehyde Dehydrogenase | aldA | D | KM D = 0.06mM, kcat D = 0.60 s-1 | chloroacetaldehyde | chloroacetate | [4] |
| Haloacetate Dehydrogenase | dhlB | E | KM E = 20 mM, kcat E = 25.4 s-1 | chloroacetate | glycolate | [5] |
A table that summarises the enzymes that we used in both of the engineered metabolic pathways. The constants presented were (painstakingly) obtained from the literature (referenced).
- values based on ethonal as a substrate
ODE Model
Firstly, (and mainly for the mathematical modellers reading this) the overview of the system of ODEs describing the 2 different pathways:
The non-monooxygenase pathway (with dhlA (A) and adh1b1*2 (B)).
The monooxygeanse pathway (with p450 (C)).
The 2 above system of ODEs were used to model 2 things:
1.The rate at which extracellular DCA is removed from solution (given the number of cells in solution) . This is considering the rate at which DCA crosses the plasma membrane (from solution to cytoplasm) of all cells in solution.
2. The rate at which the intracellular concentrations of the metabolic intermediates change over time within a single cell. This considers the relative activities of the enzymes of the metabolic pathway.
The symbols A, B, C, D & E represent the intracellular enzyme concentrations of 1,2-Dichloroethane Dechlorinase, Alcohol Dehydrogenase, Cytochrome p450, Chloroacetaldehyde Dehydrogenase and Haloacetate Dehydrogenase respectively. They have units of mM
The symbols αin, β, γ, δ and ε represent the intracellular concentrations of the metabolic intermediates DCA, 2-chloroethanol, chloroacetaldehyde, chloroacetate and glycolate respectively. They have units mM.
αout represents the extracellular concentration of DCA, ie the concentration of DCA in solution. It has units mM.
The symbol Ψ represents the concentration of cells in solution and has units cells/mL.
The function J(αout,αin) represents the rate which extracellular DCA moves across the plasma membrane and into the single cell (the flux rate). It is a function of the extra and intracellular concentrations of DCA and has a value of surface area per time m^2/s. The value S represents the average surface area of the cellular membrane of E. coli. By multiplying S by J one achieves the total amount of DCA flowing into a single cell per unit time. The total amount of DCA flowing from solution is achieved by multiplying Ψ by S and J.
Construction of a model for the metabolic pathway
Each line represents how the metabolic intermediate changes over time; this is dictated by the relative rate at which the intermediate is formed vs the rate at which it is used/removed. So, for the metabolic component of the ODE, the rate at which the intracellular concentration of metabolites (β, γ, δ and ε) change over time is purely determined through the relative activity (described by MM equations) of the enzymes creating or removing the metabolite. The rate at which once substrate is removed is directly equal to the rate at which the associated product is created, for instance, the rate at which γ is removed is the rate at which δ is formed. By observing how each intermediate simultaneously acts as a substrate and product, it is easy to see how this process gives rise to a connected system of equations.
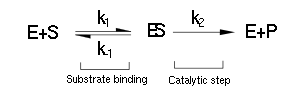
(Luckily) the enzymes of our metabolic pathway are accurately described by MM kinetics and all constants were available in the literature. The system is based on the forward and reverse kinetic rate (k1 and k-1 respectively) of substrate-enzyme binding followed by the irreversible catalytic step of product formation (k2) as depicted in the figure below:
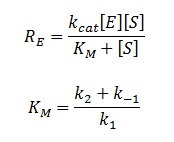
The rate of catalysis for an enzyme is a function of the enzyme and substrate concentration and incorporates the catalytic constant kcat and the Michalies constant KM, which are given in most of the literature that involves enzyme kinetics.
The symbol RE denotes the reaction rate: ie the rate of product formation (which is equal to the rate of substrate removal).
DCA Diffusion Across the Plasma Membrane
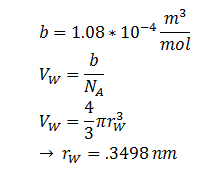
The diffusion of DCA across the cell membrane was modelled based on Fick’s first law of diffusion:
In Summary, the flux across the membrane is:
| Symbol | Name | Value (units) | Ref |
|---|---|---|---|
| η | Cellular Membrane Viscosity | 1.9 kg/m/s | [6] |
| S | E. coli Membrane Surface Area | 6x10-12 m2 | [7] |
| r | DCA radius | 0.3498 nm | [8] |
| Kow | Octanol-water Partition Coefficient for DCA | 28.2 | [9] |
| d | Length of Cellular Membrane | ??? | [10] |
Extending the System to Cell Cultures
By applying this change, the resulting values of αin,αout, β, γ & δ represent the metabolite concentration across all cells.
Furthermore the cells are expected to grow due to the production of glycolate (which can be used as a carbon source for growth).
 "
"
