Team:Tokyo Tech/Experiment/phoA Promoter Assay
From 2013.igem.org
| Line 119: | Line 119: | ||
<h1>5. Modeling </h1> | <h1>5. Modeling </h1> | ||
<h2> | <h2> | ||
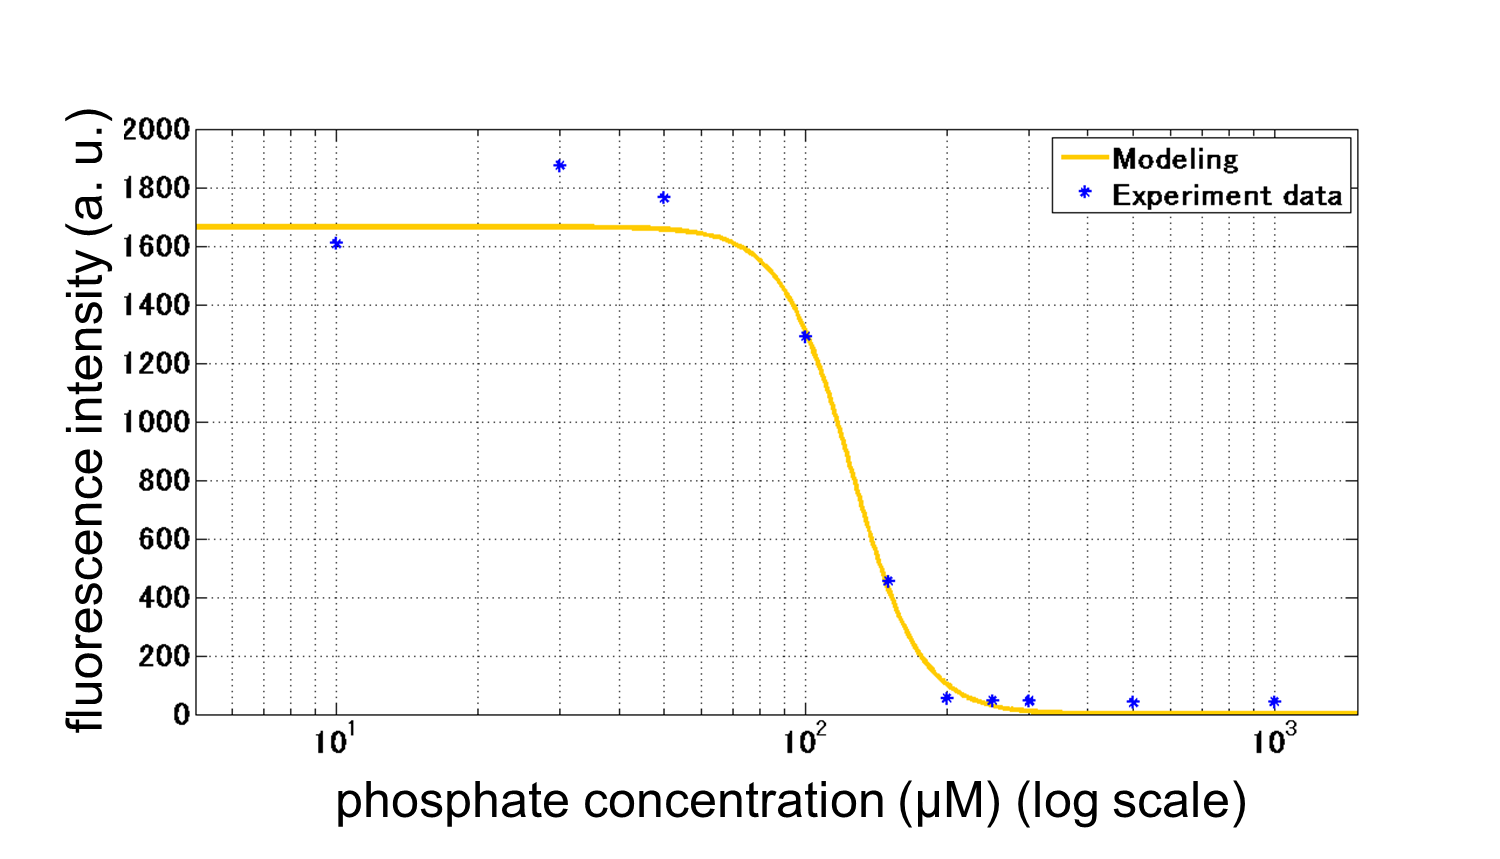
| - | <p>From our results | + | <p>From our results above, we determined parameters for the induction mechanism. By fitting the results to the following Hill equation (Fig. 3-5-21), we identified the parameters for the induction mechanism. α denotes the maximum GFP expression rate in this construct. m denotes the phosphate concentration at which the GFP expression rate is half of α. β denotes the hill coefficient. Those parameters (Fig. 3-5-22) can be used in future modeling. |
| + | Plants are reported to be in phosphate starvation when its concentration is below 1 mM (Hoagland et al., 1950). Our part can sense the concentration below 1 mM, too (Fig. 3-5-23). Therefore, our improved part is useful for our farming circuit. | ||
</p> | </p> | ||
</h2> | </h2> | ||
<gallery widths="350" style="margin-left:auto; margin-right:auto;"> | <gallery widths="350" style="margin-left:auto; margin-right:auto;"> | ||
| - | Image:Titech2013_phoa_Fig_3-5-17.png|Fig. 3-5- | + | Image:Titech2013_phoa_Fig_3-5-17.png|Fig. 3-5-21. Equation for the induction mechanism |
| - | Image:Titech2013_phoa_Fig_3-5-18.png|Fig. 3-5- | + | Image:Titech2013_phoa_Fig_3-5-18.png|Fig. 3-5-22. Determined parameters |
| + | α denotes the maximum GFP expression rate in this construct. m denotes the phosphate concentration at which the GFP expression rate is half of α. β denotes the hill coefficient. | ||
</gallery> | </gallery> | ||
| - | [[Image:Titech2013_phoa_Fig_3-5-19.png|450px|thumb|center|Fig. 3-5- | + | [[Image:Titech2013_phoa_Fig_3-5-19.png|450px|thumb|center|Fig. 3-5-23. A model with fitting the results of our assay]] |
| - | <h1>6. | + | <h1>6. References</h1> |
<h2><OL> | <h2><OL> | ||
| - | <LI>M. Dollard | + | <LI>M. Dollard and P. Billard. (2003) Whole-cell bacterial sensors for the monitoring of phosphate bioavailability. Journal of Microbiological Methods, 55, 221– 229 |
| - | <LI>H. Shinagawa | + | <LI>H. Shinagawa, K. Makino and A. Nakata. (1983) Regulation of the pho Regulon in Escherichia coli K-12. Genetic and Physiological Regulation of the Positive Regulatory Gene phoB. J. Mol. Biol, 168, 477-488 |
| - | <LI>Y. Hsieh | + | <LI>Y. Hsieh and B. L. Wanner. (2010) Global regulation by the seven-component Pi signaling system. Current Opinion in Microbiology, 13, 198-203 |
| - | <LI>F. Neidhardt | + | <LI>F. C. Neidhardt, P. L. Bloch and D. F. Smith. (1974) Culture Medium for Enterobacteria. Journal of Bacteriology, 119(3), 736-47 |
<LI>CCG/UNAM. Regulon DB. http://regulondb.ccg.unam.mx/index.jsp | <LI>CCG/UNAM. Regulon DB. http://regulondb.ccg.unam.mx/index.jsp | ||
(accessed 2013-09-25) | (accessed 2013-09-25) | ||
Revision as of 14:50, 27 October 2013
phoA Promoter Assay
Contents |
1. Introduction
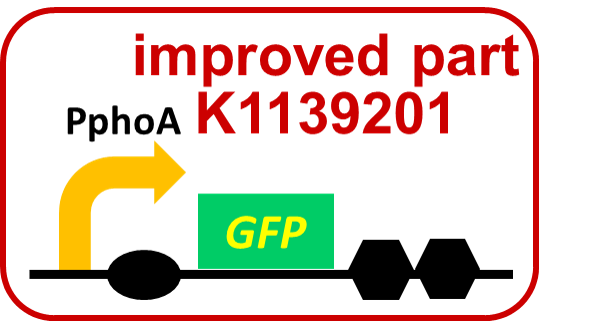
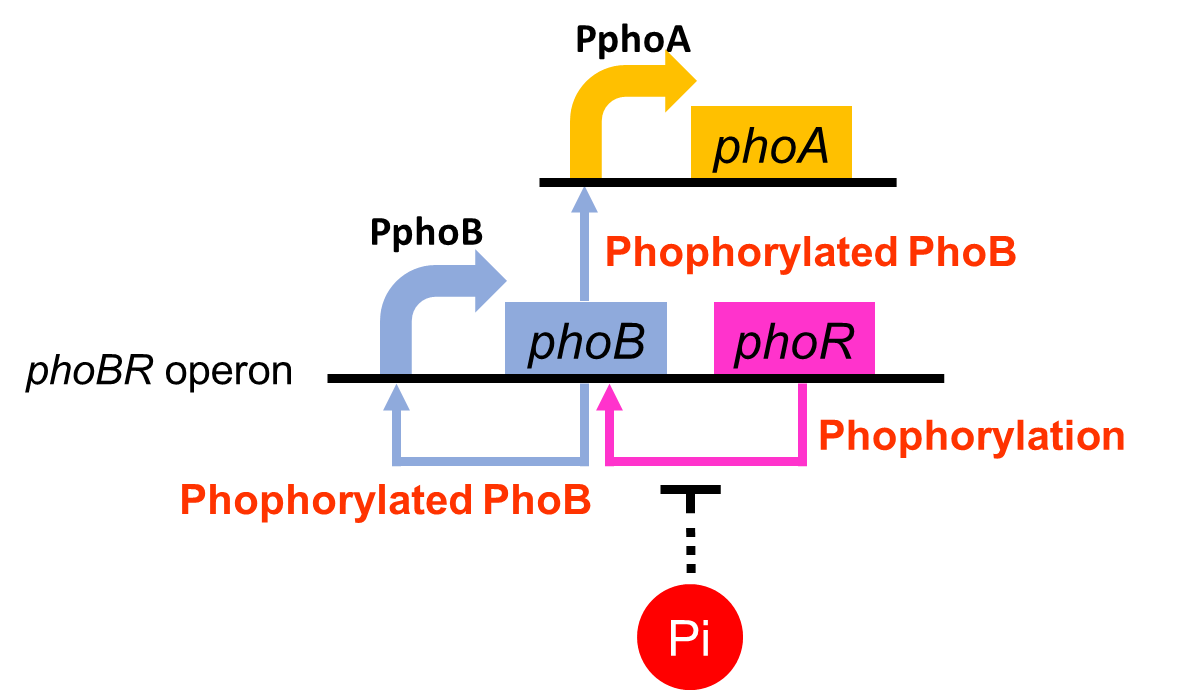
To realize our farming project, we improved a phosphate sensor part since the existing phosphate sensor part does not have sufficient data (OUC-China 2012,[http://parts.igem.org/Part:BBa_K116401 BBa_K116401]). Our part ([http://parts.igem.org/Part:BBa_K1139201 BBa_K1139201], Fig. 3-5-1) includes the inducible promoter of the alkaline phosphatase gene (phoA) derived from E.coli (Dollard et al., 2003). The phoA promoter is repressed by high phosphate concentrations. Fig. 3-5-2 shows the regulation of the phoA promoter in brief. The phoA promoter is regulated by phoB and phoR, which belong to pho regulon (Shinagawa et al., 1983). Phosphorylated PhoB directly activates the expression of phoA. Under conditions of phosphate limitation, PhoR phosphorylates PhoB. On the other hand, under conditions of high phosphate concentrations, PhoR dephosphorylate phospho-PhoB (Hsieh et al., 2010). We amplified the phoA promoter from E. coli (MG1655). We ligated this promoter upstream of GFP part and introduced this part into E. coli (MG1655). By following induction assay, we confirmed that the phoA promoter was actually repressed by the increase in phosphate concentration.
2. Materials and Methods
2-1. Construction
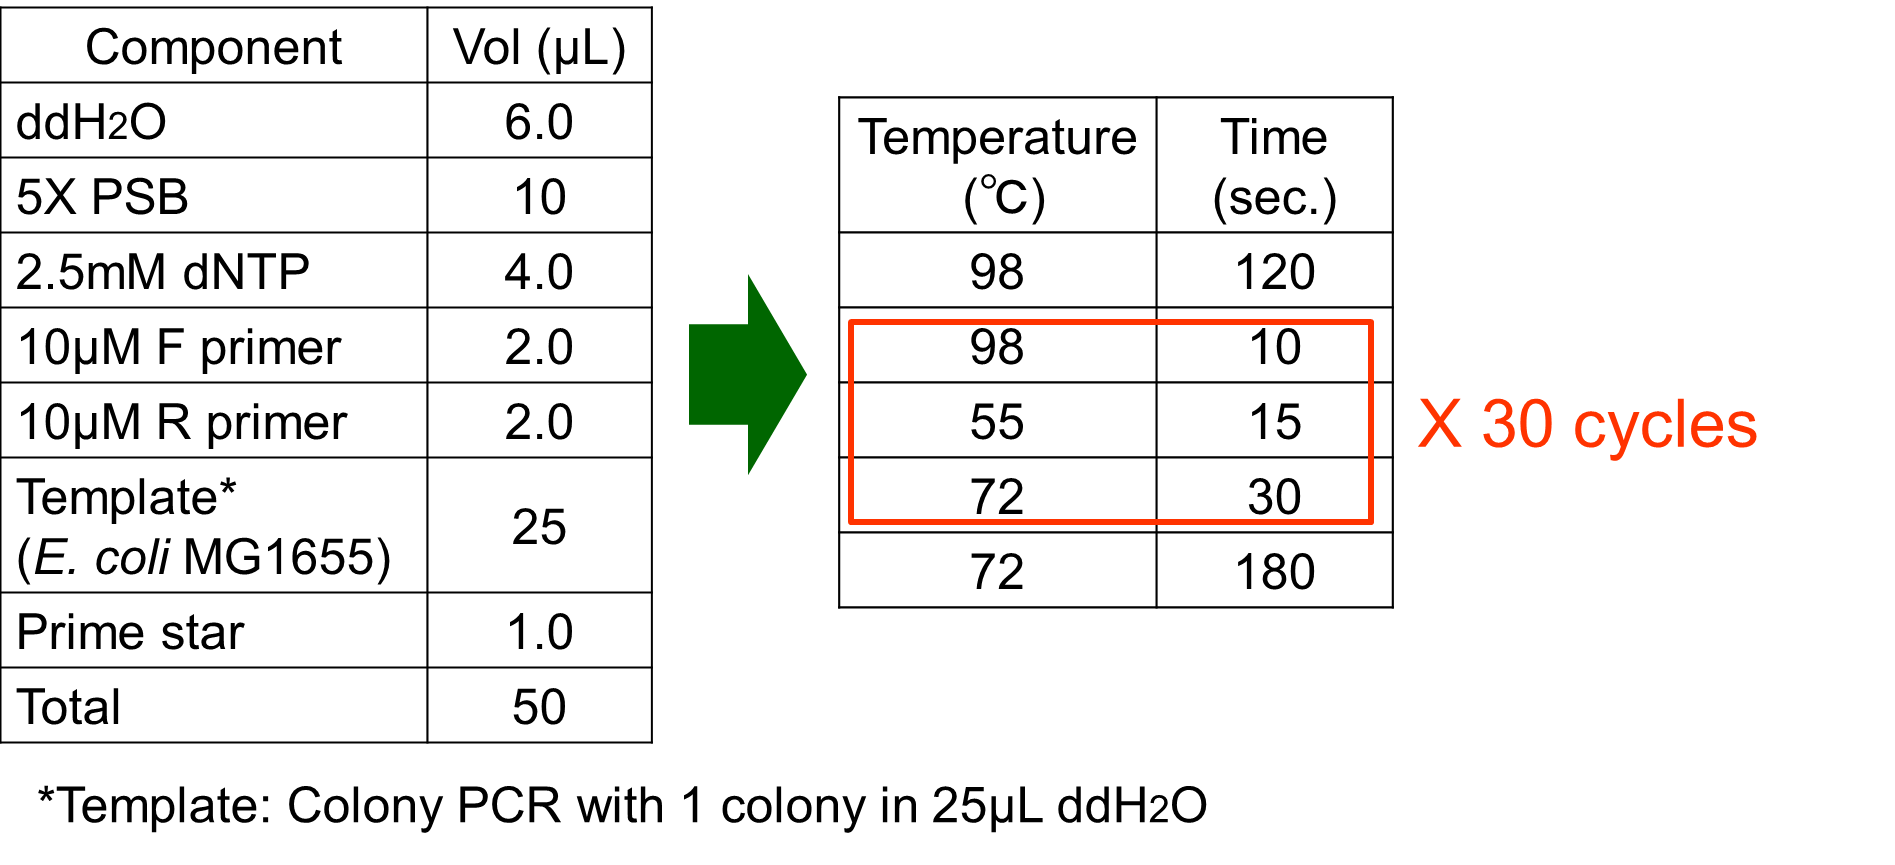
The phoA promoter region of E. coli was amplified from MG1655 genomic DNA by PCR using upstream primer (5’-acgtgaattcgcggccgcttctagagaaagttaatcttttcaacagctgtcataaag-3’) and downstream primer (5’ccgctactagtaaatacattaaaaaataaaaacaaagcgactataagtctc-3’). Amplification was carried out with the steps shown in Fig. 3-5-6.
2-2. Assay Protocol
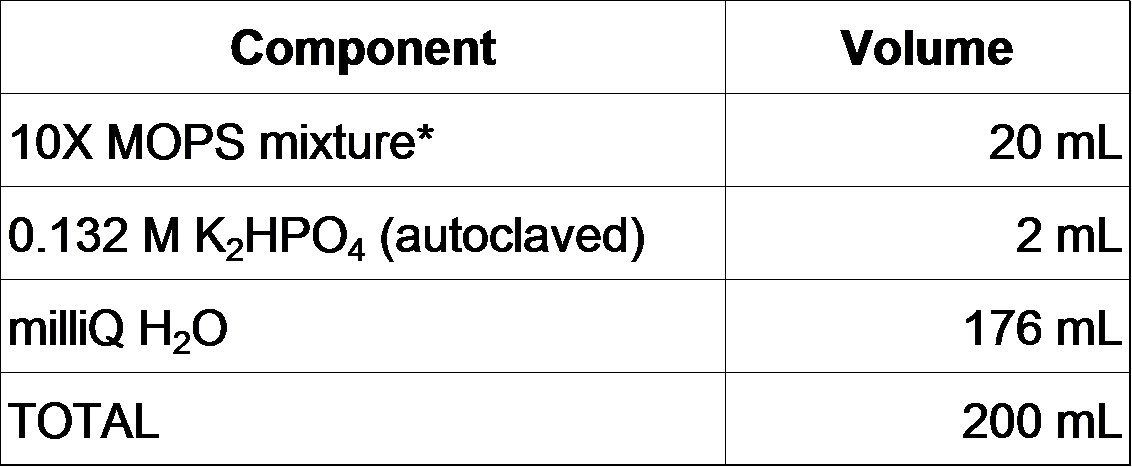
2-2-0. Prepare MOPS minimal medium as follows (Neidhardt et al., 1974).
Also, prepare a series of phosphate concentration gradient 1X MOPS by changing the volume of K2HPO4 (We prepared the series as 0, 10, 30, 50, 100, 150, 200, 250, 300, 500, 1000 microM).
[Prepare MOPS minimal medium]
200 mL of 1X MOPS is prepared as follows.
- Mix ingredients above and adjust the pH to 7.2 with 5 M NaOH.
- Filter sterilize. It can be stored at 4°C for up to 1 month.
- Before use, add carbon source (we used a final concentration of 0.1% glucose).
*10X MOPS mixture (200 mL)
- Add the following to ~60 mL milliQ H2O:
- Add 5 M KOH to a final pH of 7.4.
- Bring total volume to 88 mL.
- Make fresh FeSO4 solution and add it to the MOPS/Tricine solution:
- Add the following solutions to the MOPS/Tricine/FeSO4 solution (Mix in the order shown).
- Filter sterilize with 0.2 micron filter.
- Aliquot into sterile plastic bottle and freeze at -20°C.
**Micronutrient stock (50 mL)
Mix everything together in 40 mL autoclaved milliQ H2O, bring up total volume to 50 mL. Store at room temperature.
- Prepare overnight culture of BBa_K1139201, positive control and negative control, each in MOPS medium (including 1.32 mM K2HPO4) containing ampicillin (50 microg/mL) at 37°C.
- Dilute the overnight cultures to an OD600 of 0.1 in fresh MOPS medium (3 mL) containing ampicillin (50 microg/mL). (→fresh cultures)
- Incubate the fresh cultures until the observed OD600 reaches 0.4-0.6.
- Centrifuge the cells at 6,000g, 25°C, 10 minutes. Wash twice with MOPS minimal medium without phosphate, containing ampicillin (50 microg/mL). Then, suspend the cells in the same medium to obtain a final OD600 of 10.
- Add 300 microL of prepared cell suspension to 2.7 mL of test solution, the series of phosphate concentration gradient 1X MOPS, containing ampicillin (50 microg/mL).
- Incubate the cells for 140 minutes at 26°C.
- 1 mL of each culture was harvested by centrifugation and suspended by adding 1 mL of PBS (phosphate-buffered saline). Dilute the suspension to obtain a final OD600 of around 0.2 by PBS.
- Dispense 600 microL of each suspension into a disposable tube through a cell strainer. Fluorescence intensity was measured with a flow cytometer of Becton, Dickinson and Company.
3. Results
3-1. Before inducing by phosphate concentration
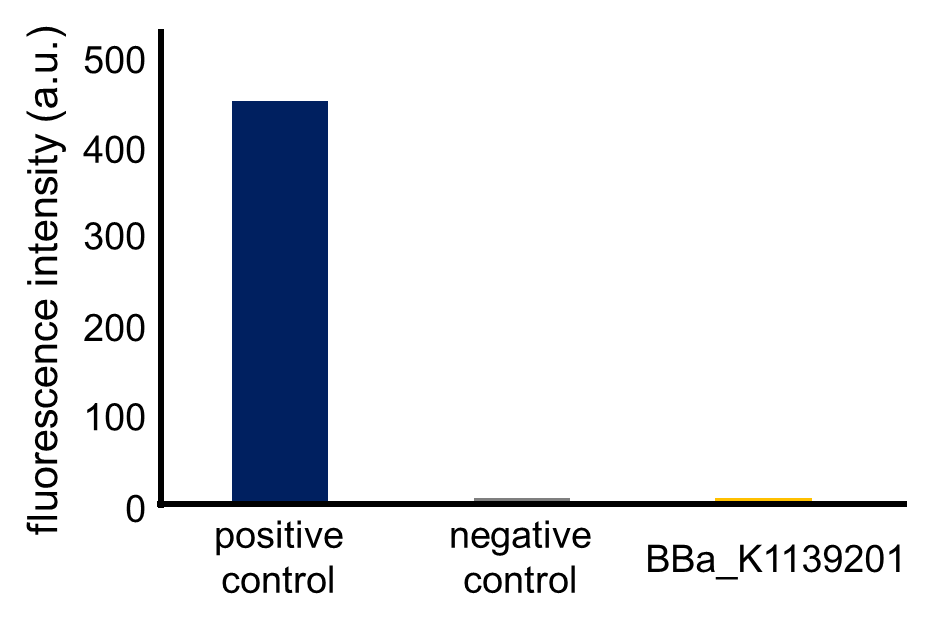
Fig. 3-5-12 shows the fluorescence intensity of the fresh cultures (the MOPS medium which contains 1.32 mM K2HPO4) incubated until the observed OD600 reached 0.4-0.6 (Assay protocol 2-2-3). The phoA promoter was repressed because the MOPS medium contained 1.32 mM phosphate, which was a high concentration for phoA promoter.
3-2. After inducing by phosphate concentration
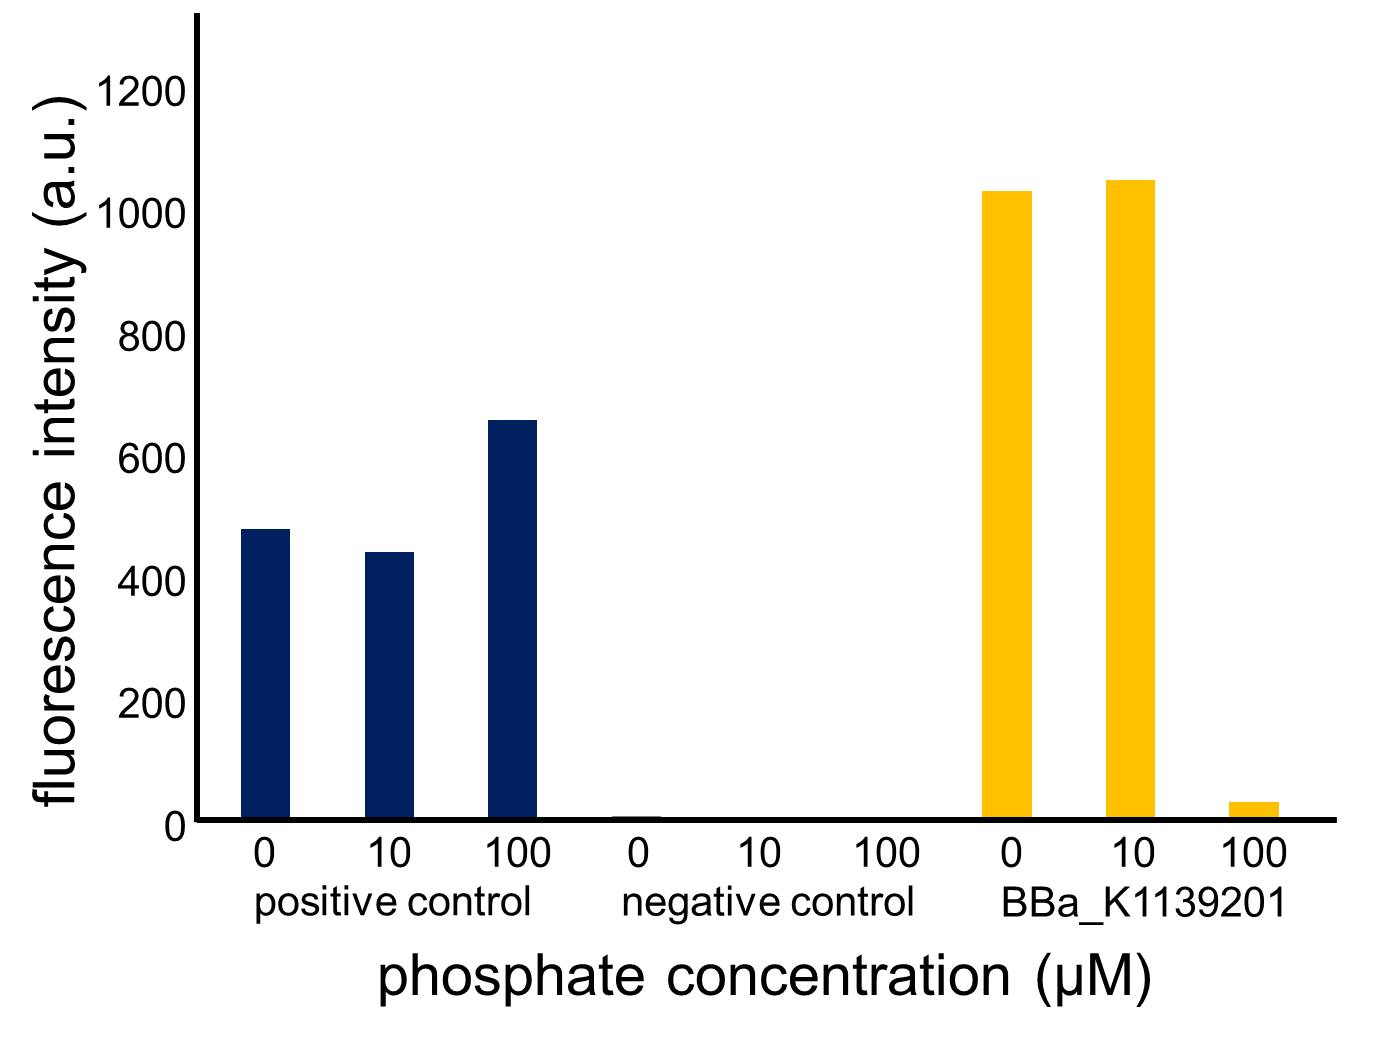
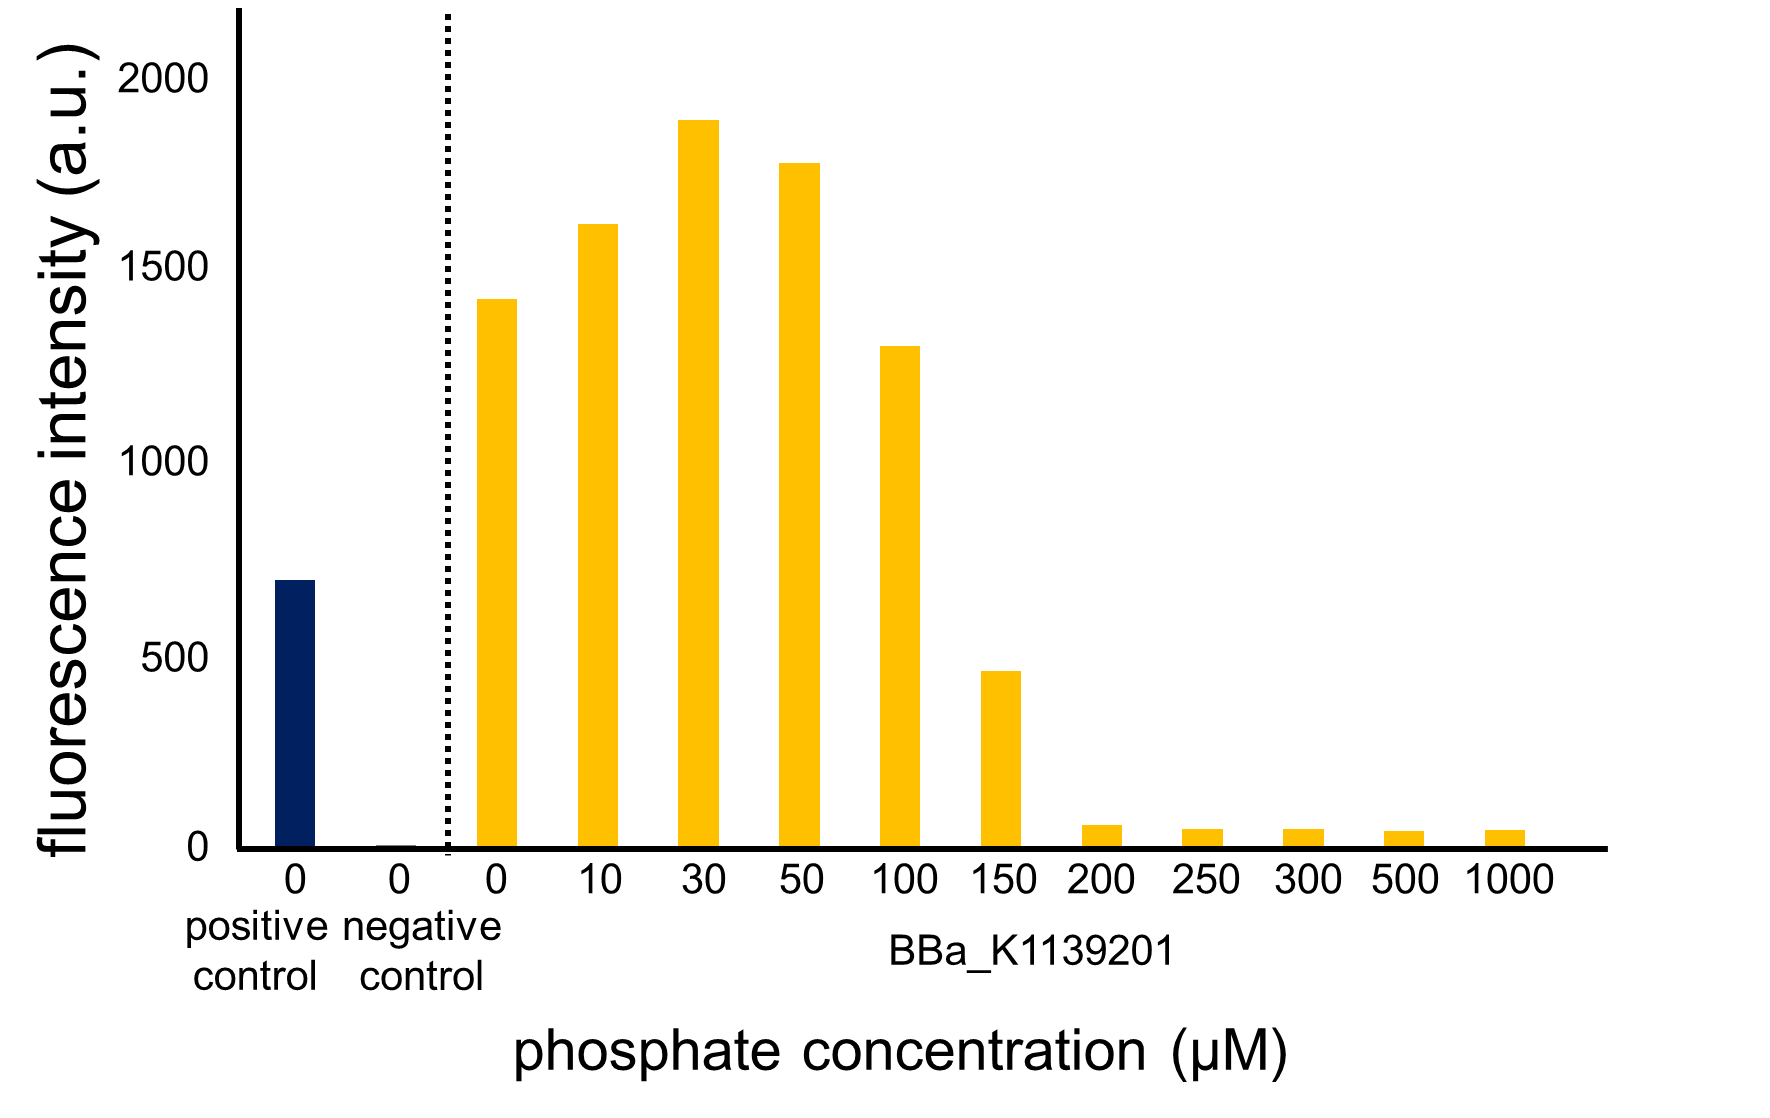
Fig. 3-5-13 and Fig. 3-5-14 show the fluorescence intensity of the induced cells by phosphate concentration. In Fig. 3-5-13, we saw that the phoA promoter was repressed by high phosphate concentrations, while the constitutive promoter did not show any significant change. Fig. 3-5-14 also proved that the increase in phosphate concentration repressed the phoA promoter. Fig. 3-5-15 shows the picture of fluorescence of the induced cells. Especially, we confirmed that the phoA promoter was drastically repressed at phosphate concentrations of 100 to 200 microM.
4. Discussion
We confirmed that the increase in phosphate concentration repressed the phoA promoter and succeeded in improving the phosphate sensor part.
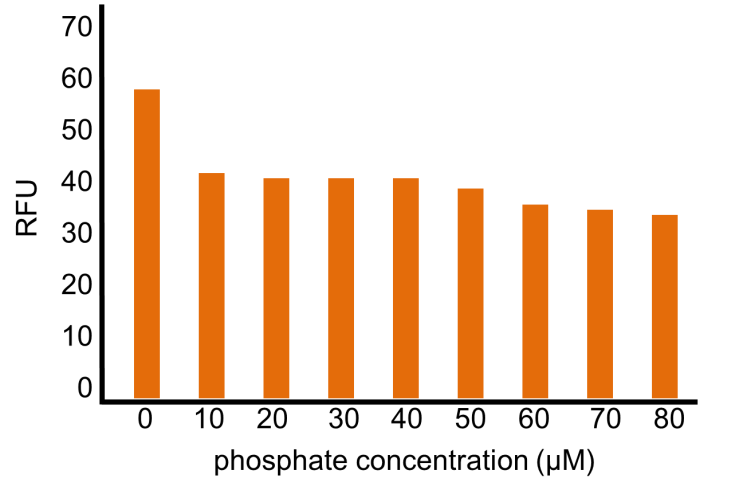
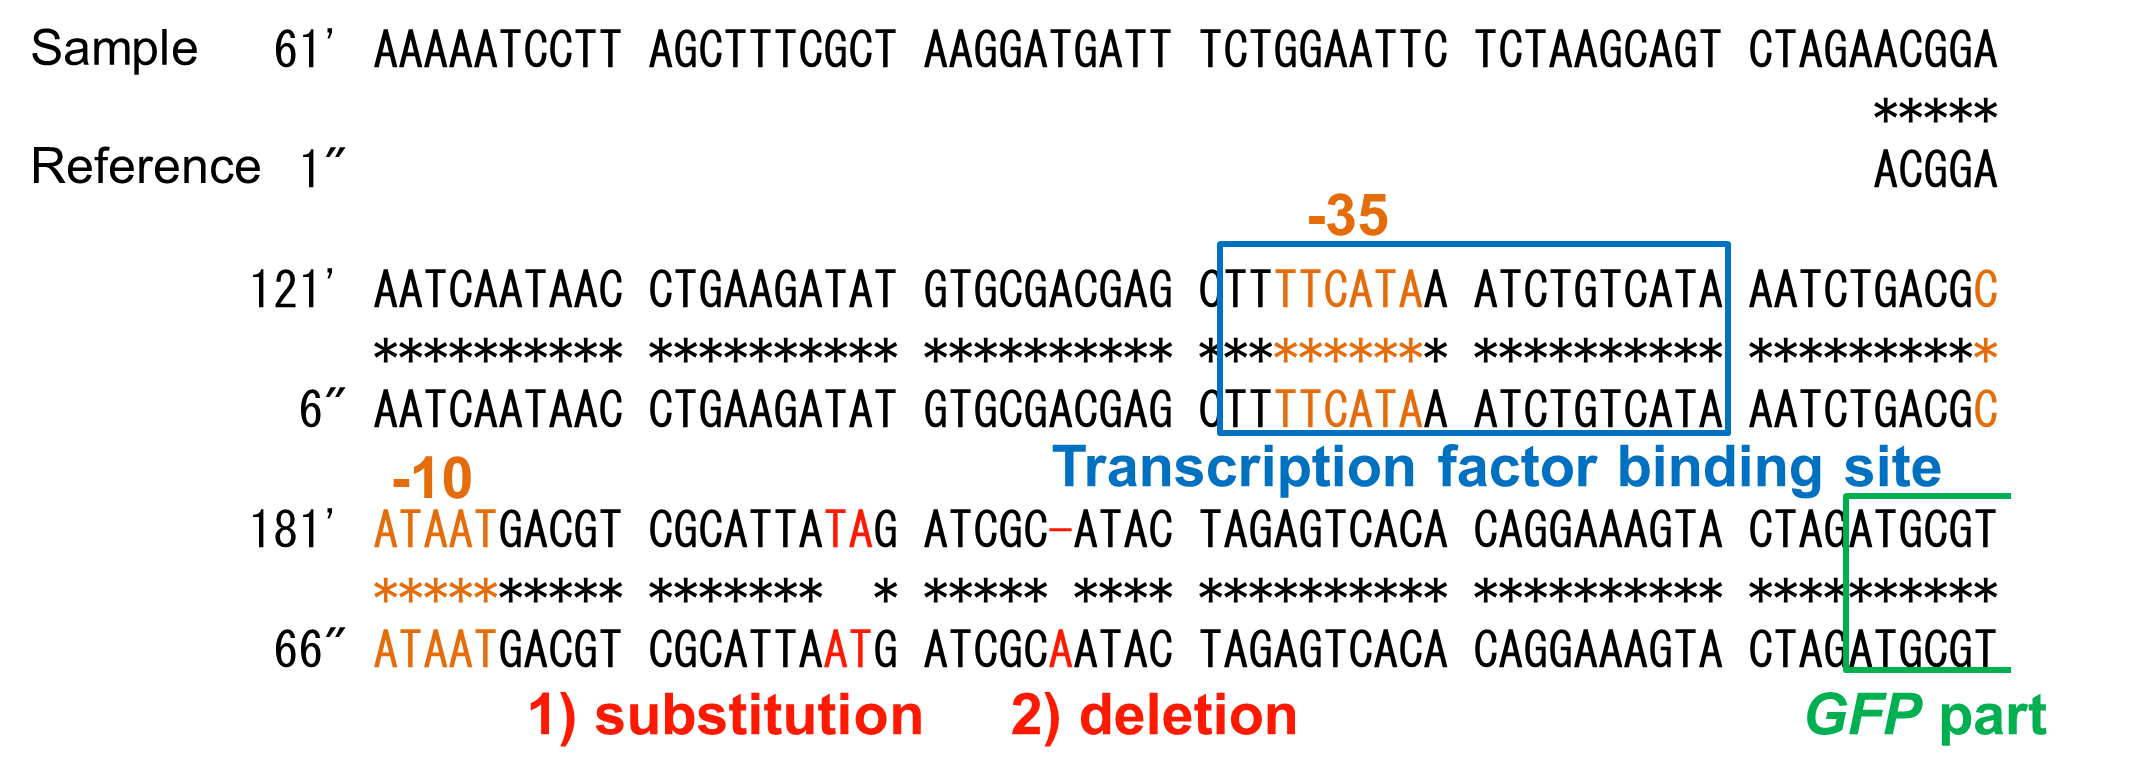
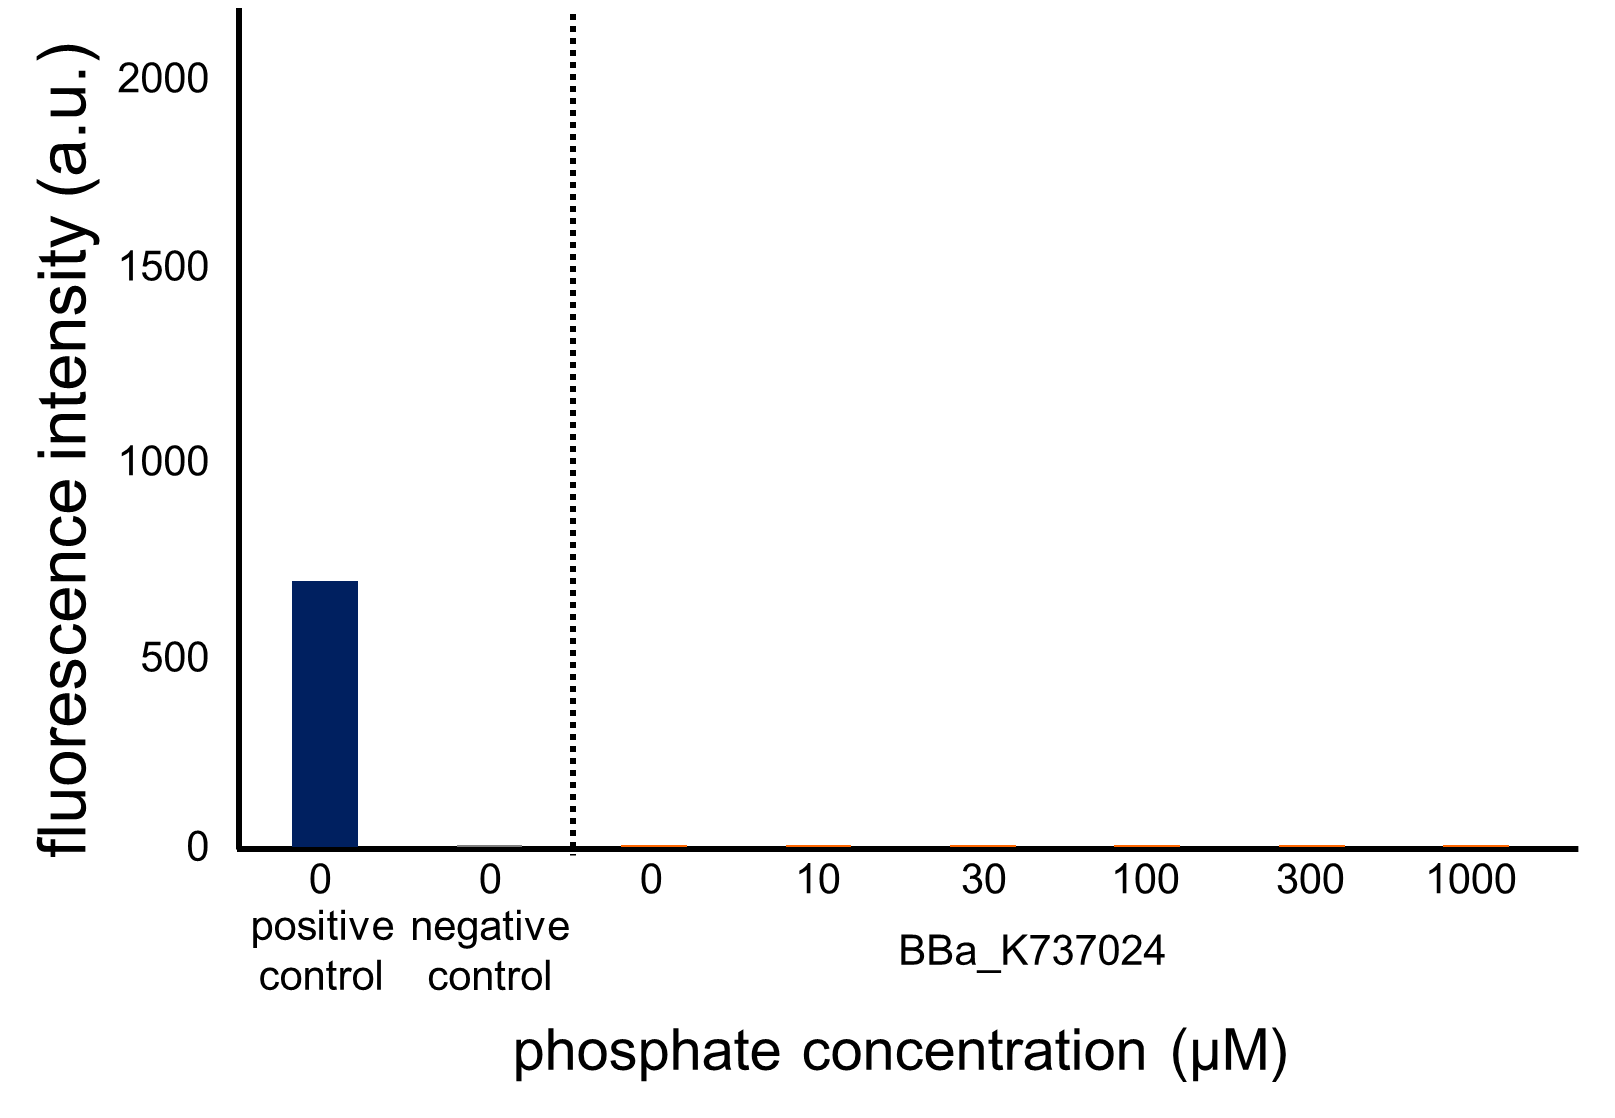
Though OUC-China 2012 reported a phosphate sensor part including the phoB promoter ([http://parts.igem.org/Part:BBa_K116401 BBa_K116401]), their part did not have sufficient data for us. Their assay data (Fig. 3-5-16, converted to bar chart) did not show significant change in RFU (relative fluorescent unit) in response to phosphate concentrations. The positive and the negative control were not shown. Their references for constructing and assaying the part were not clear, either. In addition, we found some mutations in their part through analyzing the DNA sequence (Fig. 3-5-17).
We found two mutations (substitution and deletion) in their part through analyzing the DNA sequence.
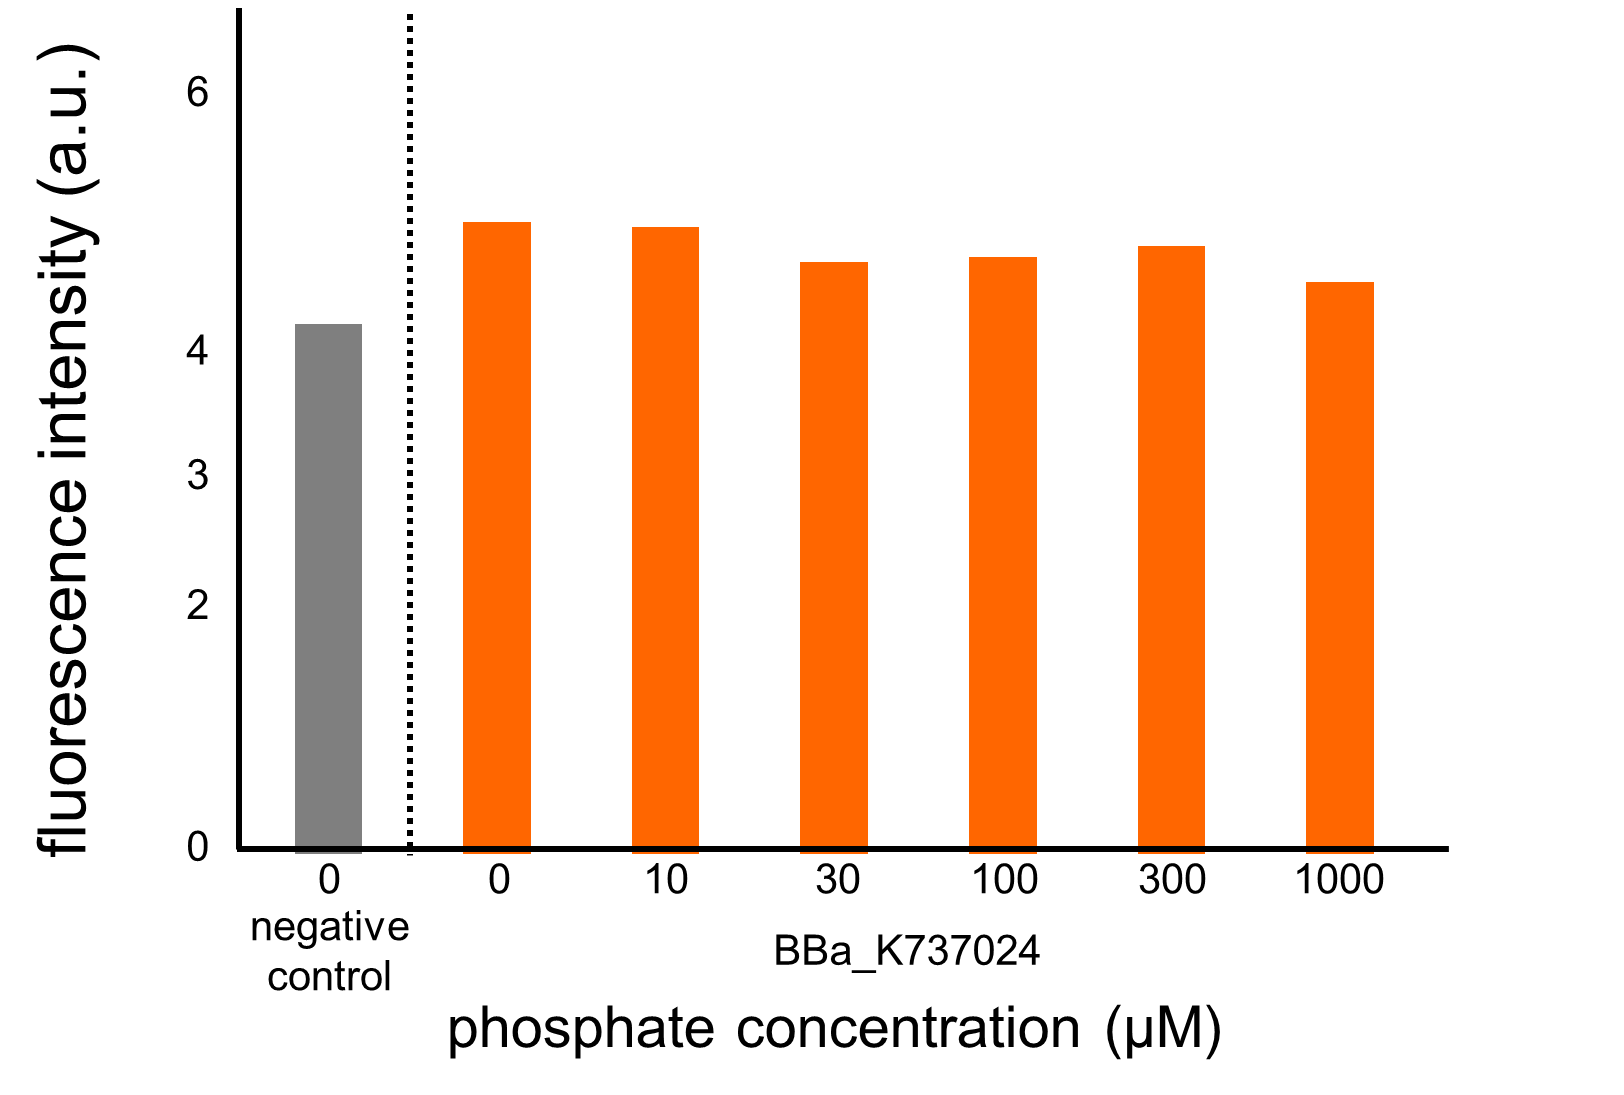
We assayed OUC-China’s phosphate sensor part by the same method as that for our phoA promoter assay since we thought that the phoB promoter should also be repressed by high phosphate concentrations. According to previous reports, the regulation of the phoB promoter is similar to that of the phoA promoter (Fig. 3-5-2, Shinagawa et al., 1983). The result of this assay (Fig. 3-5-19, enlarged view in Fig. 3-5-20) shows clearly that their part did not respond to the increase in phosphate concentration compared to our part including the phoA promoter (Fig. 3-5-18). Therefore, we hypothesize that the mutations have something to do with the activity of the phoB promoter.
Thus, we conclude that we improved the phosphate sensor part. Our part can be useful not only for our project but also for various studies in synthetic biology.
5. Modeling
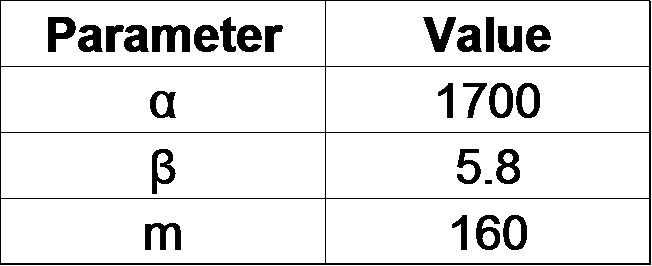
From our results above, we determined parameters for the induction mechanism. By fitting the results to the following Hill equation (Fig. 3-5-21), we identified the parameters for the induction mechanism. α denotes the maximum GFP expression rate in this construct. m denotes the phosphate concentration at which the GFP expression rate is half of α. β denotes the hill coefficient. Those parameters (Fig. 3-5-22) can be used in future modeling. Plants are reported to be in phosphate starvation when its concentration is below 1 mM (Hoagland et al., 1950). Our part can sense the concentration below 1 mM, too (Fig. 3-5-23). Therefore, our improved part is useful for our farming circuit.
Α denotes the maximum GFP expression rate in this construct. m denotes the phosphate concentration at which the GFP expression rate is half of α. β denotes the hill coefficient.
|
 "
"


