Team:Paris Bettencourt/Project/Target
From 2013.igem.org
| Line 162: | Line 162: | ||
Upon successful cloning of the three genes into our <i>E. coli</i> deletion strain, we continued to confirm that all three genes are required for growth on minimal media. Our two synthetic pathways were found to rescue growth on a sulfurless amino acid supplemented minimal media. We hope that this technique of using synthetic biology to overcome problems faced in naturally occurring systems will be both a large boon to the pursuit of finding novel drug candidates in <i>M. tuberculosis</i> and more broadly as this technique can be used for high-throughput screening of any pathway that can be constructed to be essential for growth in <i>E. coli</i>. | Upon successful cloning of the three genes into our <i>E. coli</i> deletion strain, we continued to confirm that all three genes are required for growth on minimal media. Our two synthetic pathways were found to rescue growth on a sulfurless amino acid supplemented minimal media. We hope that this technique of using synthetic biology to overcome problems faced in naturally occurring systems will be both a large boon to the pursuit of finding novel drug candidates in <i>M. tuberculosis</i> and more broadly as this technique can be used for high-throughput screening of any pathway that can be constructed to be essential for growth in <i>E. coli</i>. | ||
</p> | </p> | ||
| + | </br> | ||
| + | <p><b>Figure 9:</b> Growth of zmSIR <i>E. coli</i> on minimal media. <div style="font-size: 90%">BL21 (DE3) ΔcysI cells transformed with 1, 2 and 3 genes of the 3-gene zmSIR synthetic pathway were grown for 24 hours on minimal media supplemented with 25 uM IPTG (see methods), along with a WT BL21 (DE3) serving as a negative control, and an untransformed BL21 (DE3) ΔcysI, as negative control. Rescue of growth required all genes of the synthetic pathway (SIR, FNR and FD). </div></p> | ||
</div> | </div> | ||
<div class="rightparagraph"> | <div class="rightparagraph"> | ||
<a href="https://static.igem.org/mediawiki/2013/8/85/PS_D_Figure1_plate.png" target="_blank"><img src="https://static.igem.org/mediawiki/2013/8/85/PS_D_Figure1_plate.png" width="535px"/></a> | <a href="https://static.igem.org/mediawiki/2013/8/85/PS_D_Figure1_plate.png" target="_blank"><img src="https://static.igem.org/mediawiki/2013/8/85/PS_D_Figure1_plate.png" width="535px"/></a> | ||
| - | + | ||
</div> | </div> | ||
<div style="clear: both;"></div> | <div style="clear: both;"></div> | ||
Revision as of 03:39, 29 October 2013


Background
SirA is an essential gene in latent tuberculosis infections
Results
- Produced an E. coli strain which relies upon mycobacterial sirA, fprA and fdxA genes to survive in M9 minimal media
- Demonstrated that E. coli can survive with mycobacterial sulfite reduction pathway with Flux Balance Analysis
- Located drug target sites on sirA as well as identified high structural similarity between cysI and sirA through structural anaylsis
Aims
To perform a drug screen targeted at the sirA gene from mycobacteria
Skip to Introduction
Skip to Modeling
Skip to Design
Skip to Results
Introduction
SirA is essential for M. tuberculosis persistence phenotype as sulfur containing amino acids are particularly sensitive to oxidative stress within the macrophage and must regularly be replaced (Pinto et al 2007). Currently, there are no drug candidates that are known to specifically inhibit SirA and conventional drug screens involve do not provide information regarding the mechanism of drug action nor do compounds that inhibit exponential growth necessarily have an effect on persistent TB. We designed a working drug screen assay to specifically target the mycobacterial sulfite reductase protein SirA. To this end we cloned Ito E. coli the sulfite reduction pathway of M. smegmatis, a non-pathogenic mycobacterial relative of M. Tuberculosis. Our model overcomes the problem of long doubling time of M. tuberculosis. Specific inhibition of the sulfite reduction pathway is scored by comparing a drug screen of our E. coli construct vs. wild-type. Any drug candidates that have activity against both the wild-type E. coli and our construct are non-specific inhibitors of E. coli growth. However, any drug candidates that inhibit only the growth of our E. coli construct will be SirA pathway specific.
Flux Balance Analysis of Sulfite Reduction Pathway
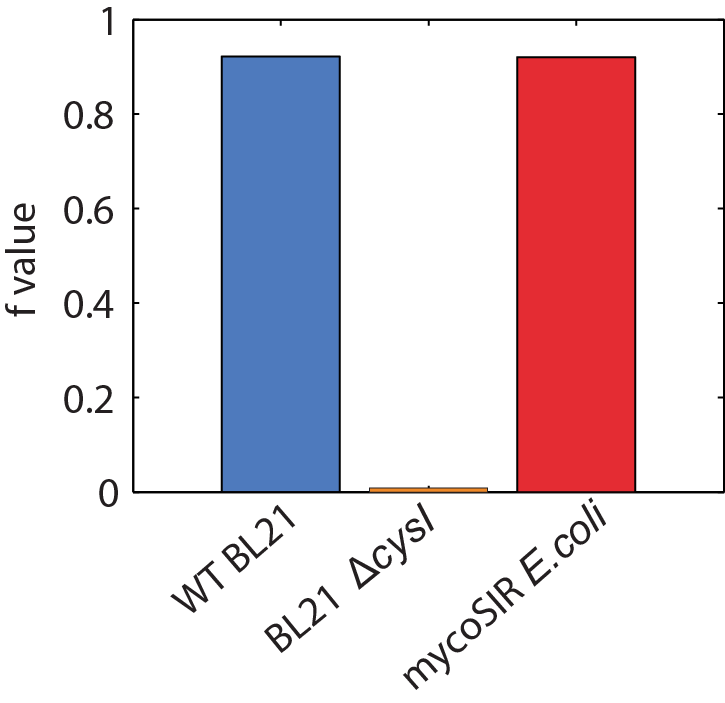
We used an E. coli model (iJR904) obtained from the BiGG database as a starting model to obtain wild-type growth rate (f = 0.9129 divisions/hour). We then deleted the reaction ‘SULR’ which encodes for the sulphite reduction pathway involving cysI and obtained a f= -8e-13=0 divisions/hour indicating that the sulphite reduction pathway is essential for growth. Finally we introduced two new reactions for sirA and fprA and a new species fdxA. We found that growth with the mycobacteria pathway reverts the growth phenotype back to wild-type levels (f = 0.9105 divisions/hour). We then wanted to expand our model to find new pathways that we could utilize for a targeted drug screen approach. We wrote a matlab script that finds all the essential reactions in M. tuberculosis and all the essential reactions in E. coli, and then tries to complement the essential reactions in the E. coli model with the essential reactions from M. tuberculosis. The model identified 100 metabolic reactions that we could target. Additionally, due to the modular nature of the model, it can be used to find target-able metabolic reactions in any SBML file. The Matlab scripts can be found here and requires Cobra Toolbox 2.0 to function. Please visit the FBA page for a detailed list of results.

Figure 2: Biomass Flux through E. coli and mycoSIR E. coli
Structural Analysis of SirA
Superimposing the structures of M.tuberculosis SirA and E.coli CysI reveals high homology, in particular of the active sites. Both proteins have the same symmetry (psuedo 2 fold) indicative of a common evolutionary origin. Our analysis highlighted important conserved residues, involved in substrate binding to be Arg97, Arg130, Arg166, Lys207. These positively charged residues are conserved in the sulphite/nitrite reductase family. In addition, 4 Cys residues are conserved for iron-sulphur binding.
The most profound structural differences between the two enzymes are found in the ferredoxin binding site and SirA's most C terminal residues and several surface loop regions due to deletions or insertions. A stark difference is a covalent bond formed between Cys161 (thiolate) and Tyr69 (C carbon atom) found adjacent to the redox center (Cu ions) in SirA. The covalently bound residues act as a secondary cofactor in tyrosyl radical stabilization.

Figure 3: The superimposed 3D protein structures of SirA and CysI.
Identification of potential drug target binding sites
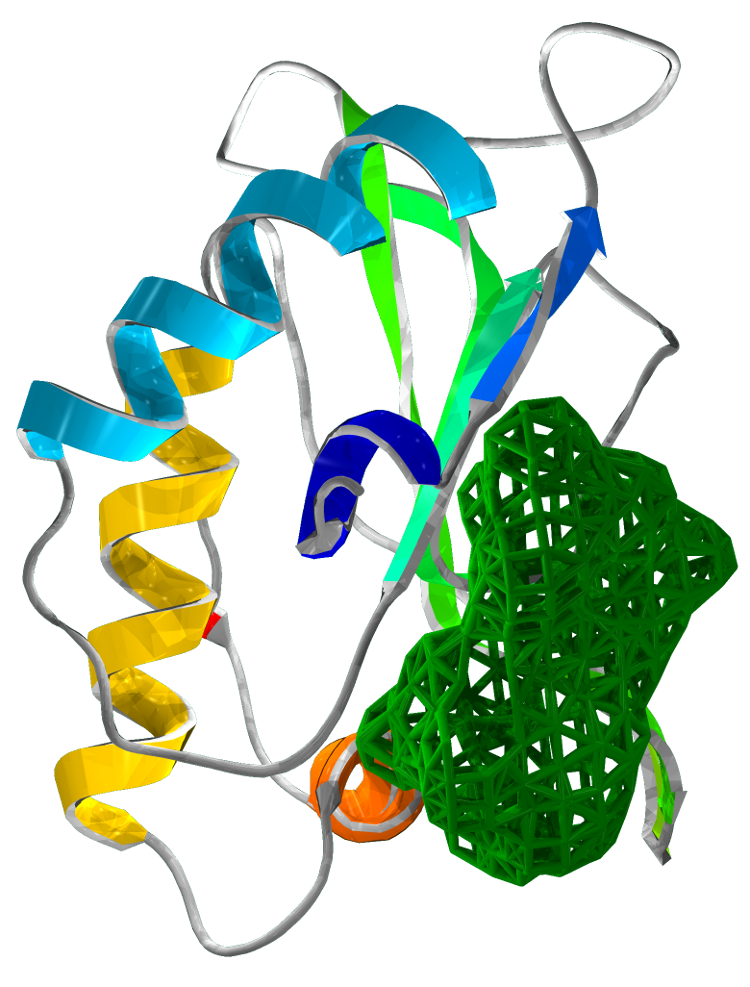
Our structural analysis provided the basis for our drug target prediction. Using Chembl and swiss pdb, we have shown a predicted drug target site. Our calculation gives strong favour for a drug to be effective at this site. The calculation reflects the suitability of small molecules to the binding site under the Lipinski's Rule of 5.
The drug target is located at the interface of the three domains. This binding pocket exhibits a dense hydrophobic region. Our analysis targets 48 amino acids of SirA within 6Å of a modelled small drug molecule. Of these residues, only 6 amino acids are charged: His409, Asp453, Asp474, His500, Asp504 and Arg541.

Figure 4 Drug target locations in SirA
Structure based pharmacophore modelling of mycobacterial Fpra
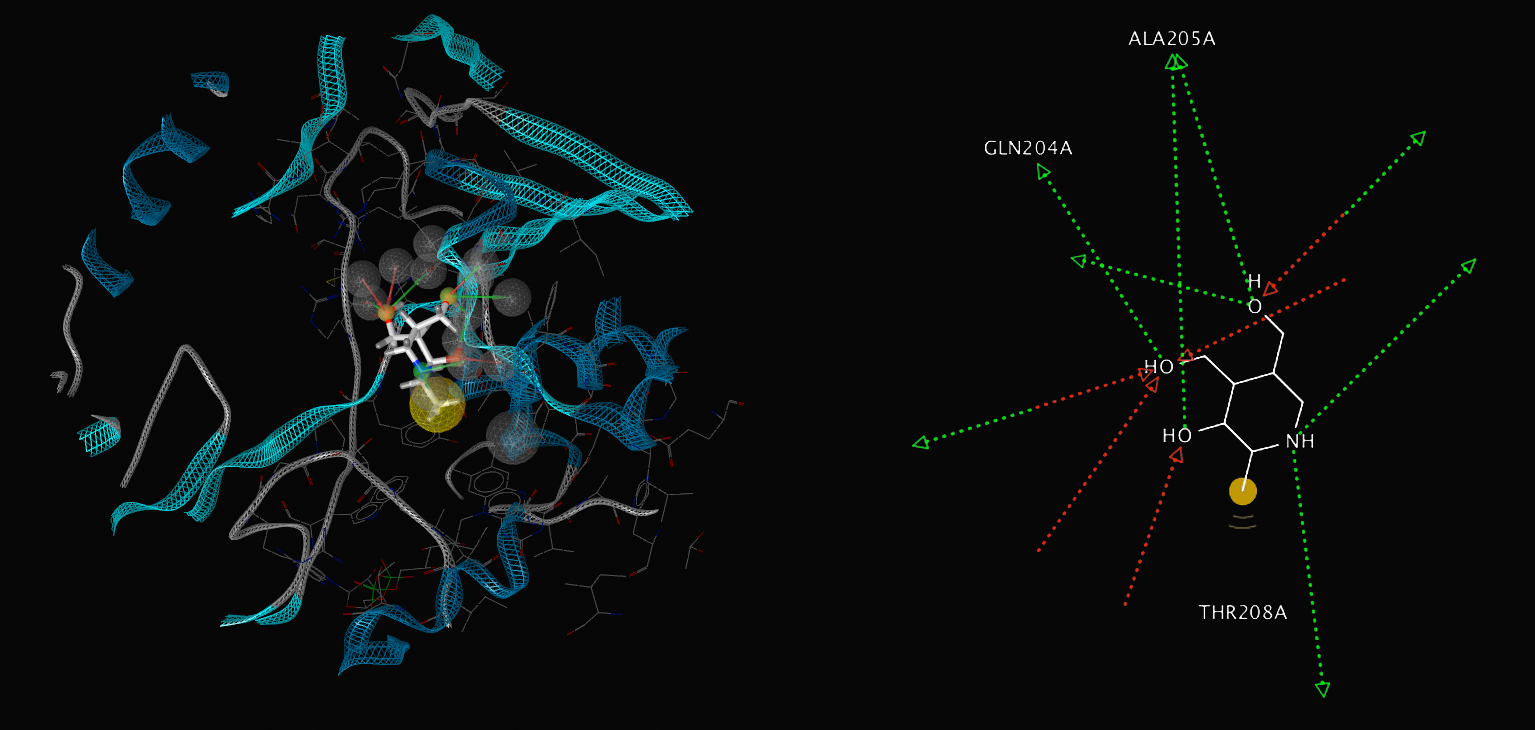
Using LigandScount 3.1, we searched over 8100 drug compounds from the BindingDB and Chembl databases for drugs targetting mycobacterial Fpra. Our search revealed Riboflavin (Vitamin B2) and Pyridoxine to be drug targets for Fpra. We used NADP interacting with the active site as the model of the pharmacore. Results showed pyridoxin to be a competitive inhibitor to NADP. Pyridoxin is a synthetic compound currently available as a prescribed drug.
Chembl analysis of Pyridoxine (vitamin B6) show that it's properties fulfill Lipinski's criteria of being an orally active drug in humans. These properties state that any small drug molecule must have: no more than 5 H bond donors, no more 10 H bond acceptors (N or O atoms), mol mass of less than 500 dalts and octanol-water partition coefficient log P of no greater than 5).
We have shown the proposed properties of Pyridoxine's interaction with Fpra as a competitive inhibitor to NADP at Fpra's active site. The key amino acids at the active site are Ala205, GLN204 and Thr208. GLN204 and Ala205 act as hydrogen bond acceptors whilst Thr208 interacts with a H via van der waals forces. Pyridoxin is a smaller, more lipid soluble molecule than NADP, thus more fitting to Lipinski's criteria.

Figure 5:

Figure 6:
Synthetic Mycobacteria Pathway
We designed a synthetic M.smegmatis- derived sulfite reduction pathway containing sirA - the sulfite reductase, and two supporting genes that are required for its function in E.coli: fdxA and fprA. FdxA is a mycobacterial Ferredoxin cofactor which is oxidised by SirA during the sulfite reduction reaction and FprA is a Ferredoxin-NADPH reductase use replenish the reduced Fdx pool. The genes' sequences were taken from previous work describing their expression (Pinto et al 2007) in E.coli for purification and in vitro characterization; we removed restriction sites and codon optimized for expression in E. coli. The genes were then cloned into two Duet expression vectors, one containing sirA and one containing the supporting genesand were transformed into our knock-out mutant strains of E. coli. Data on Growth curves can be found here.

Figure 7: Growth curves of E. coli mycoSIR
Creation of Knock out Mutants
We prepared two strains of E. coli which have the sulfite reduction pathway deleted: BL21 (DE3) ΔCysI Δfpr ΔydbK and BL21 (AI) ΔCysI. CysI is responsible for sulfite reduction in E. coli, while fpr and ydbK are two non-essential genes that consume ferredoxin. These two genes are deleted, as sulfite reduction in mycobacteria is ferredoxin dependent in comparison to E. coli in which it is NADPH dependant. These genes were also removed to ensure that they do not interfere with our system.
Synthetic Corn Pathway
Additionally we prototyped the system with a reconstruction of a sulphite reduction pathway previously designed and published by the silver group (2011 Barstow et al). In place of CysI, a corn (Zea mays) derived sulfite reductase (zmSIR) was used. Two additional genes were included: Spinach ferredoxin (soFD), and corn derived ferredoxin NADP+ reductase (zmFNR). These genes, respectively, are required for production of the ferredoxin cofactor and the NADP+ ferredoxin reductase and are required for sulfite reductase (zmSIR) to function within E. coli.

Figure 8: Growth curves of E. coli maizeSIR
Results
Upon successful cloning of the three genes into our E. coli deletion strain, we continued to confirm that all three genes are required for growth on minimal media. Our two synthetic pathways were found to rescue growth on a sulfurless amino acid supplemented minimal media. We hope that this technique of using synthetic biology to overcome problems faced in naturally occurring systems will be both a large boon to the pursuit of finding novel drug candidates in M. tuberculosis and more broadly as this technique can be used for high-throughput screening of any pathway that can be constructed to be essential for growth in E. coli.
Figure 9: Growth of zmSIR E. coli on minimal media.
Z-score
The Z-score is a statistical measurement aimed at assessing the "hit effect" in a drug screen high throughput screening. It is a commonly used measurement that shows how well did the drug effect the growth of the assay strain and how significant is the decrease in growth.
To calculate the Z-score we used our experimental E. coli strain BL21 (AI) ΔcysI that carries all three genes of the synthetic pathway (sirA, fprA, fdxA). We grew it in the M9 minimal media supplemented with amino acid sulfur dropout powder, in a 96 well plate. Four of the wells were "spiked" with antibiotics (Amp, Gent, Kan, and Spect).
This served as a simulation of the drug screen without the actual drug library. Only the drug screen controls are used: growth in M9 as a negative control (no drugs) and growth in M9 + antibiotics as a positive control (a sure hit). We then compared the distribution of the growth (OD) in the negative control with the distribution of growth (OD) in the positive control. The Z-score shows the distance of the negative control mean from the positive control mean in negative control standard deviation units.
Our Z-score is: -10.2.
Z-factor
Z-factor is a measurement complementary to the Z-score. It measures the assay's quality based on the same data extracted from the same experiment made for the Z-score. This calculation gives an estimation of how far the negative controls are from the positive controls. It is a comparison of the two distributions which assumes that both distributions are normal and calculate how far 99% of the data points of each distribution are from each other.
Z-factor is given on a scale from 0 to 1. Scores between 0.5 and 1 show that the assay is good and will enable testing in High throughput screens.
Our Z-factor score is 0.58.
MycoSir growth assays reveal the potential anti TB activity of Pyridoxine

Figure 10: MycoSIR E. coli growth assays reveal a potential anti-TB acitivity of pyridoxine at high doses.
Literature
- Global Alliance for TB Drug Development, Tuberculosis. Scientific blueprint for tuberculosis drug development, Tuberculosis (Edinb) 81 Suppl 1, 1–52 (2001).
- World Health Organization, Global Tuberculosis Report 2012 (2012).
- K. Raman, K. Yeturu, N. Chandra, targetTB: A target identification pipeline for Mycobacterium tuberculosis through an interactome, reactome and genome-scale structural analysis, BMC Syst Biol 2, 109 (2008).
- R. Pinto, J. S. Harrison, T. Hsu, W. R. Jacobs, T. S. Leyh, Sulfite Reduction in Mycobacteria, Journal of Bacteriology 189, 6714–6722 (2007).
- B. Barstow C. M. Agapakis, P. M. Boyle, G. Grandl, P. A. Silver, E. H. Wintermute, A synthetic system links FeFe-hydrogenases to essential E. coli sulfur metabolism, J Biol Eng 5, 7 (2011).
- Schellenberger J, Que R, Fleming RMT, Thiele I, Orth JD, Feist AM, Zielinski DC, Bordbar A, Lewis NE, Rahmanian S, Kang J, Hyduke DR, Palsson BØ. 2011 Quantitative prediction of cellular metabolism with constraint-based models: the COBRA Toolbox v2.0. Nature Protocols 6:1290-1307.
- Schellenberger, J., Park, J. O., Conrad, T. C., and Palsson, B. Ø., BiGG: a Biochemical Genetic and Genomic knowledgebase of large scale metabolic reconstructions, BMC Bioinformatics, 11:213, (2010).
- S. G. Franzblau et al., Comprehensive analysis of methods used for the evaluation of compounds against Mycobacterium tuberculosis, Tuberculosis 92, 453–488 (2012).
- D. J. Payne, M. N. Gwynn, D. J. Holmes, D. L. Pompliano, Drugs for bad bugs: confronting the challenges of antibacterial discovery, Nat Rev Drug Discov 6, 29–40 (2006).
- M. Nakayama, T. Akashi, T. Hase, Plant sulfite reductase: molecular structure, catalytic function and interaction with ferredoxin, J. Inorg. Biochem. 82, 27–32 (2000).
Attributions
- Strains NEBTurbo, BL21 (DE3) KO20, BL21 AI were provided by INSERM U1001.
- Plasmids pET Duet, pACYC Duet, pACYC zmSIR, pACYC soFD zmSIR, pCDF FNR were provided by INSERM U1001.
- Genes msSirA, msFprA, msFdxA were synthesized by IDT.
- Project was designed by Idonnya Aghoghogbe, Yonatan Zegman, Matthew Deyell and Edwin Wintermute. All experiments and modelling were performed by Idonnya Aghoghogbe, Yonatan Zegman, Matthew Deyell.
 "
"


 +33 1 44 41 25 22/25


