Team:HIT-Harbin/Experiments
From 2013.igem.org
| Line 83: | Line 83: | ||
<p></p>4)We sent our whole device to companies for sequencing, but it failed. | <p></p>4)We sent our whole device to companies for sequencing, but it failed. | ||
<img src="https://static.igem.org/mediawiki/2013/7/71/HIT-Harbin_team.png"/> | <img src="https://static.igem.org/mediawiki/2013/7/71/HIT-Harbin_team.png"/> | ||
| - | <p>Fig: the happy moment when we saw the culture becoming red</p> | + | <p>Fig: the happy moment when we saw the culture becoming red for the first time</p> |
</div> | </div> | ||
Latest revision as of 14:26, 27 September 2013
Project/experiments
Experiment Schedule
JuL. 10~15 Preparation of media, competent cells and experimental reagents JuL. 16~20 Preparation of parts from iGEM JuL. 21~31 Respective ligation of strong, intermediate and weak RBS with sub-circuit hrpR/hrpS/tet/RFP Aug. 1~10 Ligation of terminators Aug. 11~20 Successful ligation of the four sub-circuits Aug. 21~28 Combination of sub-circuits: the device Aug. 29~Sep. 15 Test of the device Sep. 16~25 Remaining experiments
Fig: Agarose electrophoresis for our parts and maker forming "HIT"
Part A :Plasmid carrying Plac+RBS+hrpR+T
Part B :Plasmid carrying Ptet+RBS+hrpS+T
Part C :Plasmid carrying PhrpL+RBS+RFP+T
Ligation for our device

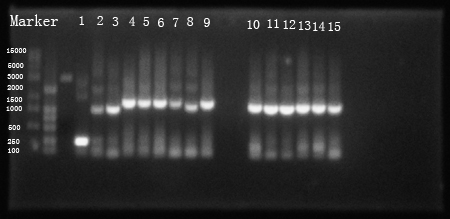
Fig 1. PCR resuLts of our own parts
(1: hrpL; 2: hrpS; 3: hrpR; 4: Ptet +strong RBS+hrpS+T; 5:Ptet+intermediate RBS+hrpS+T; 6: Ptet+weak RBS+hrpS+T; 7: PIPTG +strong RBS+hrpR+T; 8 is not needed; 9: PIPTG +weak RBS+hrpR+T; 10: PhrpL+strong RBS+tetR+T; 11: PhrpL+intermediate RBS+tetR+T; 12: PhrpL+weak RBS+tetR+T; 13: PhrpL+strong RBS+RFP+T; 14: PhrpL+weak RBS+RFP+T; 15: PhrpL+weak RBS+RFP+T)

Fig 1.EcoR1 and Pst1 double restriction enzyme cleavage for hrpL AND gate(BBa_K1014014) device and B-POM1(BBa_K1014999)
1:plasmid carrying BBa_K1014014; 2:double restriction enzyme cleavage for 1; 3:plasmid carrying BBa_K1014999; 4:double restriction enzyme cleavage for 3
1.Test of device
1)Preparation of IPTG solution: add 240mg IPTG powder into 10mL dd H2O. We filtrated the solution to sterilize it and broke it into EP tubes. The concentration is 24mg/mL (100mM/mL). then we stored them in -20℃. 2)To test the four different combination according to the strength of promoters, we made different concentrations of IPTG for the bacteria.Table 1 IPTG formula


Fig 3. No red after night
 Fig 4. Constitutive promoter expressing RFP
(Left is 12h, right is 24h)

Fig: the happy moment when we saw the culture becoming red for the first time
2.Investigating the relationship between the concentration of RFP with that of IPTG
1)Measuring absorbance of RFP We grew bacteria without device and bacteria with our device in same volume until stationary phase. Taking bacteria without device as background, we measured the absorbance of bacteria with our device (the max absorption peak is 504nm).But absorbance in 504nm is higher than 1,which present a bad linear relation between absorbance and concentraton. RFP has absorption in 450nm,and absorbance is between 0.1 and 1(better linear relation).Occasionally, we find a RFP standard curve under 450nm on the web. it was very lucky compared with our failure in testing our device. Before the mensuration, we diluted the two groups according to table2. We took the mean of two measures as the useful data.
Fig.5 RFP absorbance varying with wave length
Table 2 Dilution of Two groups of bacteria


Fig 6. The relationship between RFP concentration and absorbance(OD450)

Fig 7. RFP standard curve obtain from the web,Click here
 "
"
