Team:Edinburgh/Project/Results/Metal binding Results
From 2013.igem.org
| Line 58: | Line 58: | ||
<h3>Functional analysis of FbpA</h3> | <h3>Functional analysis of FbpA</h3> | ||
| + | |||
| + | FbpA was expressed using Plac promoter. Overexpression of FbpA in high iron concentration (Figure 4) gave twofold results: | ||
| + | |||
| + | -Overexpression of FbpA increases tolerance of ''E. coli'' to iron. As it can be observed on Figure 4 the cells producing the protein can grow closer to the iron source than those that do not (JM109). | ||
| + | |||
| + | -Upon closer inspection one can observe that cells overexpressing FbpA have slight red pigmentation. This could indicate that cells accumulate iron. | ||
| + | |||
[[File:fbpa_functionality.jpg|600px]] | [[File:fbpa_functionality.jpg|600px]] | ||
| + | |||
| + | '''Figure 4.''' Ferric citrate was placed on the middle of the right plate. Control cells plated on no additional iron conditions (left), cells overexpressing FbpA (plate parts lebelled FbpA1, FbpA2 and FbpA22) in high iron conditions (right). Control cells without FbpA are labelled JM109. | ||
</div> | </div> | ||
{{Team:Edinburgh/Footer}} | {{Team:Edinburgh/Footer}} | ||
Revision as of 23:00, 4 October 2013
Contents |
Cloning FbpA as a BioBrick
The coding sequence alone of the Neisserial FbpA protein was cloned from a plasmid obtained from within the University of Edinburgh. Two forms of the protein were cloned: the full length native coding sequence FbpA1 BBa_K1122702 and the coding sequence less the putative signal peptide FbpA2 BBa_K1122703. In both cases primers were designed such that each sequence was terminated by two consecutive stop codons, and flanked with biobrick enzyme cut sites for insertion into pSB1C3.
Primers
F1: cgcttctagatgaaaacatctatccgatacg
F2: cgcttctagatggacattaccgtgtacaacgg
R1: atcctgcagcggccgctactagtattattatttcataccggcttgctc
Native coding sequence used as PCR template indicating primer binding sites:
atgaaaacatctatccgatacgcactgcttgccgcagccctgaccgccgccacccccgcg ctggcagacattaccgtgtacaacggccaacacaaagaagcggcacaagccgttgcagat gcctttacccgggctaccggcatcaaagtcaaactcaacagtgccaaaggcgaccagctt gccggccaaatcaaagaagaaggcagccgaagccccgccgacgtattctattccgaacaa atcccggcactcgccaccctttccgcagccaacctcctagagcccctgcccgcctccacc atcaacgaaacacgcggcaaaggcgtgccggttgccgccaaaaaagactgggtggcactg agcggacgttcgcgcgtcgtcgtttacgacacccgcaaactgtctgaaaaagatttggaa aaatccgtcctgaattacgccacgccgaaatggaaaaaccgcatcggttacgtccccact tccggcgcgttcttggaacagattgtcgccatcgtcaaactgaaaggcgaagcggccgca ttgaaatggctcaaaggcctgaaagaatacggcaagccttacgctaaaaactccgtcgcc cttcaagcggttgaaaacggcgaaatcgatgccgccctcatcaacaactactactggcac gctttcgcgcgtgaaaaaggcgtacaaaatgtccacacccgcctgaatttcgtccgccac agagatcccggcgcactcgttacctattccggcgcagccgtgttaaaatcctcccaaaac aaggatgaggcgaaaaaattcgtcgccttcctcgccggcaaggaaggacagcgcgccctg accgccgtccgtgccgaatatcctttgaatccgcacgtggtatccaccttcaatttggaa cccatcgccaagttggaagcaccccaagtgtccgccaccactgtttccgaaaaagaacac gccacccggctgcttgagcaagccggtatgaaataa
Cloning
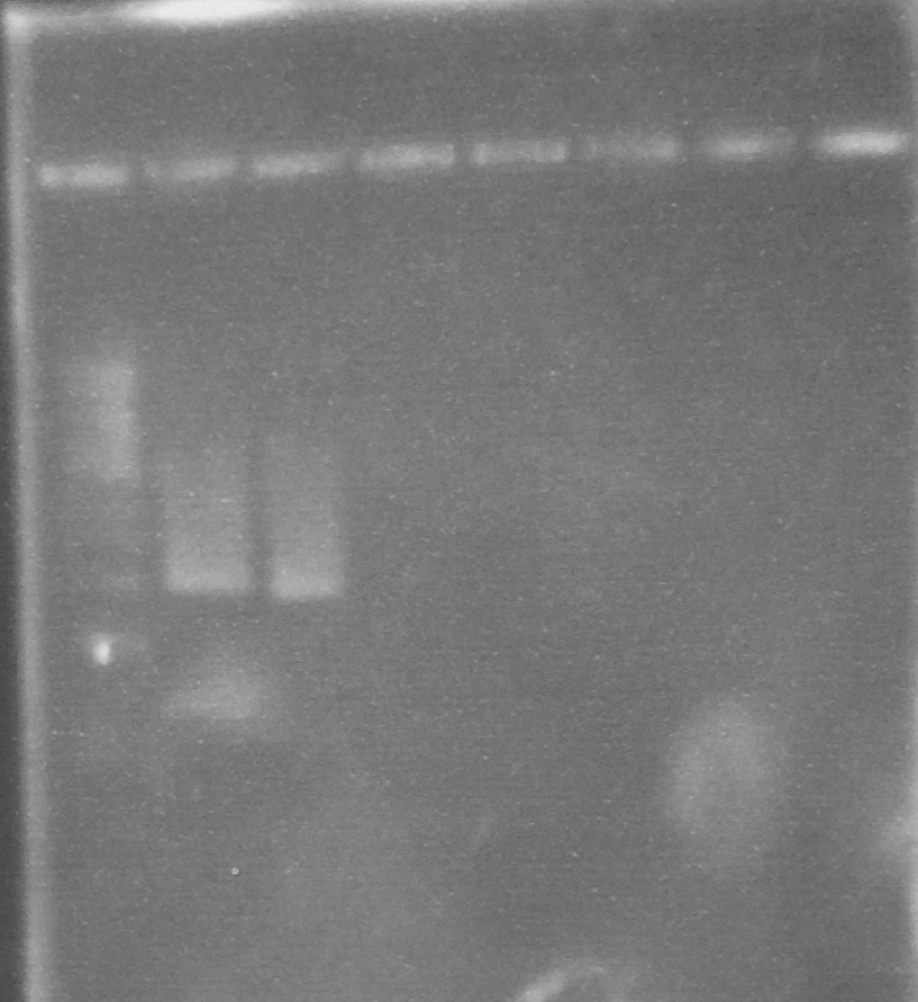
Expected PCR fragment sizes: FbpA1, Full length coding sequence 1032bp; FbpA2 Coding sequence less putative signal peptide 969bp. See figure 1.
Figure 1. A 0.8% agarose gel: 1Kb ladder*; FbpA1 native sequence PCR product (plus minor product); FbpA2 less signal peptide PCR product.
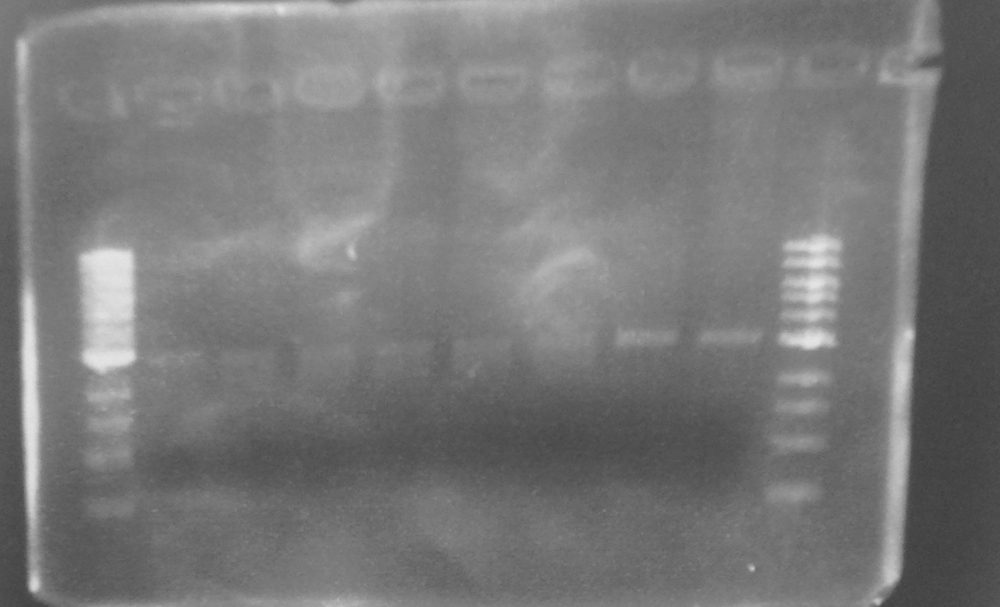
The two PCR products were double digested with Xba1 and Pst1, and ligated into pSB1C3 digested with the same enzymes. The ligation mixture was transformed into E. coli JM109, and plasmid DNA minipreps were done on transformant colonies. Aliquots of these minipreps were linearised by digested EcoR1 and run on a 0.8% agarose gel. See figure 2. One miniprep of each coding sequence was then double digested with EcoR1 and PstI, in order to confirm a size difference between the two biobricks of the two coding sequence. See figure 3. In each of the gels the size represented by the bands was as expected.
Figure 2. EcoR1 single digests of minipreps on a 0.8% agarose gel: 1Kb ladder*; FbpA1 colony 1; FbpA1 colony 2; FbpA1 colony 3; FbpA2 colony 1; FbpA colony 2; --; --; 1Kb ladder*.
Figure 3. EcoR1 PstI double digest of minipreps on a 0.8% agarose gel: 1Kb ladder*; FbpA1 colony 1; FbpA2 colony 2. Plasmid DNA of each sequence (FbpA1 colony 1 BBa_K1122702 and FbpA2 colony 2 BBa_K1122703) was sent for sequencing and submitted to the parts registry.
* 1Kb ladder from New England Biolabs. DNA band sizes: 0.5, 1, 1.5, 2, 3, 4, 5, 6, 8, 10Kb.
Functional analysis of FbpA
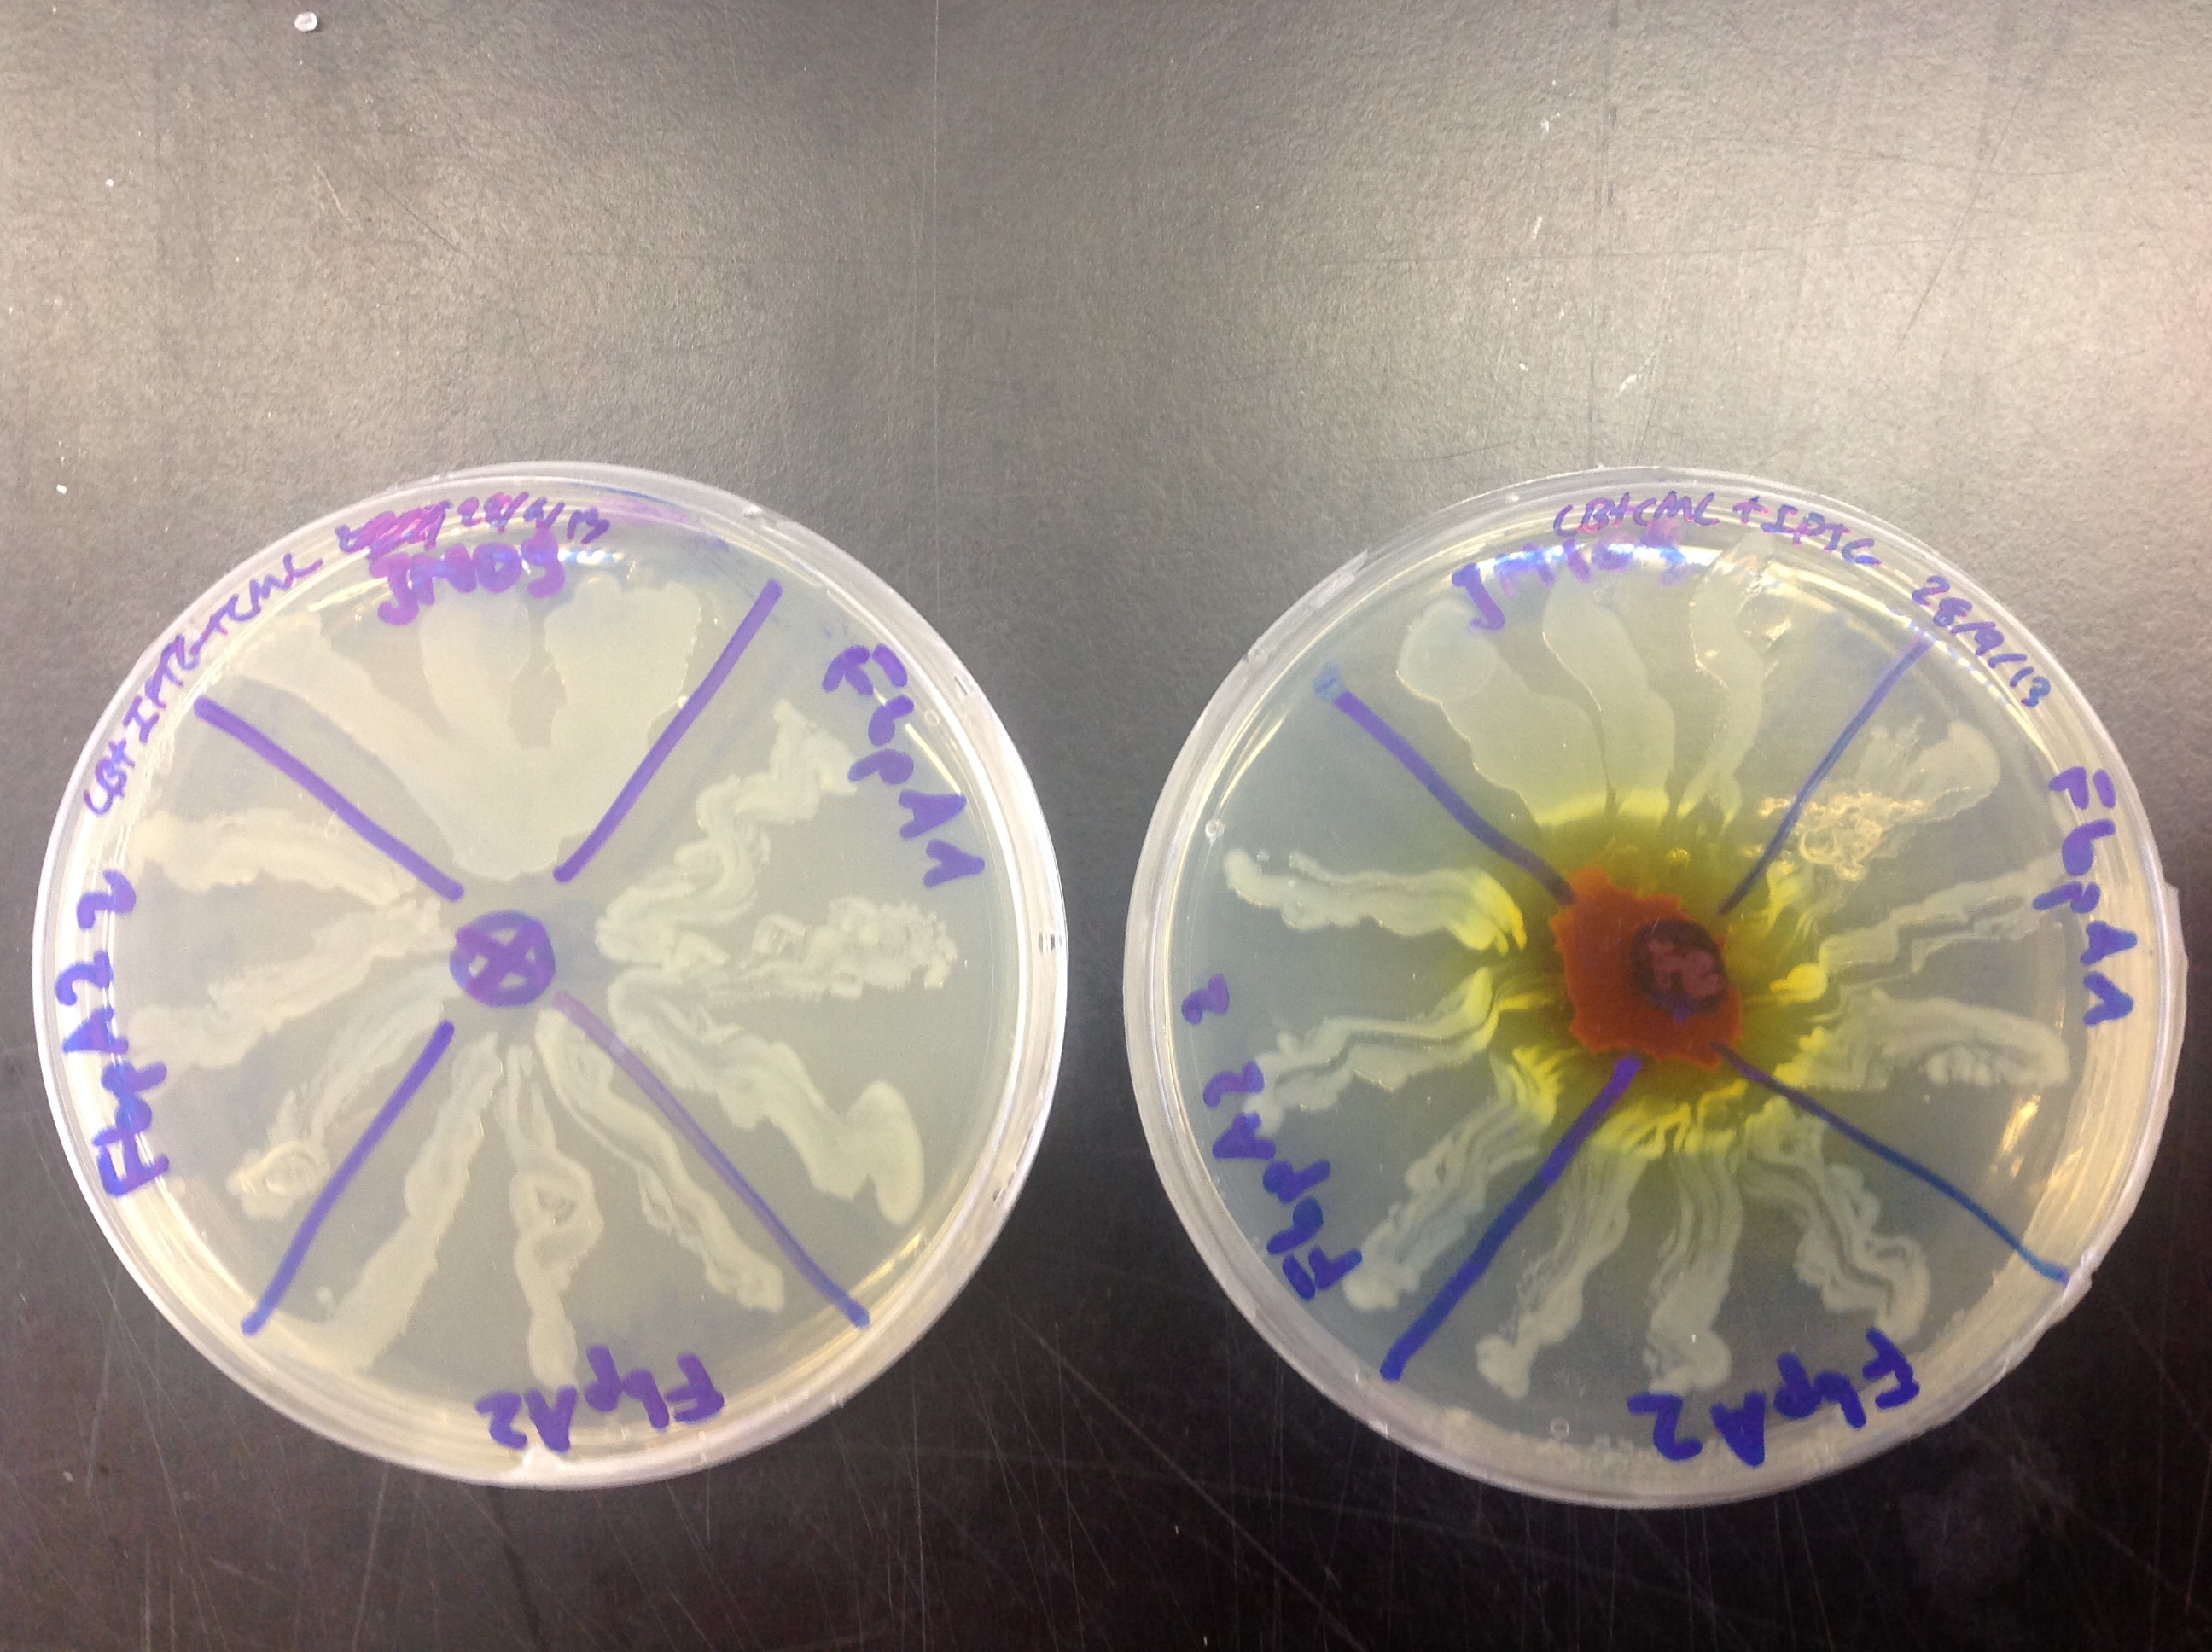
FbpA was expressed using Plac promoter. Overexpression of FbpA in high iron concentration (Figure 4) gave twofold results:
-Overexpression of FbpA increases tolerance of E. coli to iron. As it can be observed on Figure 4 the cells producing the protein can grow closer to the iron source than those that do not (JM109).
-Upon closer inspection one can observe that cells overexpressing FbpA have slight red pigmentation. This could indicate that cells accumulate iron.
Figure 4. Ferric citrate was placed on the middle of the right plate. Control cells plated on no additional iron conditions (left), cells overexpressing FbpA (plate parts lebelled FbpA1, FbpA2 and FbpA22) in high iron conditions (right). Control cells without FbpA are labelled JM109.

| 
| | | | 
|
| This iGEM team has been funded by the MSD Scottish Life Sciences Fund. The opinions expressed by this iGEM team are those of the team members and do not necessarily represent those of MSD | |||||
 "
"


