From 2013.igem.org
MAGE Targets
- The first step in applying MAGE is finding MAGE targets. This involved reading numerous scientific papers to learn as much as possible about the heterologous enzymes, and the pathway that was being used to create the PLA
Enzyme Targets
- Sadly there was no crystal structure of either enzyme we could use to locate the sites to introduce mutations
- However, we used the literature available to locate spots where we would want to introduce mutations
Propionate CoA-transferase
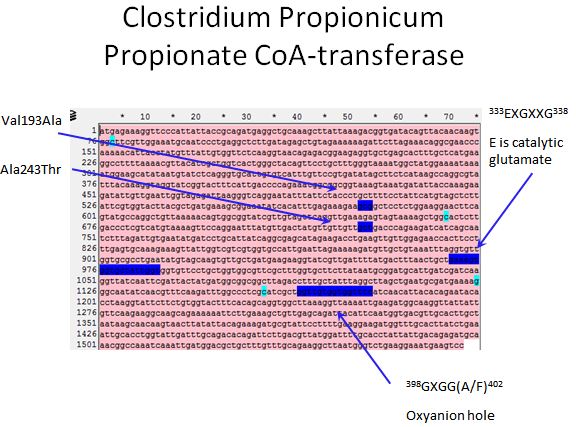
- According to Selmer et al. 2002, there is a catalytic glutamate found in all CoA-transferases
- Using alignment tools along with the crystal structure of YdiF CoA transferase (That shares 45% sequence identity with the Propionate CoA-transferase) we were able to locate the catalytic glutamate in our enzyme
- Also, we were able to locate the oxyanion hole of the enzyme
- We also targeted the regions mentioned in the Lee papers
| 
|
P. resinovorans PHA synthases
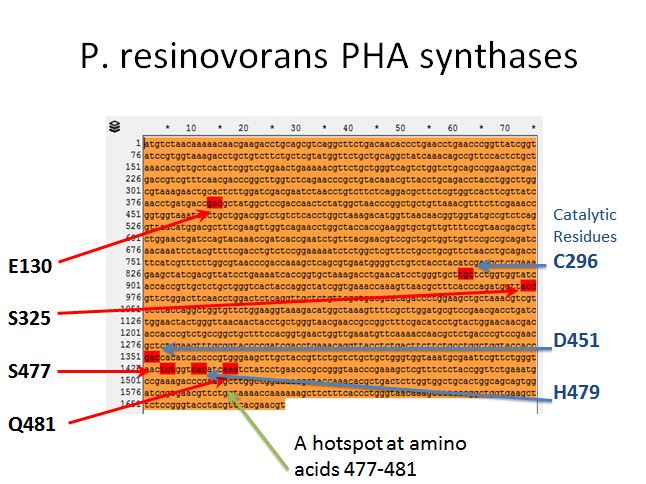
- From Yang et al. 2011 we knew there were 4 targets for mutation that affected the efficiency of this enzyme (E130, S325, S477, and Q481)
- After some more reading we found three amino acids that were putative catalytic residues (C296, D451, and H479)
- This gave the impression of one hotspot area (amino acids 477-481) so an oligo was designed to target the enzymes in between (AA478 and AA480)
| 
|
Pathway Engineering
- We wanted to divert resources toward our desired pathway
- This mainly consisted of increasing the production of lactate
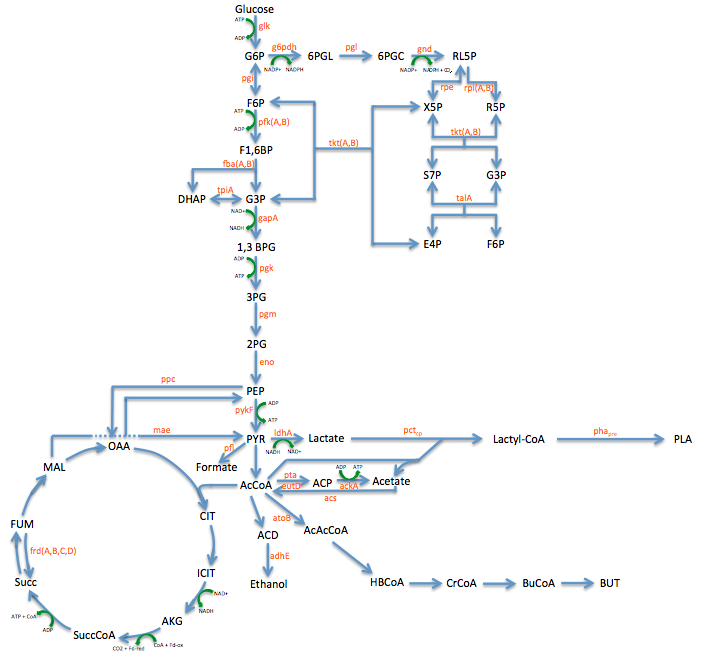
- In order to better understand the pathway we were tampering with we created this metabolic engineering graphic (using the sources listed at the bottom of this page)
Enzyme KOs
- This led us to find 8 targets for Knockouts (enzymes which would divert resources from our desired pathway)
- These include adhE, ackA, pfl(A,B), frd(A,B,C,D, ppc, atoB, pta, eutD
- Oligos were designed to introduce two nonsence mutation near the begining of these ezymes, so they would not be expressed
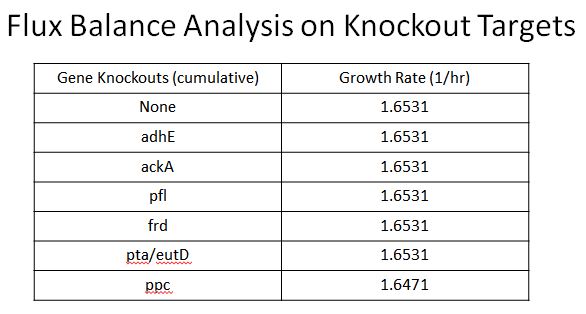
- Using Flux Balance Anylysis (Instructions here) we were able to determine that none of these enzymes would cause a fitness hit except ppc
| 
|
RBS Tuning
- Using the pathway diagram shown above we found 20 enzymes that could be potential targets for mutation
- Using the same approach taken in MAGE paper (Wang et al. 2009), we designed oligos that target the RBS of each enzyme, and made the oligos degenerate with the following sequence DDRRRRRDDDD (-4 through -14 positions from the start codon)
- This would alter the RBS to adjust transcription and thus allow some cells to have higher expression and some cells have lower expression
- Using FACS we would be able to sort through the cells and determine which cells have the highest PLA production
- The figure shows how to design a oligo depending on which strand and which replichore the gene is located.
- Here is a link to the 20 Enzymes targeted for RBS tuning
- Here is a link to the sequences of the 28 Oligos for RBS tuning
| 
|
Results
- The first time we used FACS to sort the cells, we saw roughly a two fold increase in fluorescence when we tested on the plate reader
- This was sorting after a single MAGE cycle with the KO olgios

- We used this FACS sorted strain and ran 5 more MAGE cycles (one with RBS oligos, one with KO, and one with all Oligos)
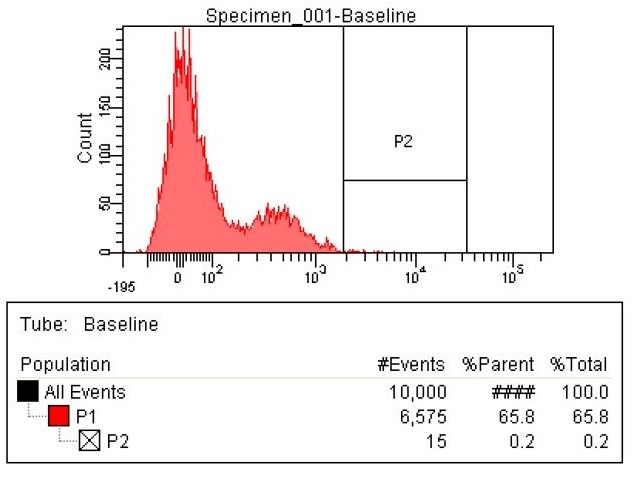
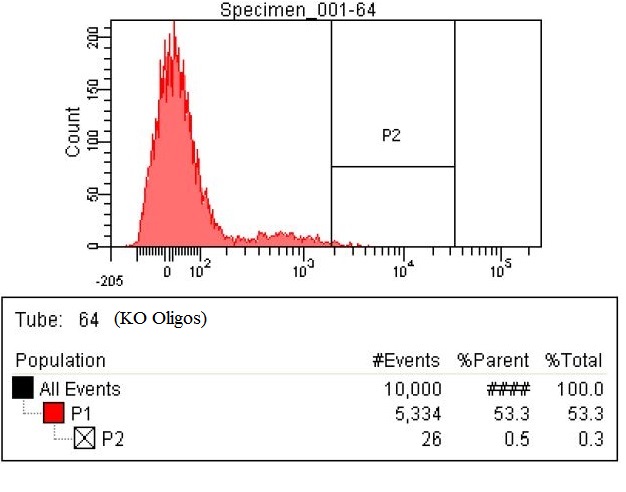
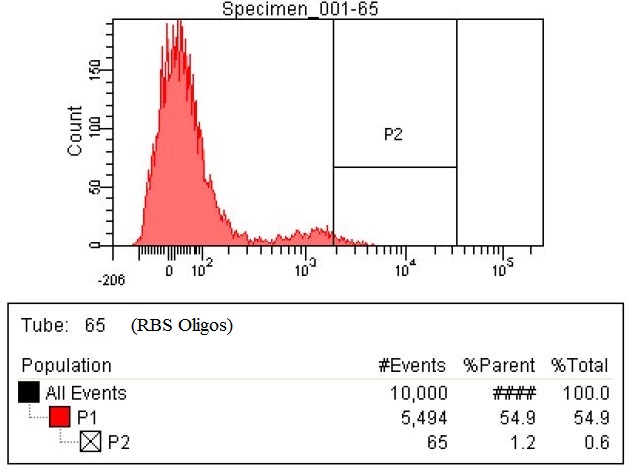
- Here are the results of the FACS sorting of these strains
| This first sample is the baseline. This is EcNR2 with our plasmid containing both the PCT and PHA gene. The strain was grown overnight with the cells induced and in the presence of Nile red to strain the PLA. The gate (labeled P2) was chosen to select those with the highest levels of fluorescence. Due to the abnormally high levels of fluorescence in some cells in the baseline, the gate was chosen to include some baseline cells but only those with very high levels of fluorescence.
| 
|
| This second sample is the KO oligos. This means it has 11 Oligos to knock out 11 enzymes. The enzymes targeted for Knockout were ackA, frdB, frdD pflA, pflB, adhE, frdA, frdC, ATOB, PTA, EUTD. There are now 26 cells within the gate compared to the 15 in the baseline. That means number of cells with high levels of fluorescence nearly doubled.
| 
|
| This first sample is the baseline. This is EcNR2 with our plasmid containing both the PCT and PHA gene. The strain was grown overnight with the cells induced and in the presence of Nile red to strain the PLA.
| 
|
List of Papers:
Jacob et al. 1997
Matsuzaki et al. 1998
Sawers et al. 1998
Park et al. 2002
Selmer et al. 2002
Takase et al. 2002
Fong et al. 2005
Matsumoto et al. 2005
Rangarajan ES et al. 2005
Matsumoto et al. 2006
Jung et al. 2009
Matsumoto et al. 2009
Juang et al. 2010
Orth et al. 2010
Yang et al. 2011
Kandasamy et al. 2012
Yang et al. 2013


 "
"


