Team:Newcastle/Parts/HBsu-fp
From 2013.igem.org

Contents |
HBsu-xFP BioBrick
Purpose and Justification
Bacillus subtilis contains HBsu, a non-specific DNA binding protein which is a homologue to eukaryotic histones. This protein is encoded by the gene hbs gene which is 263bp in length and involved not only in DNA binding but also SRP, DNA repair, HR, and pre-secretory protein translocation [http://www.ncbi.nlm.nih.gov/pubmed/10224127 (Kouji, et al., 1999)]. It binds to DNA by forming homodimer.
We conjugated the hbs gene with fluorescent protein genes (rfp/gfp) in order to fluorescently tag the bacterial chromosome. We produced [http://parts.igem.org/Part:BBa_K1185001 BBa_K1185001] which codes for a HBsu-sfGFP conjugate and [http://parts.igem.org/Part:BBa_K1185002 BBa_K1185002] coding for a HBsu-RFP conjugate. Each bacterium was transformed with only one or the other. The expression of these BioBricks was regulated through an IPTG-induced promoter (Pspac).
We fused one bacteria containing HBsu-RFP and another containing HBsu-sfGFP, and viewed the genomic shuffling via fluorescent microscopy. The formation of a colour mosaic allows us to confidently claim that recombination has occurred. Genomic shuffling has importance as it can be used to evolve and improve a cells phenotype.
Design
As part of our genome shuffling sub-project we required one set of bacteria coding for a protein that binded to DNA and fluoresced green and another set which coded for a protein that binded to DNA and fluoresced red. Our HBsu-xFP BioBricks code for [http://www.ncbi.nlm.nih.gov/pubmed/10224127 HBsu: a B. subtilis histone-like protein which binds indiscriminately to DNA]. So that we could observe the distribution of this protein we attached an amino acid linker sequence and a sfGFP/RFP (depending on the BioBrick) coding region to the 3' end of the HBsu coding region. Our first step was to plan our two DNA constructs using gene designer:
Figure 1. The BioBrick [http://parts.igem.org/Part:BBa_K1185001 BBa_K1185001] consists of superfolded green fluorescent protein (sfGFP) ,[http://parts.igem.org/Part:BBa_E0040 BBa_E0040], conjugated to a HBsu protein.
Figure 2. BioBrick [http://parts.igem.org/Part:BBa_K1185002 BBa_K1185002] contains red fluorescent protein(RFP) ,[http://parts.igem.org/Part:BBa_E1010 BBa_E1010], attached to HBsu.
From the 5' end, the Design consisted of a HindIII restriction site, followed by a BioBick prefix sequence, a ribosome binding site(RBS), the HBsu gene, flexible linker sequence, sfGFP/RFP, ~300bp amyE homology region and a SacII restriction site. The HBsu, flexible linker sequence and sfGFP/RFP code for a fluorescently labelled HBsu. The ~300bp amyE homology region allows the single cross over and integration of plasmids into the genome. We did not include a promoter in our BioBrick as the pMutin4 plasmid we used as a vector contained a Pspac promoter 5' to its multiple cloning site. The HindIII and SacII restriction site on the 5' and 3'end of construct were included to allow integration into a pMutin4 multiple cloning site.
Modelling
Construction
The BioBrick [http://parts.igem.org/Part:BBa_K1185001 BBa_K1185001] consists of superfolded green fluorescent protein (sfGFP) ,[http://parts.igem.org/Part:BBa_E0040 BBa_E0040], conjugated to a HBsu protein:

Whereas BioBrick [http://parts.igem.org/Part:BBa_K1185002 BBa_K1185002] contains red fluorescent protein(RFP) ,[http://parts.igem.org/Part:BBa_E1010 BBa_E1010], attached to HBsu:

The constructs were synthesised by DNA synthesis company DNA 2.0. The components within the synthesised sequence were as follows: -
Parts:
- HinIII restriction site - for integration into a pMutin4 multiple cloning site.
- BioBrick prefix.
- Ribosome binding site(RBS) - naturally occuring HBsu RBS
- HBsu gene - binds to the B.subtilis DNA.
- amino acid linker sequence - joins HBsu and xFP.
- sfGFP/RFP - fluorescently marks the protein.
- Stop codon.
- BioBrick suffix.
- ~300bp amyE homology region - allows the single cross over and integration of plasmids into the B.subtilis genome.
- SacII restriction site - for integration into a pMutin4 multiple cloning site.
The synthesised construct was then inserted into the pMutin4 plasmid (Fig.3) to be used in our project. We then cloned out the BioBricks which are flanked by the prefix and suffix from the pMutin 4 plasmid and cloned it into the pSB1C3 plasmid in order to be sent off to the iGEM registry.
Cloning and Integration
pMutin4 - used as a B.subtilis integration vector
 |
 Figure 1. Plasmid map of Pmutin4 without insert |
 Figure 2. Plasmid map of our HBsu-sfGFP |
 Figure 3. Plasmid map of our HBsu-RFP |
Plasmids (pMutin4) containing the HBsu-RFP and HBsu-sfGFP BioBricks were returned from DNA 2.0 were amplified in E.coli. The E. coli competent cell preparation and E. coli transformation protocols were used to transform these plasmids into E. coli cells for cloning. Transformant cells were incubated in order to clone the transformed plasmids. Then the cloned plasmids were extracted and transformed into B. subtilis. Integration of the BioBrick from the vector plasmids to the host chromosomes was facilitated through homologous recombination with crossover events within the amyE homology region. The pMutin4 plasmid contains a ery+ resistance marker for B.subtilis and amp+ for E.coli which we used to select for transformed cells. pMutin4 also contains lacI, lacZ and a Pspac promoter which is an IPTG induced promoter which regulated the transcription of the BioBricks.
Figure 4. This is the final product of the homologous recombination.
pSB1C3 - for submission to the parts registry
In order to submit the HBsu-RFP and HBsu-sfGFP BioBricks to the iGEM repository they needed to be cloned out of pMutin4 and into psB1C3 plasmids. We cut our BioBricks and the linearised psB1C3 plasmid from iGEM using EcoRI and PstI. We then purified the two BioBricks using the gel extraction protocol.
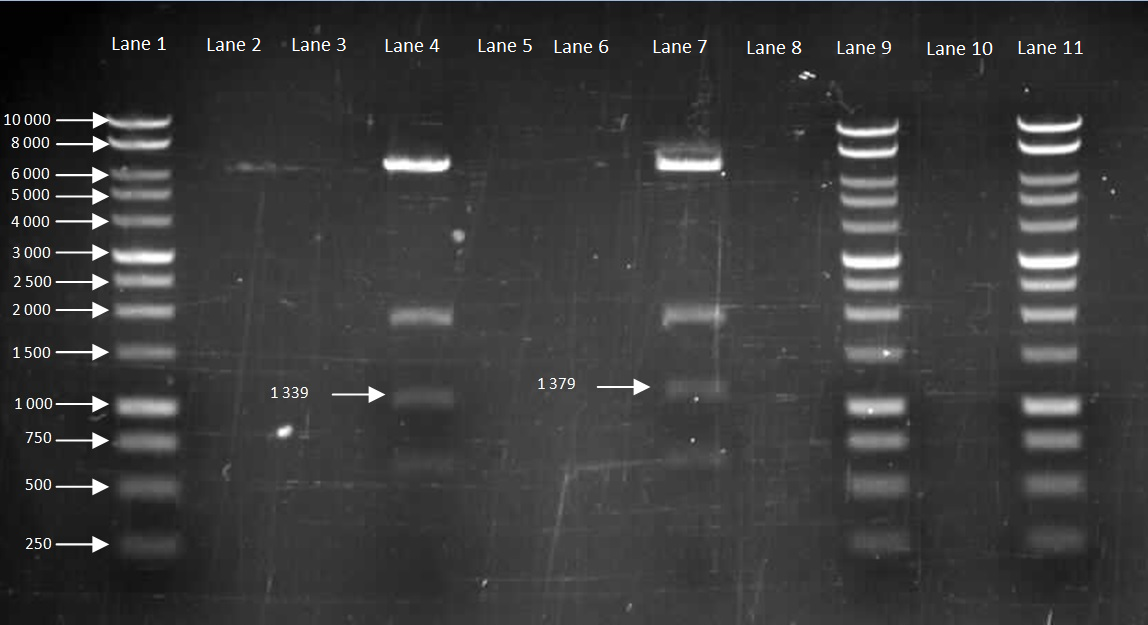
Figure 5. Gel to confirm size of HBsu-GFP and HBsu-RFP in pMutin4. Lane 1: 10kB DNA Ladder, Lane 2-3: Empty, Lane 4: HBsu-RFP, Lane 5-6: Empty, Lane 7: Hbsu-GFP, Lane 8:Empty, Lane 9: 10kB DNA Ladder, Lane 10: Empty and Lane 11: 10kB DNA Ladder. HBsu-RFP is labelled as '1339' bp in length and HBsu-sfGFP is labelled as '1379' bp in length.
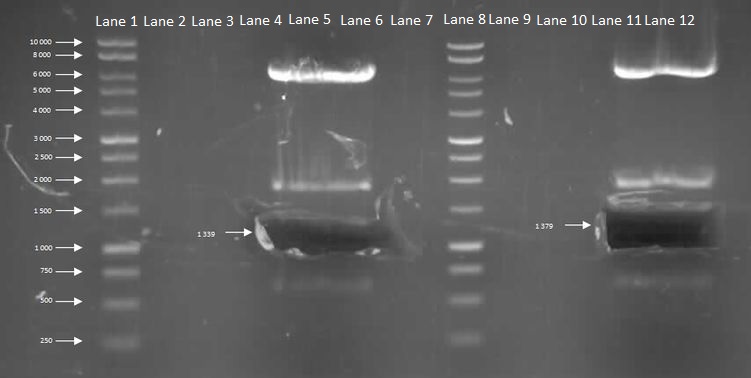 Figure 6. After we have confirmed the size, we ran a restriction digest and cut out the fragment of interest of HBsu-RFP and HBsu-sfGFP using the transilluminator and performed the gel extraction protocol. Lane 1: 10kB DNA Ladder, Lane 2-4: Empty, Lane 5: HBsu-RFP, Lane 6-7: Empty, Lane 8: 10kB DNA Ladder, Lane 9-11:Empty and Lane 12: Hbsu-GFP.
After we seperated our BioBricks we checked the nanodrop reading to find out the concentration of DNA which turned out to be for 20ng/ul HBsu-RFP and 17 ng/ul for HBsu-GFP). We were then able to ligate the BioBricks into the EcoR1 and Pst1 cut pSB1C3 backbone using T4 ligase. We transformed the pSB1C3 into E.coli XL1-B and innoculated the following plates:
 Plate 1: XL1B + 1:1 HBsu-GFP pSB1C3 on LB + Cm (5ug/ml) |
 Plate 2: XL1B + 1:3 HBsu-GFP pSB1C3 on LB + Cm (5ug/ml) |
 Plate 3: XL1B + 1:5 HBsu-GFP pSB1C3 on LB + Cm (5ug/ml) |
 Plate 4: XL1B + 1:1 HBsu-RFP pSB1C3 on LB + Cm (5ug/ml) |
 Plate 5: XL1B + 1:3 HBsu-RFP pSB1C3 on LB + Cm (5ug/ml) |
 Plate 6: XL1B + 1:5 HBsu-RFP pSB1C3 on LB + Cm (5ug/ml) |
 Plate 7: XL1B + No insert pSB1C3 on LB + Cm (5ug/ml) |
Plates 1 to 6 had colonies showing our cloning and transformation had worked. Plate 7 had no colonies as it was a negative control. |
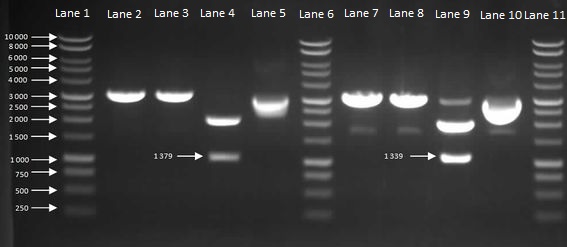
We then inoculated one colony from each sample in to LB and let it grow overnight in order to harvest the plasmids. With the amplified plasmids we could then check that it is the correct size and confirm that cloning had worked (Figure 7). The HBsu-GFP and HBsu-RFP insert was confirmed to be the correct size of 1379bp and 1339bp respectively.
Figure 7: Gel to Confirm Size of HBsu-GFP and HBsu-RFP insert size. Lane 1: 1kB Ladder, Lane 2: HBsu-GFP + PstI, Lane 3: Hbsu-GFP + EcoRI, Lane 4: HBsu-GFP + PstI and EcoRI, Lane 5: uncut product HBsu-sfGFP, Lane 6: 1kB Ladder, Lane 7: HBsu-RFP + Pst1, Lane 8: HBsu-RFP + EcoRI, Lane 9: HBsu-RFP + EcoRI and Pst1, Lane 10: uncut HBsu-RFP and Lane 11: 1kB Ladder.
As Figure 7 shows, the cloning had worked so we were able to send off our HBsu-sfGFP ([http://parts.igem.org/Part:BBa_K1185001 BBa_K1185001]) and HBsu-RFP ([http://parts.igem.org/Part:BBa_K1185002 BBa_K1185002]) BioBricks to the parts registry in the Massachusetts Institute of Technology.
 Figure 8. Plasmid map of BBa_K1185001 in pSB1C3.
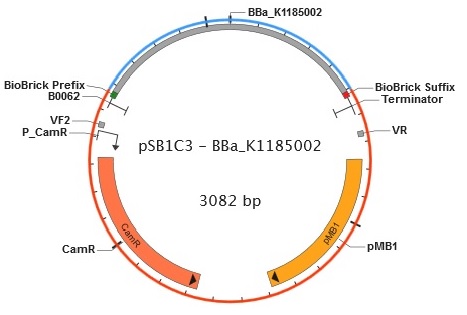 Figure 9. Plasmid map of BBa_K1185002 in pSB1C3.
HBsu-sfGFP Testing and Characterisation
To test that HBsu-sfGFP [http://parts.igem.org/Part:BBa_K1185001 (BBa_K1185001)]BioBrick works as designed; we transformed Bacillus subtilis str. 168 with the pMUTIN4 plasmid containing our HBsu-sfGFP construct. There were colonies on Plate 1 which is LB + 5ug/ml ery plates containing the transforms B. subtilis with the plasmid containing our constructs as well as plate 2 which act as our positive control. There are no colonies on the negative control plate (Plate 3) suggesting that the colonies on both Plate 1 and Plate 2 are indeed bacteria that has been successfully transformed with the plasmids instead of backgrounds, as the plasmid confers ery resistance. The results of the experiments are display in Figure 1.
 Plate 1: B. subtilis transformed with HBsu-sfGFP plated on LB + ery (5ug/ml) plate. |
 Plate 2: B. subtilis transformed with pGFPrrnB plated on LB + ery (5ug/ml) plate(positive control). |
 Plate 3: B. subtilis transformed with water plated on LB plate (viability of cells). |
Figure 1. Transformation plates of ''Bacillus subtilis'' with HBsu-sfGFP, pGFPrrnB (as possitive control) and water as control to check the viability of cells. |
In order to make sure that the BioBrick had been integrated properly into the endogenous amyE region, the transformants were plated out onto a starch plate. As the BioBrick integrated into the amyE region the cells did not produce amylase thus were unable to digest starch, and when iodine was applied to the cells they did not have a zone of clearance. As can be seen in Figure 2, both B. subtilis with either HBsu-sfGFP or HBsu-RFP constructs don't have any zone of clearance around the colonies in comparison to wild type B. subtilis str.168 and B. subtilis BSB1. The results of this iodine test further confirm that the transformants seen on Plate 1 Figure 1 were indeed colonies with our contructs integrated into the amyE region.

Figure 2. Starch plate showing alpha amylase activity. The ''B. subtilis'' 168 HBsu-GFP and HBsu-RFP colonies have no zones of clearance indicating that our HBsu-sfGFP and HBsu-RFP have integrated into the B. subtilis chromosome via the ''amyE'' region stopping starch digestion. |
To gain evidence that our BioBrick is actually binding to DNA we stained the genome of B. subtilis cells transformed with our BioBrick with DAPI. The binds DNA and emits a blue fluorescence at 465nm. As can be seen in figure 3, the localisation of the DAPI coinsides with the green fluorescence emitted by HBsu-sfGFP at 560nm, suggesting that the HBsu-RFP is binding to the B. subtilis chromosome.

Figure 3. Left hand image shows B. subtilis Phase contrast image, the central shows the bacteria expressing HBsu-sfGFP and the right corner shows fluoresecense with DAPI staining. The HBsu-sfGFP and DAPI fluorescence shows same localisation in signal, indicating our BioBrick actually binds to DNA. |
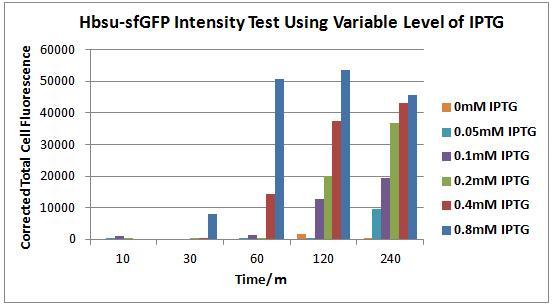
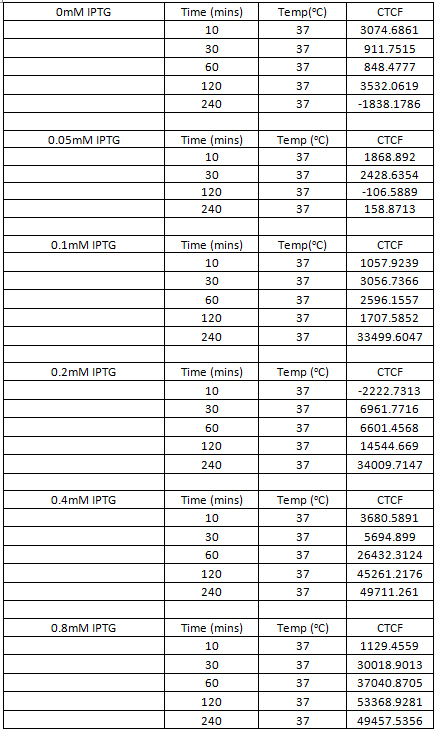
Figures 4 to 9 show the expression of our BioBrick varies depending on the presence IPTG. Each figure contains an image of B. subtilis containing our HBsu-sfGFP under the control of a IPTG inducable promoter taken with phase contrast (left) and fluorescence (right) microscopy. Images were taken 10, 30, 60, 120 and 240 minutes after the bacteria were inoculated were into there respective medium containing a variety of IPTG concentrations. In the negative control (figure 4) there is no IPTG, therefore there was no expression of HBsu-sfGFP. In figure 5 the IPTG concentration was low (0.05mM) which meant that even after 240 minutes there was no HBsu-sfGFP present. Figures 6, 7, 8 and 9 which show images of B. subtilis in IPTG concentrations of 0.1, 0.2, 0.4 and 0.8mM respectively. In all these IPTG concentrations HBsu-sfGFP was expressed by 240 minutes as shown by the green rods in the fluorescence microscopy photographs. In 0.1nM we only detected HBsu-sfGFP after 240 minutes whereas in 0.8mM IPTG was expressed after only 30 minutes. These results are useful as they characterize how long we need to leave bacteria in a particular IPTG concentration before we can expect to detect them with microscopy. Figure 10 and Table 1 summarise these results.
 10 minutes |
 30 minutes |
 60 minutes |
 120 minutes |
 240 minutes |
Figure 4. Negative control: Fluorescence microscopy showing how sfGFP expession changes with time on addition of 0mM IPTG in B.subtilis containing our HBsu-sfGFP BioBrick. |
 10 minutes |
 30 minutes |
 60 minutes |
 120 minutes |
 240 minutes |
Figure 5. Fluorescence microscopy showing how sfGFP expession changes with time on addition of 0.05mM IPTG in B.subtilis containing our HBsu-sfGFP BioBrick. |
 10 minutes |
 30 minutes |
 60 minutes |
 120 minutes |
 240 minutes |
Figure 6. Fluorescence microscopy showing how sfGFP expession changes with time on addition of 0.1mM IPTG in B.subtilis containing our HBsu-sfGFP BioBrick. |
 10 minutes |
 30 minutes |
 60 minutes |
 120 minutes |
 240 minutes |
Figure 7. Fluorescence microscopy showing how sfGFP expession changes with time on addition of 0.2mM IPTG in B.subtilis containing our HBsu-sfGFP BioBrick. |
 10 minutes |
 30 minutes |
 60 minutes |
 120 minutes |
 240 minutes |
Figure 8. Fluorescence microscopy showing how sfGFP expession changes with time on addition of 0.4mM IPTG in B.subtilis containing our HBsu-sfGFP BioBrick. |
 10 minutes |
 30 minutes |
 60 minutes |
 120 minutes |
 240 minutes |
Figure 9. Fluorescence microscopy showing how sfGFP expession changes with time on addition of 0.8mM IPTG in B.subtilis containing our HBsu-sfGFP BioBrick. |
Figure 10. Chart showing the level of GFP expression by B. subtilis at time intervals after the addition of IPTG in different concentrations.
Table 1. Table showing the level of GFP expression by B. subtilis at time intervals after the addition of IPTG in different concentrations.
HBsu-RFP Testing and Characterisation
To test that HBsu-RFP [http://parts.igem.org/Part:BBa_K1185002 (BBa_K1185002)] BioBrick works as designed; we transformed Bacillus subtilis str. 168 with the pMUTIN4 plasmid containing our HBsu-RFP construct. There were colonies on a plate of LB (erythromycin 5ug/ml) containing B. subtilis transformed with the plasmid containing the construct (Plate 1 of Fig 1), as well as on the positive control (Plate 2 of Fig 1). There are no colonies on the negative control plate (Plate 3 of Fig 1) suggesting that the colonies on both Plate 1 and Plate 2 are indeed bacteria which have been successfully transformed with the plasmids.
 Plate 1: B. subtilis transformed with HBsu-RFP plated on LB + ery (5ug/ml) plate. |
 Plate 2: B. subtilis transformed with pGFPrrnB plated on LB + ery (5ug/ml) plate(positive control). |
 Plate 3: B. subtilis transformed with water plated on LB plate (viability of cells). |
Figure 1. Transformation plates of ''Bacillus subtilis'' with HBsu-RFP, pGFPrrnB (positive control) and water (negative control). |
In order to make sure that the BioBrick had been integrated properly into the endogenous amyE region, the transformants were plated out onto a starch plate. As the BioBrick integrated into the amyE region, the cells were unable to produce amylase and as a consequence were unable to digest starch. Thus when iodine was applied to these plates there were no zones of clearance of starch around the cells (Figure 2). As can be seen in Figure 2, neither B. subtilis with the HBsu-sfGFP nor the HBsu-RFP constructs demonstrated any zone of clearance around the colonies in comparison to wild type B. subtilis str.168 and B. subtilis BSB1. The results of this iodine test further confirm that the colonies seen on Plate 1 of Figure 1 are indeed transformants of the synthetic construct.

Figure 2. Starch plate showing alpha amylase activity. The ''B. subtilis'' 168 HBsu-GFP and HBsu-RFP colonies have no zones of clearance indicating that our HBsu-sfGFP and HBsu-RFP have integrated into the B. subtilis chromosome via the ''amyE'' region, preventing starch digestion. |
B.subtilis transformed with the HBsu-RFP BioBrick were shown to produce a red fluorescence under UV light at the wavelength typical of RFP (Figure 3). To determine whether the fusion protein encoded for by the BioBrick is binding to DNA we used DAPI to stain the genome of B. subtilis which were transformed with the BioBrick. DAPI binds to DNA and emits a blue fluorescence at 465nm. As can be seen in Figure 3, the localisation of the DAPI coinsides with the red fluorescence emitted by HBsu-RFP at 610nm, suggesting that HBsu-RFP is binding to the B. subtilis chromosome.

Figure 3. Images of B. subtilis transformed with the HBsu-RFP BioBrick. The left hand image was taken through phase contrast microscopy, the central image shows emittance of 610nm light which indicates presence of HBsu-RFP and the right hand image shows emittance at 465nm light which indicates DAPI staining. The HBsu-RFP and DAPI fluorescence is shown to be localised to the same region, indicating our BioBrick does actually binds to DNA. |
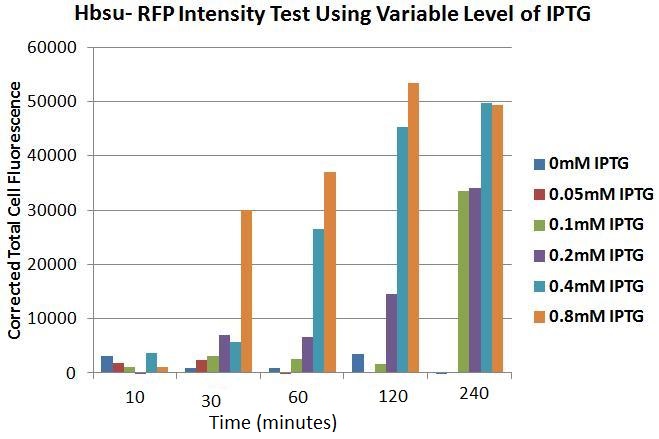
Figures 4 to 9 show the expression of our BioBrick varies depending on the presence IPTG. Each figure contains an image of B. subtilis containing our HBsu-RFP under the control of a IPTG inducable promoter taken with phase contrast (left) and fluorescence (right) microscopy. Images were taken 10, 30, 60, 120 and 240 minutes after the bacteria were inoculated were into there respective medium containing a variety of IPTG concentrations. In the negative control (figure 4) there is no IPTG, therefore there was no expression of HBsu-RFP. In figure 5 the IPTG concentration was low (0.05mM) which meant that even after 240 minutes there was no HBsu-RFP present. Figures 6, 7, 8 and 9 which show images of B. subtilis in IPTG concentrations of 0.1, 0.2, 0.4 and 0.8mM respectively. In all these IPTG concentrations HBsu-RFP was expressed by 240 minutes as shown by the red rods in the fluorescence microscopy photographs. In 0.1nM we only detected HBsu-RFP after 240 minutes whereas in 0.8mM IPTG was expressed after only 30 minutes. These results are useful as they characterize how long we need to leave bacteria in a particular IPTG concentration before we can expect to detect them with microscopy. Figure 10 and Table 1 summarise these results.
 10 minutes |
 30 minutes |
 60 minutes |
 120 minutes |
 240 minutes |
Figure 4. Negative control: Fluorescence microscopy showing how RFP expession changes with time on addition of 0mM IPTG in B.subtilis containing our HBsu-RFP BioBrick. |
 10 minutes |
 30 minutes |
 60 minutes |
 120 minutes |
 240 minutes |
Figure 5. Fluorescence microscopy showing how RFP expession changes with time on addition of 0.05mM IPTG in B.subtilis containing our HBsu-RFP BioBrick. |
 10 minutes |
 30 minutes |
 60 minutes |
 120 minutes |
 240 minutes |
Figure 6. Fluorescence microscopy showing how RFP expession changes with time on addition of 0.1mM IPTG in B.subtilis containing our HBsu-RFP BioBrick. |
 10 minutes |
 30 minutes |
 60 minutes |
 120 minutes |
 240 minutes |
Figure 7. Fluorescence microscopy showing how RFP expession changes with time on addition of 0.2mM IPTG in B.subtilis containing our HBsu-RFP BioBrick. |
 10 minutes |
 30 minutes |
 60 minutes |
 120 minutes |
 240 minutes |
Figure 8. Fluorescence microscopy showing how RFP expession changes with time on addition of 0.4mM IPTG in B.subtilis containing our HBsu-RFP BioBrick. |
 10 minutes |
 30 minutes |
 60 minutes |
 120 minutes |
 240 minutes |
Figure 9. Fluorescence microscopy showing how RFP expession changes with time on addition of 0.8mM IPTG in B.subtilis containing our HBsu-RFP BioBrick. |
Figure 10. Chart showing the level of RFP expression by B. subtilis at time intervals after the addition of IPTG in different concentrations.
Table 1. Table showing the level of RFP expression by B. subtilis at time intervals after the addition of IPTG in different concentrations.
References
[http://www.ncbi.nlm.nih.gov/pubmed/10224127 Kouji, N., Shou-ichi, Y., Takao, Y. & Kunio , Y., 1999. Bacillus subtilis Histone-like Protein, HBsu, Is an Integral Component of a SRP-like Particle That Can Bind the Alu Domain of Small Cytoplasmic RNA. The Journal of Biological Chemistry , Volume 274, pp. 13569-13576.]
[http://www.ncbi.nlm.nih.gov/pubmed/1902464 Micka, B., Groch, N., Heinemann, U. & Marahiel , M., 1991. Molecular cloning, nucleotide sequence, and characterization of the Bacillus subtilis gene encoding the DNA binding protein HBsu. Journal of Bacteriology, May;173(10), pp. 3191 -3198.]
[http://www.ncbi.nlm.nih.gov/pubmed/1382620 Micka, B. & Marahiel, M., 1992. The DNA-binding protein HBsu is essential for normal growth and development in Bacillus subtilis. Biochimie, 74(7-8), pp. 641-650.]
[http://www.ncbi.nlm.nih.gov/pubmed/10715001 Ross , M. & Setlow, P., 2000. The Bacillus subtilis HBsu protein modifies the effects of alpha/beta-type, small acid-soluble spore proteins on DNA.. Journal of Bacteriology, 182(7), pp. 1942-1948.]
 "
"


