Team:SUSTC-Shenzhen-A/Project
From 2013.igem.org
| Home | Team | Official Team Profile | Project | Parts Submitted to the Registry | Modeling | Protocol and notes | Safety | Attributions | Human Practice |
|---|
Contents |
Overall project
| Abstract
There are many applications of the game theory in some aspects of our life. Each individual has two kinds of choices--to betray or stay silent, and the choice you make would determine your fate. To betray the other side, you may risk being revenged. While staying silent, companion's betrayal may hurt you deeply. As for our project, we work out a new way to imitate the game theory by constructing a community of two E. Coli bacteria. Here we use the growth rate of each species to represent its fate. The effect of one's silent or betrayal on the other species' fate is acted through intercellular signal molecules of two quorum sensing systems. Each signal molecule regulates the expression of toxic genes in the other species and reduces its growth rate. We characterize the consequence of each strategy by quantitatively measure the growth rates of each species in the community Background
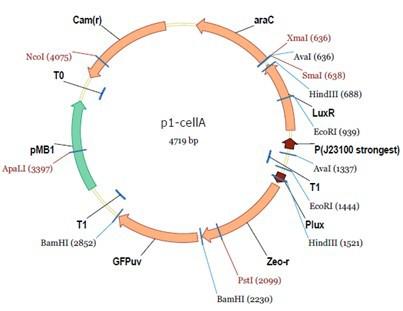
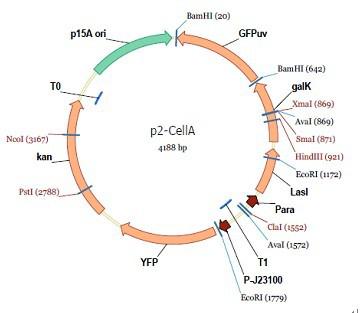
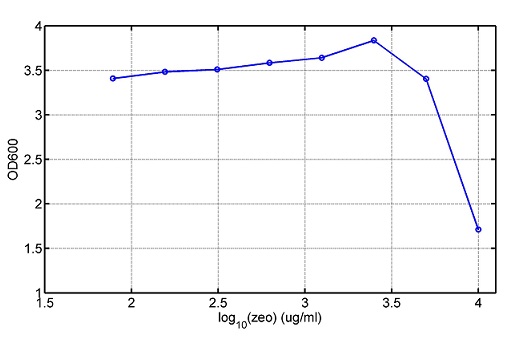
Project Detailsour designParts: Communication: quorum sensing LuxI produces 6HSL, 6HSL cross membrane, 6HSL binds to LuxR, LuxR activate promoter Plux LasI produces 12HSL, 12HSL cross membrane, 12HSL binds to LasR, LasR activate promoter Plas Poissonness genes: tetA: import Nickel into cell, which kills cell Zeo-r: Zeocin damage DNA and kills cell, Zeo-r binds and neutralize Zeocin Truth Table Tuning gene expression: repressor and inducer lacI repress gene expression (LuxI); IPTG binds to tetR and release the repression araC repress gene expression (LasI or LuxI); arabinose binds to araC and release the repression
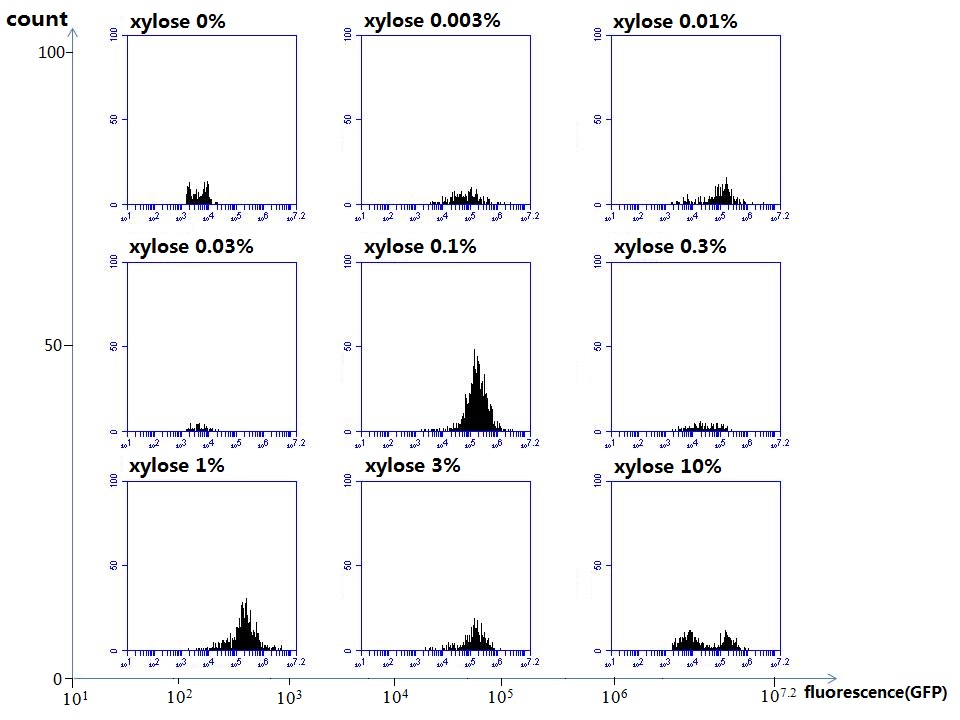
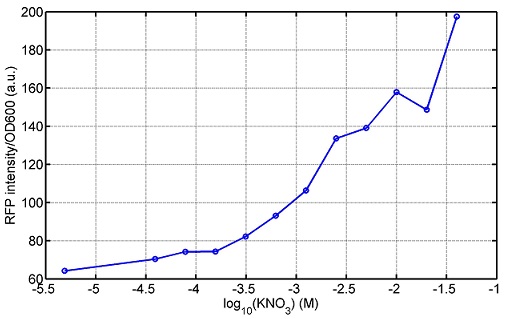
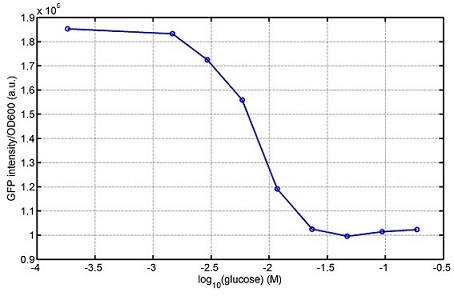
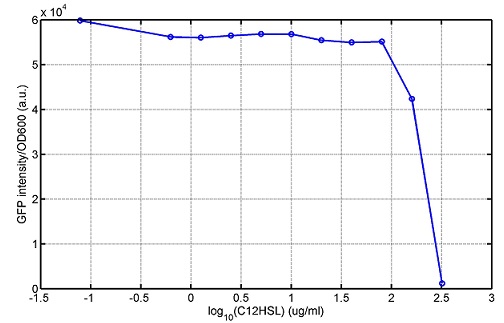
araC(with arabinose, activate LasI, tetA): promoter J23100 and rbs B0034 mCherry (red fluorescent protein labeled cell A): promoter pCon, rbs Adjustable expressions: Zeo-r, adjusted by C6HSL, produced by LuxI from cell B, depends on cell B density and IPTG concentration LasI: adjusted by arabinose, LasI produces C12HSL, control cell B tetA: adjusted by arabinose Arabinose, Zeocin, Nickel concentration are controlled by you C12SHL concentration: controlled by cell A concentration and arabinose Nickel either kill cell or slow cell growth: tetA increase sensitivity of cell B to Nickel: zeocin either kill cell or slow cell growth:Zeo-r decreases sensitivity of cell B to zeocin -asv: amino acid sequence that increase response time of LuxI, tetA and Zeo-r to regulation pMB1 and p15A: control plasmid replication in E coli</p> Kan and Cam(r): with antibiotics Kanamycin and chloramphenicol, prevent lost of plasmids Experiment processResultsproject resultsWhat we have done are the plasmid construction and the early experiments ,because of the time limite. Here are some results of our project modeling resultsBiobricks checkingprocessresultsWe chose four biobricks to detect after search . They are xylose、KNO3、glucose and 12HSL. Compared with the results of the efficiency of the xylose inducible promoter detected by the HKT, our consequence differed from them in some aspects, or better. We had used the FCM to detect it. There was an obvious tendency that the efficiency of the promoter increased as the xylose concentration gathered up. What was amazing was that the fluorescence we got was 10 times brighter than the result the HKT got, which appeared to be great. But when the concentration of the xylose was 0.03% and 0.3%, we got an unexpected result that the expression of the GFP fell after rise. What’s more. While the concentration of the xylose was 10%, the expression of the GFP decreased, which corresponded with the result of the HKT. KNO3 BBa_K774007 KNO3: This part we got a similar beginning, but have a different ending. With the increasing of nitrate of potash, the fluorescence produced by single cell increases slowly at the beginning but rapidly later. However, according to the data from NRP-UEA-Norwich, the fluorescence starts to decrease at the 20mM nitrate of potash. BBa_K741002 glucose: Compared with testing result from USTC_China, we’ve got a better data. According to the data from USTC_China, after adding glucose, the fluorescence reduces only about 10% in the most obvious one. However, we got a clear reduce in the production of fluorescence. In about 10-2.4M glucose, the fluorescence has left only a half in one cell. With the increasing of glucose, the fluorescence/OD continuously decreases, and at about 10-1M glucose, the fluorescence/OD remains very low. lalala === References=== Click the Reference to get more information. |
 "
"


