Team:Edinburgh/Project/Results/Metal promoters Results
From 2013.igem.org
Fur Box Assembly
Using the protocol found in the appendix, a 3-part construct was assembled with an acceptor vector pSB1C3 (BBa_K1122009), a Lac promoter and truncated gene called PLac_LacZ (BBa_J33207) optimised for GenBrick and a fluorescent protein, GFP (BBa_K1122004). The assembly included a fur box in the linker between PLac_LacZ and GFP. More information on the structure of the assembly can be found in the GenBrick in action section.
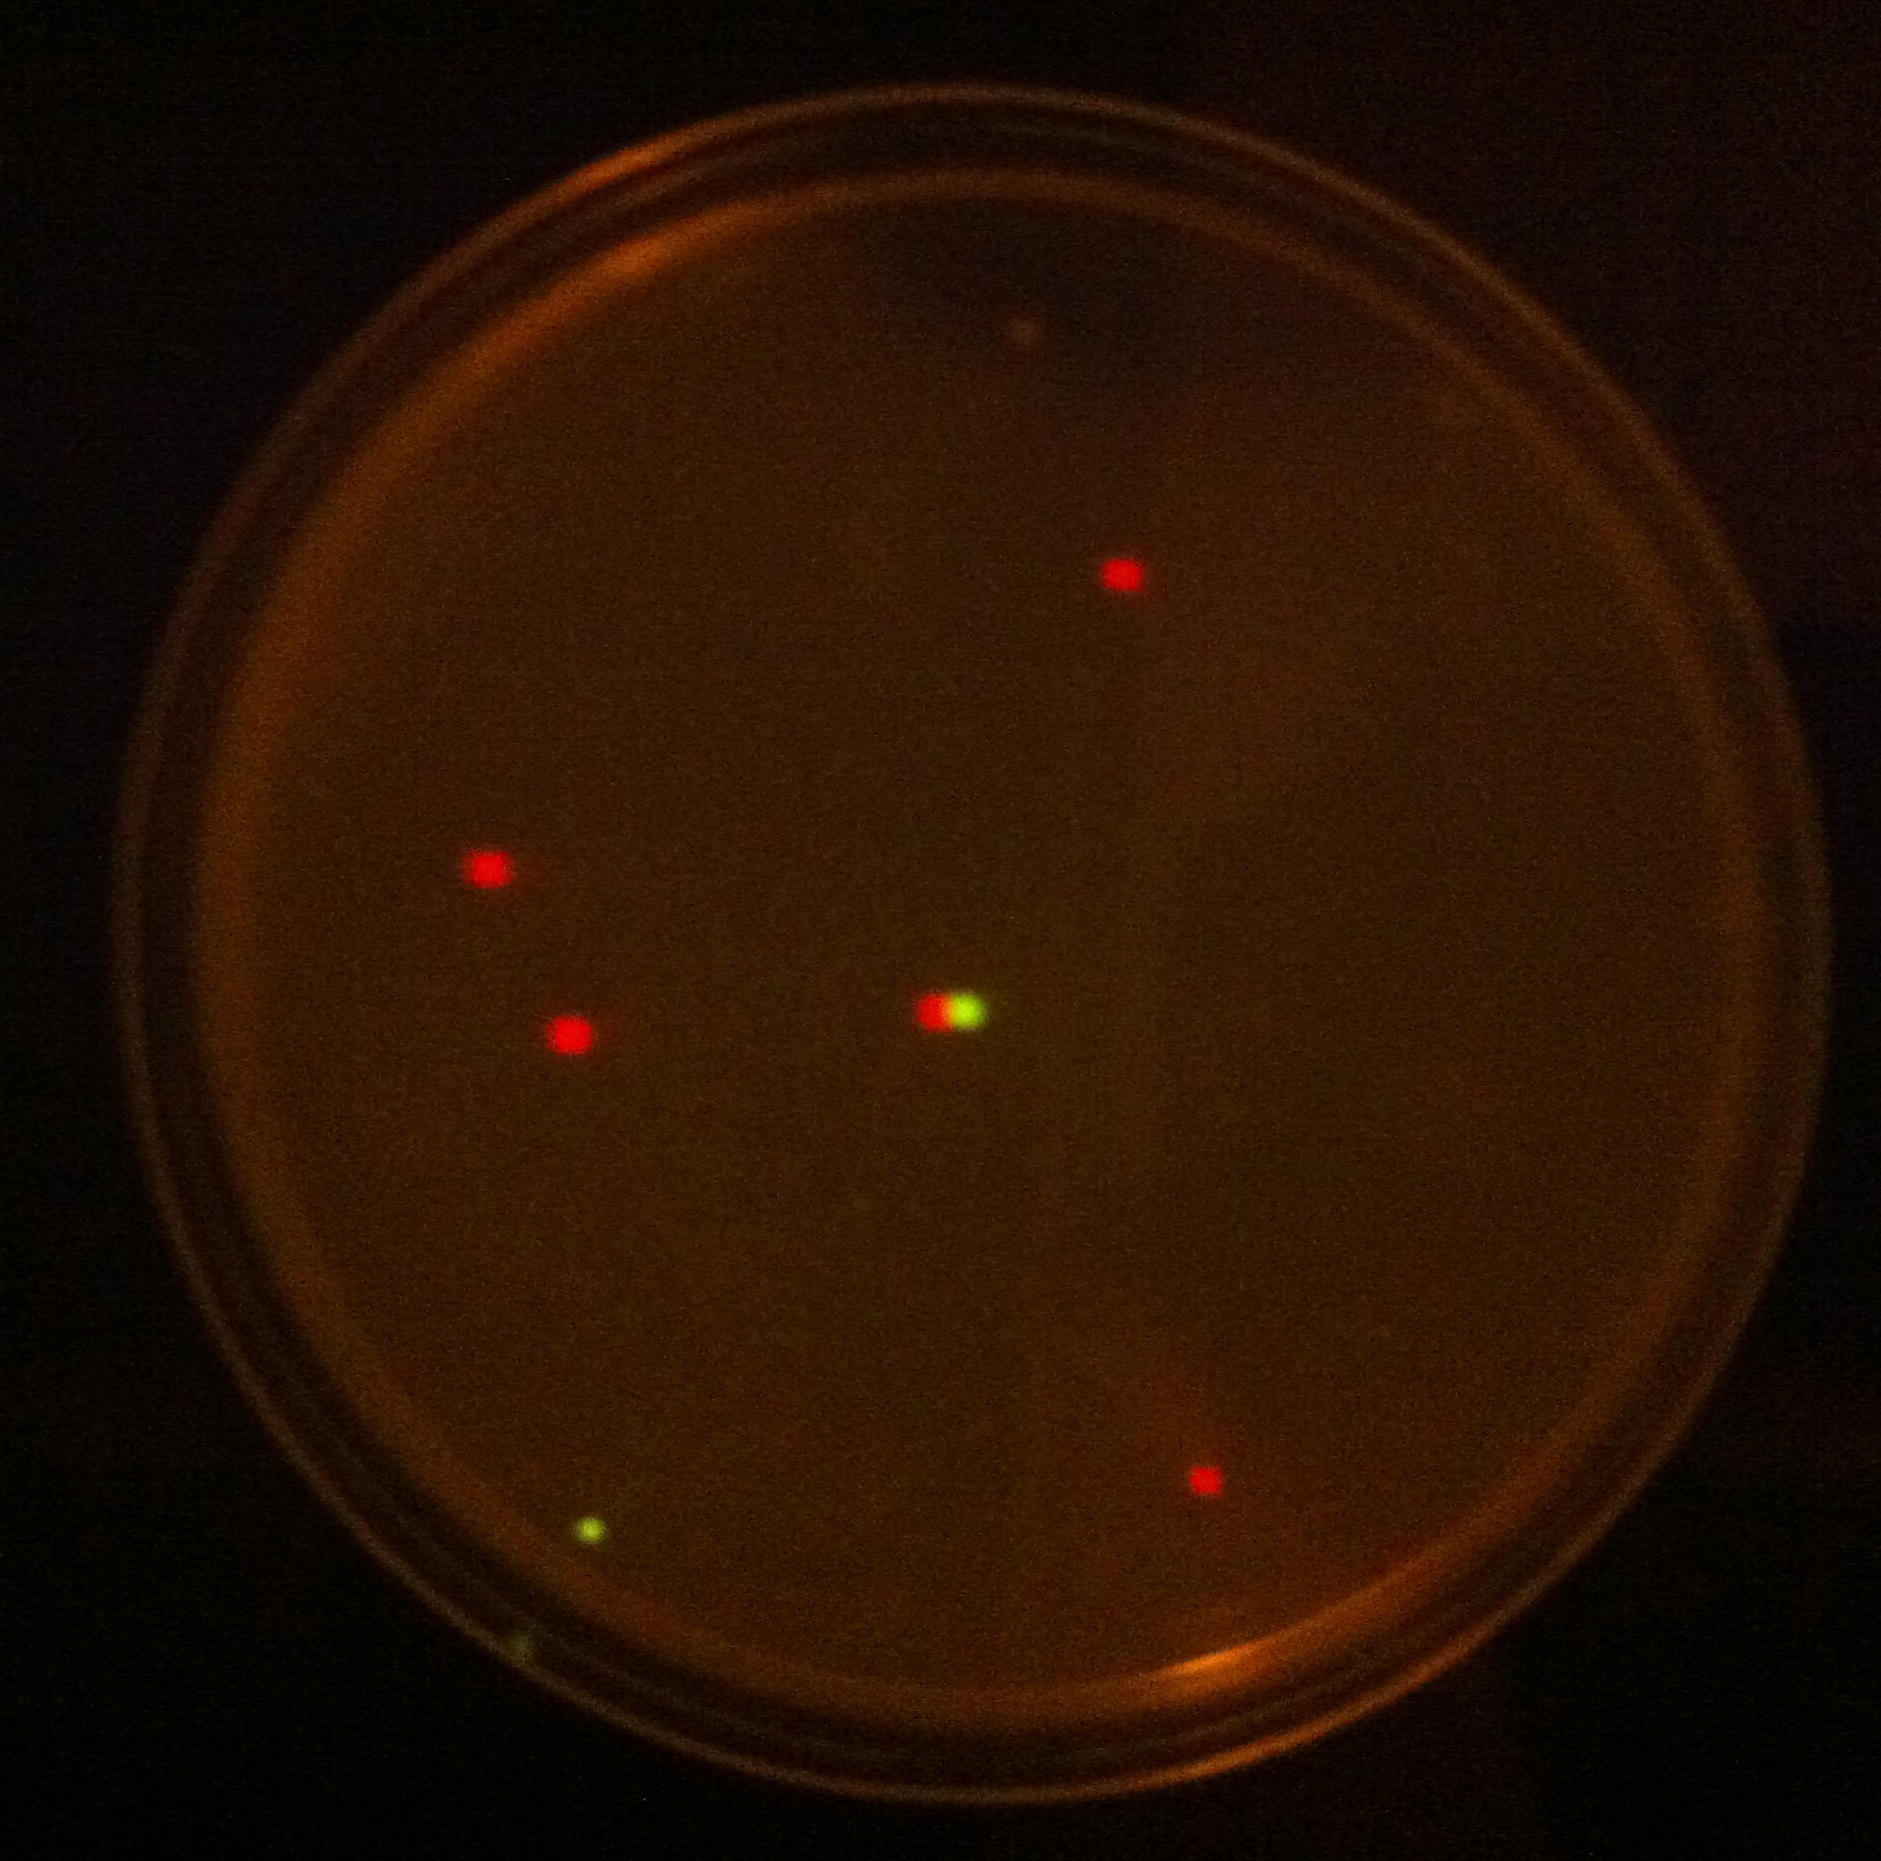
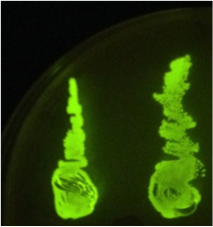
When the assembly was finished, two transformations were made with competent E. coli JM109 and plated on IPTG + chloramphenicol plates and left overnight. In one plate, 4 out of 9 colonies were green fluorescent; the other five had religated and were red fluorescent. Figure 1 shows this plate after two GFP+ colonies were taken and restreaked; the red colonies exhibit RFP from the religated vector. The other plate had a success rate of 8 out of 20 (the competent cells were concentrated x10 before plating). Figure 2 shows the assembly fluorescing under UV when no iron was present, which proves that GFP is successfully over-expressed. Figure 3 shows the gel of restriction-digestion gel using PstI and XbaI.
Figure 1. This plate has chloramphenicol and IPTG. Originally it had 4 out of 9 colonies green fluorescent and the rest red fluorescent, however two green fluorescent colonies were taken and restreaked for the iron assay.
|
Figure 2. Fur box Assembly. After transforming competent cells with the assembly and leaving overnight on an IPTG + chloramphenicol plate, 2 green fluorescent colonies were restreaked. A gel was performed to show the parts had correctly assembled. |
Figure 3. Fur box digest. On the left is the ladder, the first column is the undigested assembly which shows only one band (the second lower band is an artifact due to leakage). The second column contains the digested assembly. The size of PLac_LacZ + linkers + GFP was correct. |
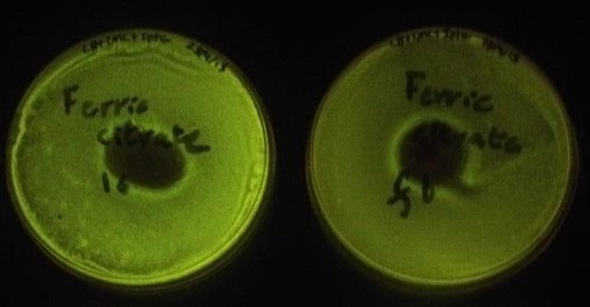
Using the same GenBrick method, an assembly was made with the same parts but instead of the fur box linker, a new linker was designed (linker 6). In effect, the new assembly was the same as the last one, except without a fur box and was used as a control for the iron assay. To test whether or not the fur box was affecting GFP production in the cell when iron concentration varied, a simple iron assay was devised with ferric citrate and ferrous sulfate. Four plates were lawn plated on IPTG and chloramphenicol plates; two plates were made with the fur box assembly (from the same original colony) and two plates were made with the linker 6 assembly (also from the same original colony). On a linker 6 and a fur box plate, 100 mg of ferric citrate was added in the middle of the plate (figure 4). On the other plates, the same assay was made but with 100 mg of ferrous sulfate (figure 5).
Figure 4. The plate on the left contained the assembly with linker 6 while the plate on the right contained the assembly with the fur box. The plate on the right was found to have a statistically significantly lower fluorescence than the plate on the left. The lower fluorescence can be explained by the fact that iron diffused out and created a gradient. Iron binds to the Fur protein which binds to the fur box and represses GFP production.
Figure 5. The plate on the left contained the assembly with linker 6 while the plate on the right contained the assembly with the fur box. Again, the plate on the right had a lower fluorescence than the plate on the left which confirms the results from figure 4.
Fur transcription factor assay
To assay the Fur gene activity, PCR was first performed to amplify Fur genomic sequence using primers containing EarI restriction sites as well as EcoRI (GenBrick compatible primers).
The forward primer was:
C GAATTC CT TCTAG ATG GCC TCT TCT TCG AAC CGT ATT GAT CGT
The reverse complement primer was:
ATC CTGCAG CT AC TAG TAC TCT TCA GGC TTC AGT TTC TTT TCC
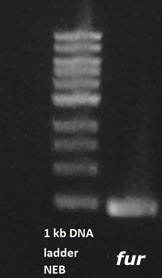
Next, the gene was restricted and ligated into pSB1C3 using XbaI and PstI. An agarose gel was performed and show to have the Fur gene properly integrated within the vector (figure 6).
Figure 6.
Figure 7.

| 
| | | | 
|
| This iGEM team has been funded by the MSD Scottish Life Sciences Fund. The opinions expressed by this iGEM team are those of the team members and do not necessarily represent those of MSD | |||||
 "
"


