Team:Edinburgh/Project/Appendix
From 2013.igem.org
Appendix
Ethanol production
Figure 1. Annotated sequence of the BBa_K173003. Underlined parts show binding sites for the MABEL primers. Sequence with red background will be deleted following blunt- ended ligation
Figure 2. Full annotated SDS-PAGE result showing induced fusion, non-fusion and vector samples. For both gels a broad range protein ladder from NEB was used.
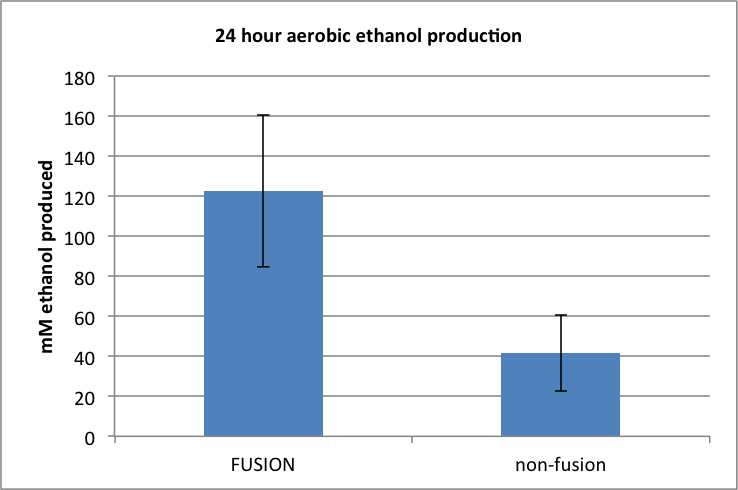
Figure 3. Amount of ethanol produced following 24h aerobic incubation.
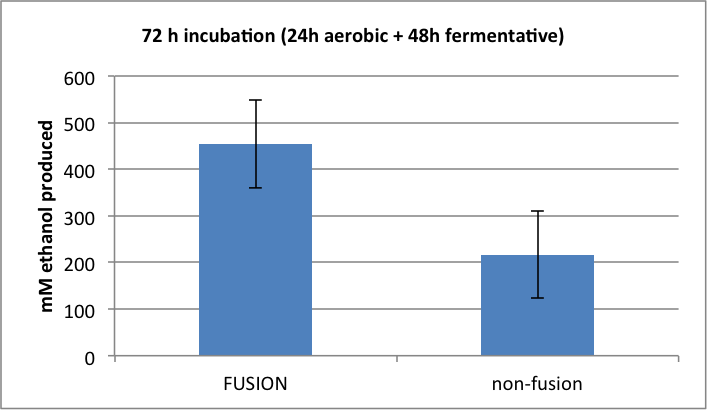
Figure 4. Amount of ethanol produced following 72h mixed incubation.
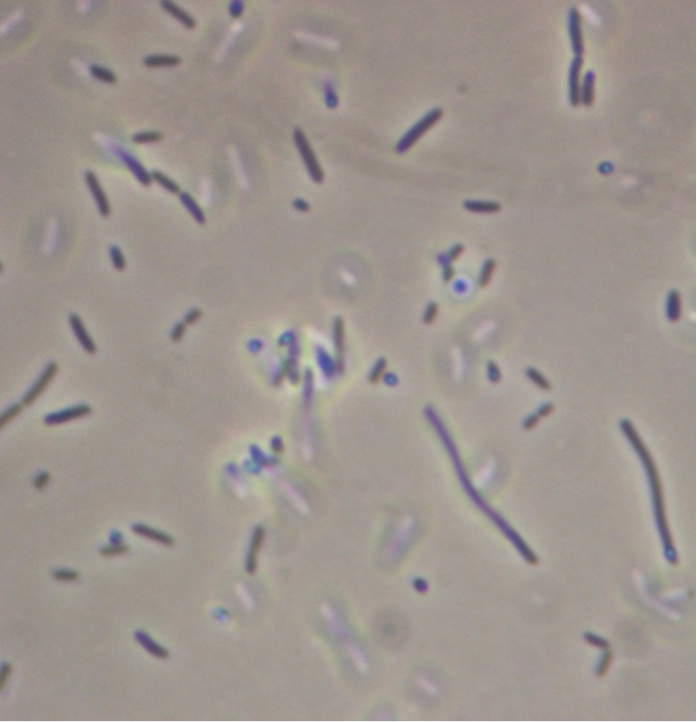
Figure 5. Full microscopic image obtained for JM109 ‘’E. coli’’ expressing fused pET cassette.
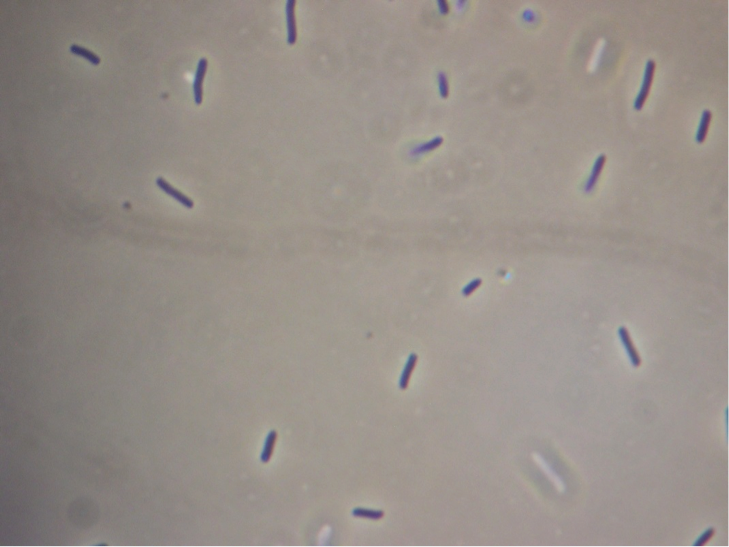
Figure 6. Full microscopic image obtained for JM109 ‘’E. coli’’ bearing fused pET cassette but not induced to express it.
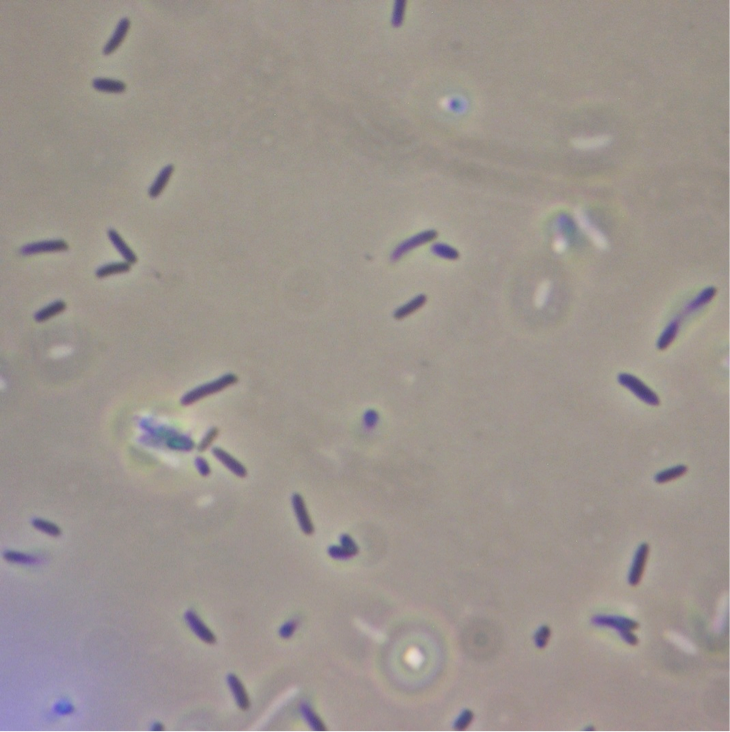
Figure 7. Full microscopic image obtained for JM109 ‘’E. coli’’ expressing non-fused pET cassette.
Presented below is the detailed description of MABEL based conversion of pLac to pSpac:
>BBa_J33207 (Plac + lacZ') Part-only sequence (600 bp)
ctcatgttatatcccgccgttaaccaccatcaaacaggattttcgcctgc tggggcaaaccagcgtggaccgcttgctgcaactctctcagggccaggcg gtgaagggcaatcagctgttgcccgtctcactggtgaaaagaaaaaccac cctggcgcccaatacgcaaaccgcctctccccgcgcgttggccgattcat taatgcagctggcacgacaggtttcccgactggaaagcgggcagtgagcg caacgcaattaatgtgagttagctcactcattaggcaccccaggctttac actttatgcttccggctcgtatgttgtgtgaaattgtgagcggataacaa tttcacacaggaaacagctatgaccatgattacggattcactggccgtcg ttttacaacgtcgtgactgggaaaaccctggcgttacccaacttaatcgc cttgcagcacatccccctttcgccagctggcgtaatagcgaagaggcccg caccgatcgcccttcccaacagttgcgcagcctgaatggcgaatggcgct ttgcctggtttccggcaccagaagcggtgccggaaagctggctggagtga
Underlined: promoter -35, -10, and LacI binding site
>BBa_J15503 (Pspac) Part-only sequence (284 bp)
cccagtccagactattcggcactgaaattatgggtgaagtggtcaagacc tcactaggcaccttaaaaatagcgcaccctgaagaagatttatttgaggt agcccttgcctacctagcttccaagaaagatatcctaacagcacaagagc ggaaagatgttttgttctacatccagaacaacctctgctaaaattcctga aaaattttgcaaaaagttgttgactttatctacaaggtgtggcataatgt gtggaattgtgagcggataacaattaagcttaag
Underlined: promoter start (used in vectors etc), -35, -10, and LacI binding site. Italics: additional identical bases with J32207. Capital A: +1 of mRNA.
To convert Plac to Pspac requires addition of 36 new bases upstream of the homology region. This is too much for regular PCR with standard primers but easily in range for MABEL, which would be a simpler procedure in any case. We therefore propose to design two primers which can be used to convert any J33207-controlled construct to a spac construct by MABEL.
Note that there is a further 6 bases of upstream homology separated by a single base change, A to G. Since the complementary base will be T, and G-T mismatches are relatively stable, this can also count towards homology for primer design.
Forward primer:
tatctacaaggtgtggcataatgtgtggaattgtgagcggataacaatt
(total 49 bases; underlined bases are homologous)
Reverse primer complement:
ggcaaaccagcgtggaccgc ttgc aaaaagttgttgactt
The first part of this corresponds to bases 54 to 77 of J33207. The last four of these also match the first four bases of the sequence being introduced.
Reverse primer sequence:
aagtcaacaacttttt gcaa gcggtccacgctggtttgcc
Using these primers, any circular construct containing a J33207 promoter (including almost all expression constructs made in the French lab) will be converted to a construct with a new spac promoter BioBrick instead; this will retain the LacI binding site as well as lacZ' of J32207, so if there is any expression at all in E. coli (as we might expect), blue-white selection can still be used when transferring the cassette into a vector such as pTG262.
The complete sequence of the new promoter BioBrick will be:
ctcatgttatatcccgccgttaaccaccatcaaacaggattttcgcctgc
tggggcaaaccagcgtggaccgcttgcaaaaagttgttgactttatctac
aaggtgtggcataatgtgtggaattgtgagcggataacaatttcacacag
gaaacagctatgaccatgattacggattcactggccgtcgttttacaacg
tcgtgactgggaaaaccctggcgttacccaacttaatcgccttgcagcac
atccccctttcgccagctggcgtaatagcgaagaggcccgcaccgatcgc
ccttcccaacagttgcgcagcctgaatggcgaatggcgctttgcctggtt
tccggcaccagaagcggtgccggaaagctggctggagtga
Underlined: bases which are from J15503. Italic: region of difference from J33207.
This should be given a new BioBrick code, entered into the Registry and labelled as 'spac promoter plus lacZ' alpha peptide'.
Recipes (or protocols if you prefer so)
- 2xLB medium:
Tryptone, 20g Yeast extract, 10g NaCl, 10g (when making more medium add 20g) Dissolve in 800 ml dH2O, adjust pH to 7.0 with NaOH/HCl, adjust volume to 1 litre and autoclave.
NOTE: Use this medium when diluting the culture with high volumes. If possible try to use same volume of 2xLB and the solution you want to add to it as B. subtilis does not grow really well in highly concentrated LB.
- Preparation of competent E. coli cells:
TSS buffer is required for this process. 24 ml TSS:
-17 ml LB -5 ml 40% w/v PEG 3350 -1 ml 1 M MgCl2 filter sterylise the mix above and add: -1 ml DMSO
Procedure:
Propagate E. coli from plate into 50 ml of LB medium. Grow until OD600 of about 0.2 to 0.5 is obtained. Pellet 1 ml of culture for each eppendorf of competent cells. Remove supernatant and add 100 ul of ice-cold TSS buffer. Incubate with TSS for 30 min on ice and store in -80 deg.C
- Transformation of competent E. coli cells:
1.Use 100ul aliquots of competent E. coli cells from the -80 deg. C freezer.
2.Place cells directly on ice. Try to limit the exposure to heat (i.e. do not touch the bottom of the eppendorf)
3.Add 2 ul of plasmid DNA to the cells and incubate on ice for 30 - 60 minutes.
4.Heat shock the cells in 42 deg. C for 90 seconds (exact timing)
5.After heat shock place the cells on ice for additional 90 seconds.
6.Add 900 ul of LB medium to the cells.
7.Grow in 37 deg. C shaking for 45 - 60 minutes.
8.Plate 100 ul of cells on a plate with appropriate antibiotic.
- Ethanol assay:
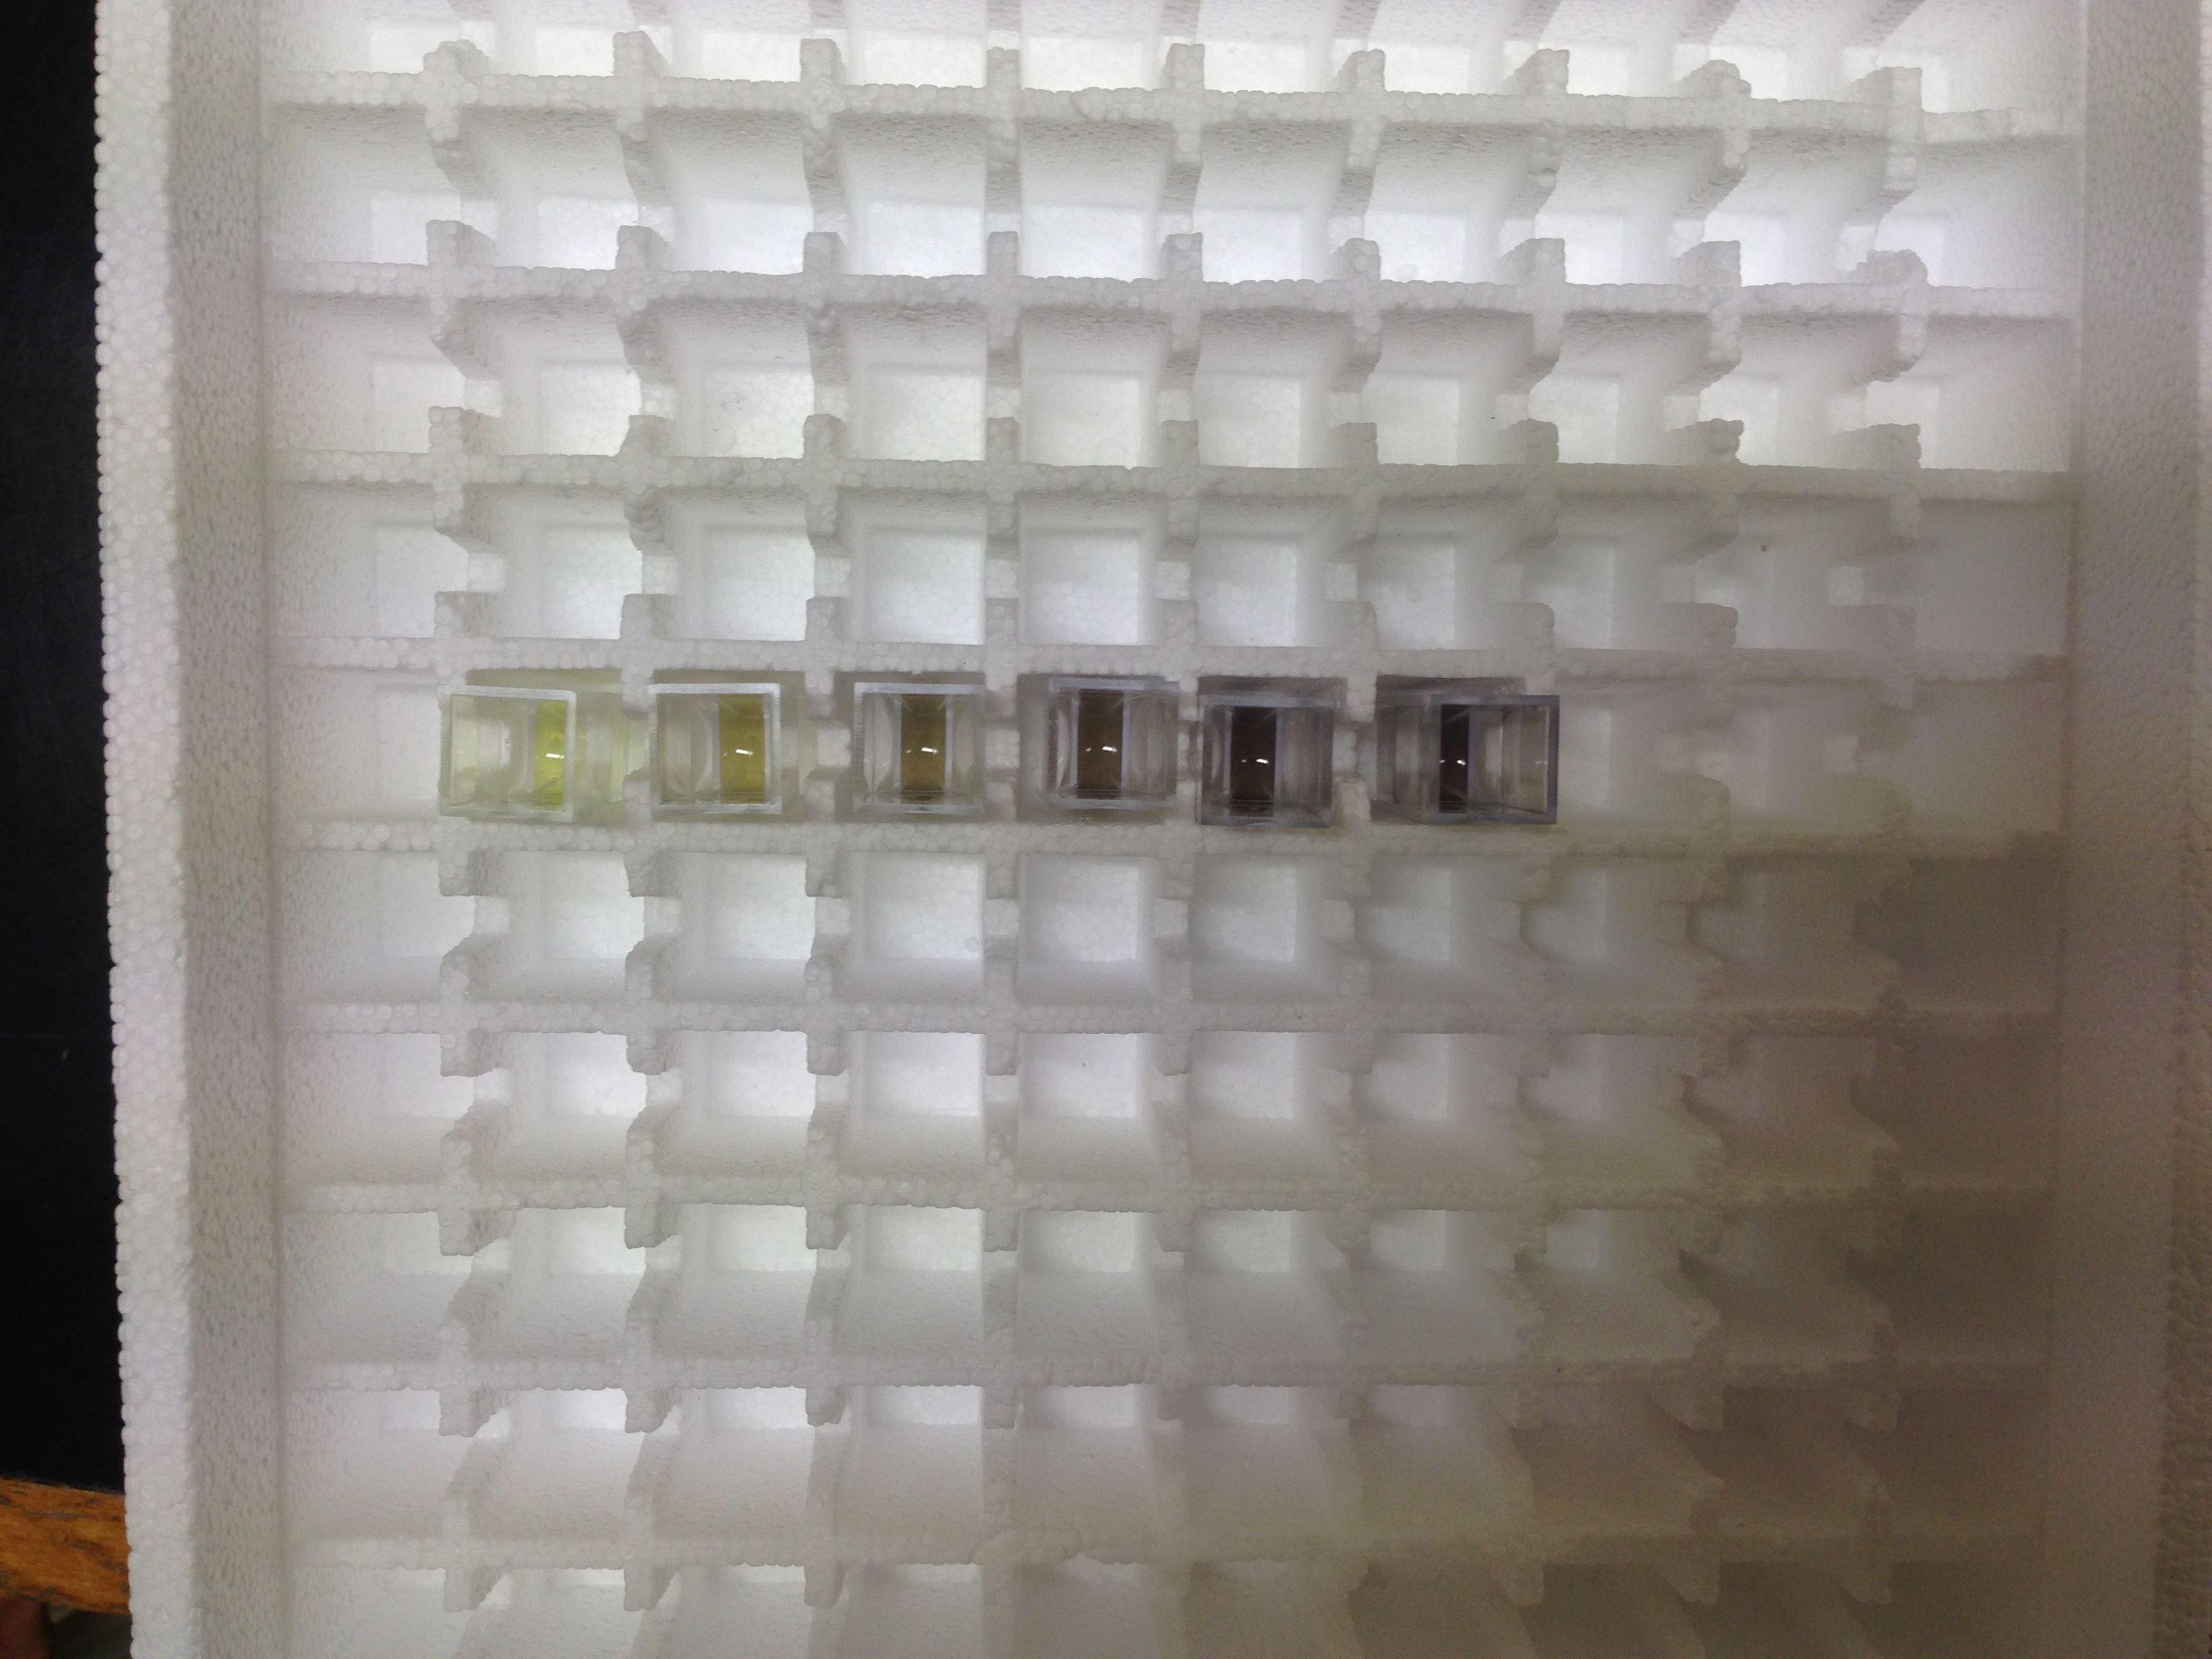
Figure 8. Alcohol assay standard readout.
Buffer used in the assay: 50 mM tris-HCl pH= 7.5 (0.118g tris base + 0.635g tris.HCl in 100 ml of H2O)
Following solutions were prepared in the buffer:
- yeast ADH: 5 mg/ ml
- NAD+: 20 mM (13.3 mg/ ml)
- PMS: 20 mM (6.1 mg/ ml)
- INTV: 50 mM (25.3 mg/ ml) --> INTV has low solubility; can add few drops of DMSO to dissolve.
- ethanol: 30 mM (1.75 ul/ ml) --> required for the standard absorbance curve
Procedure:
Into 1ml of buffer add:
- 5ul yeast ADH
- 1 ul NAD+
- 1 ul PMS
- 20 ul INTV
mix well
Add 33 ul of the standard ethanol solution (30 mM) and 33 ul of diluted (DF=2) ethanol solution to obtain 1mM and 0.5mM standard responses respectively. The 0 mM EtOH response is obtained by adding 33 ul of H2O. Mix well after addition of the ethanol.
Incubate the assay for 15 min in room temperature. Following that take the OD500 readings which will correspond to the ethanol concentration. You can use H2O as a blank.
To evaluate the levels of EtOH in your bacterial medium spin down the cells from O/N culture and use 33 ul of supernatant as a substrate for the assay. The readings should be taken following exactly the same incubation period as ethanol standard. Make a fresh standard each day you want to analyse bacterial culture.
- Preparation of SDS-PAGE:
12% resolving gel:
H2O: 6.6 ml 30% acrylamide mix: 8.0 ml 1.5 M Tris (pH 8.8): 5.0 ml 10% SDS: 0.2 ml 10% ammonium persulphate: 0.2 ml TEMED: 0.008 ml
5% separating gel:
H2O: 3.4 ml 30% acrylamide mix: 0.83 ml 1.5 M Tris (pH 6.8): 0.63 ml 10% SDS: 0.05 ml 10% ammonium persulphate: 0.05 ml TEMED: 0.005 ml
5 x Tris-glycine electrophoresis buffer (running)
94 g Glycine and 15.1 g Tris base ---> dissolve in 900 ml of H20
add 50 ml of SDS (10% w/v)
make up to 1000 ml

| 
| | | | 
|
| This iGEM team has been funded by the MSD Scottish Life Sciences Fund. The opinions expressed by this iGEM team are those of the team members and do not necessarily represent those of MSD | |||||
 "
"


