"
"
Team:BYU Provo/Notebook/SmallPhage/Summerexp/8.26 Mutagen Concentration Test
From 2013.igem.org
(Difference between revisions)
| (3 intermediate revisions not shown) | |||
| Line 106: | Line 106: | ||
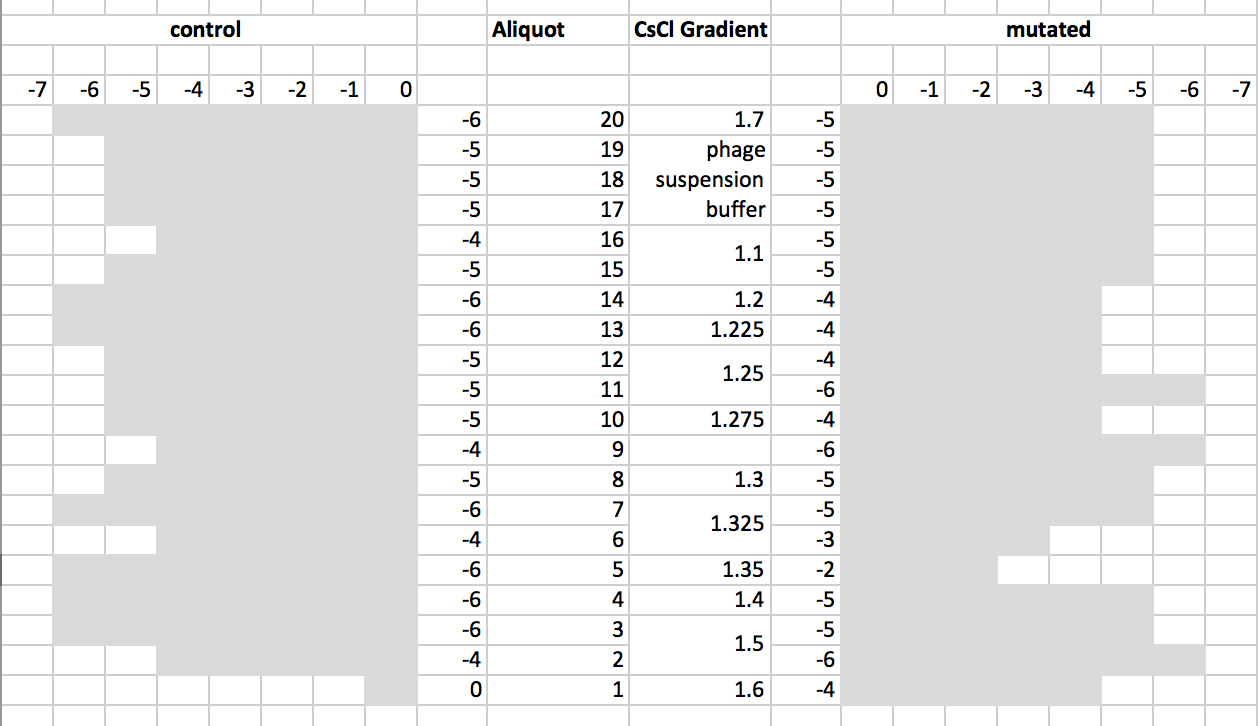
* CsCl separation was performed for both 0 and 500 sample. The finished gradient was aliquoted into 20 eppendorf tubes each, each containing 1-1.5 mL solution. We will need to determine phage characteristics in each aliquot before proceeding with dialysis and TEM. | * CsCl separation was performed for both 0 and 500 sample. The finished gradient was aliquoted into 20 eppendorf tubes each, each containing 1-1.5 mL solution. We will need to determine phage characteristics in each aliquot before proceeding with dialysis and TEM. | ||
| - | 5) Characterizing post-CsCl phage (8.27-9. | + | 5) Characterizing post-CsCl phage (8.27-9.2) |
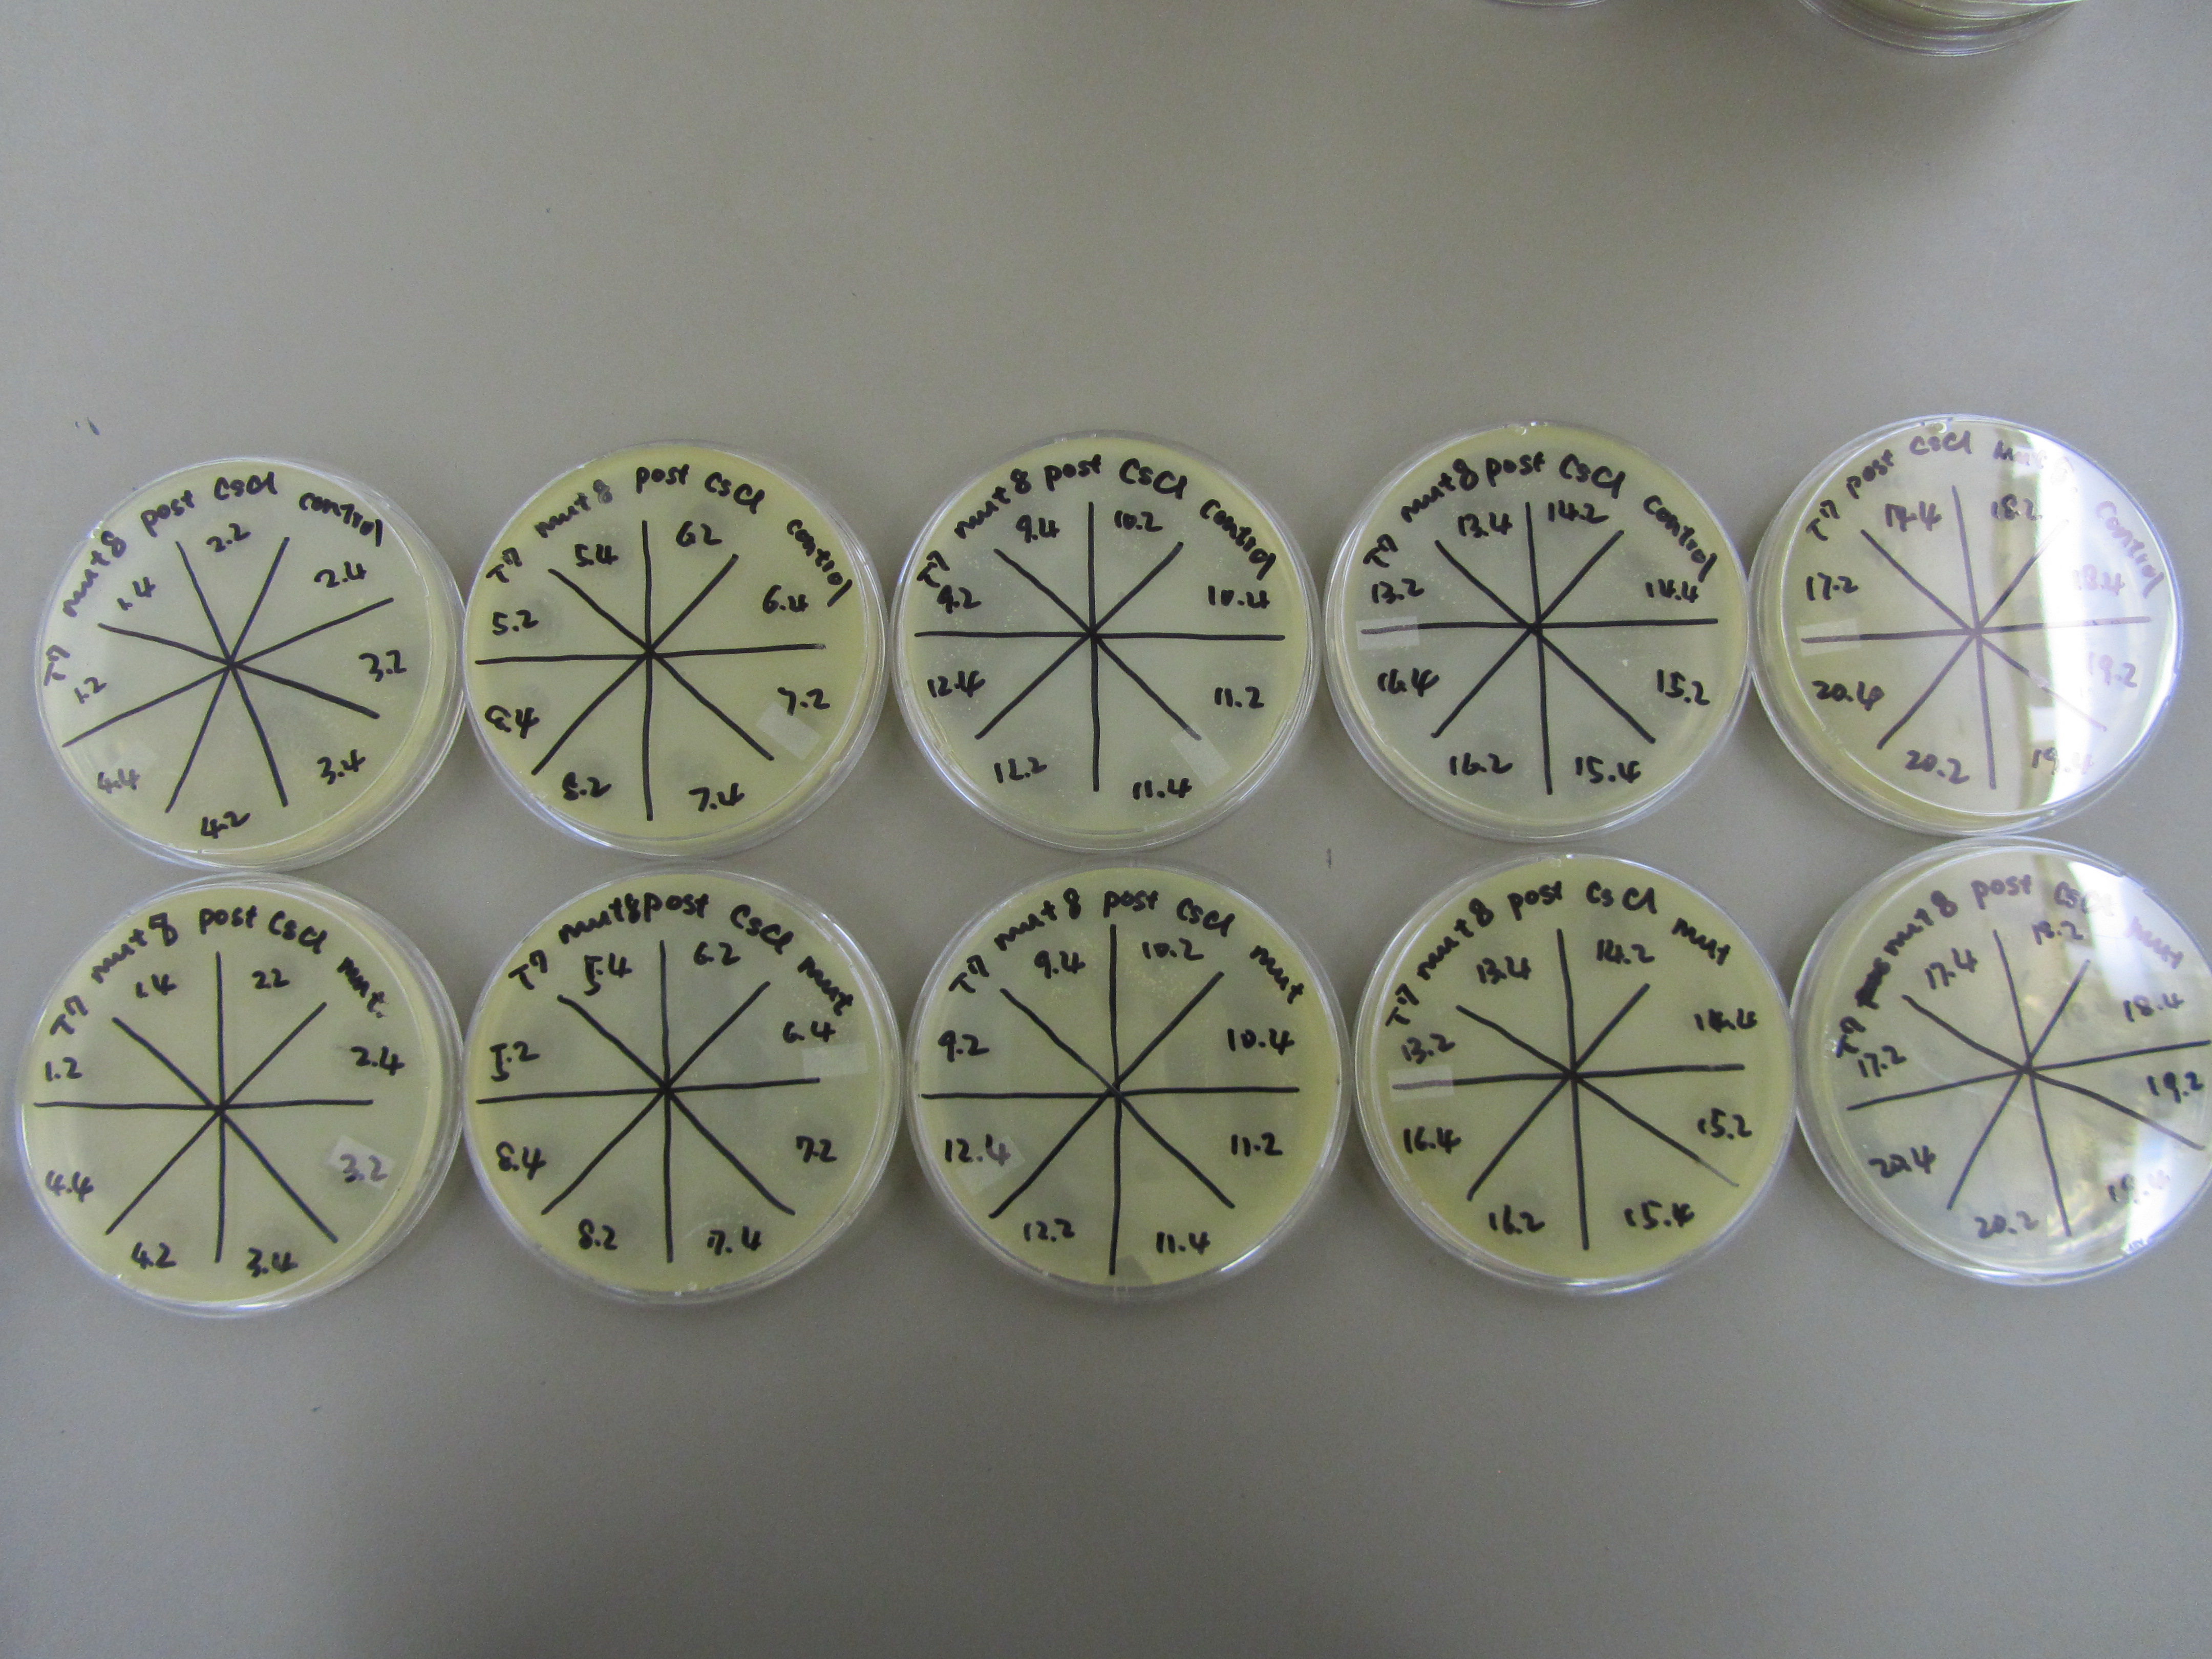
* Spot test was performed to estimate phage concentration within each aliquot. Specifically, 1:100 dilution series were performed for each aliquot to generate a -2 and -4 dilution sample for each. All dilution samples were spotted (5uL) onto plates overlaid with 0.5mL of E coli B overnight and 5mL of x1 agar. | * Spot test was performed to estimate phage concentration within each aliquot. Specifically, 1:100 dilution series were performed for each aliquot to generate a -2 and -4 dilution sample for each. All dilution samples were spotted (5uL) onto plates overlaid with 0.5mL of E coli B overnight and 5mL of x1 agar. | ||
| Line 112: | Line 112: | ||
* Nearly all aliquot formed plaques during the previous spot test at -4. Thus further dilutions (to -5 and -6) and spot test was performed to more accurately estimate phage concentration. Spot test procedures are similar to that used previously. | * Nearly all aliquot formed plaques during the previous spot test at -4. Thus further dilutions (to -5 and -6) and spot test was performed to more accurately estimate phage concentration. Spot test procedures are similar to that used previously. | ||
| - | * Results from concentration spot test | + | * 12 extra spot tests were performed to verify results where plaque formation was faint or unclear. |
| + | |||
| + | * Results from concentration spot test were superimposed on the deduced gradient. Reconstructed CsCl gradient is drawn below in the Results section. | ||
'''V) Results''' | '''V) Results''' | ||
| Line 142: | Line 144: | ||
* Deduced gradient with respective estimated titer. | * Deduced gradient with respective estimated titer. | ||
| - | [[File:BYUSPM8-4.JPG| | + | [[File:BYUSPM8-4.JPG|500px|center|link=]] |
'''VI) Conclusion''' | '''VI) Conclusion''' | ||
| + | : This round of mutagenesis was successful in that we were able to get a high titer of phage in each aliquot (with an estimated average of 10E7 pfu/mL). However, because phages are spread out throughout the gradient and did not band, we cannot identify which ones are wild type and which ones are mutant. After discussion with Dr. Grose, we decided to hold off our next round of mutagenesis until the Phage Purification Team can get the wild type phage to band. In the meantime, we'll complete our modeling experiments. | ||
|} | |} | ||
Latest revision as of 05:08, 6 September 2013
| ||
|
|
8.26 Mutagen Concentration Test - Eighth Protocol
I) Purpose
II) Expected Outcome
III) Reagents Used
IV) Procedure 1) Propagation of T7 bacteria phage (8.22-8.25)
2) Applying the mutagen (8.26)
3) Spot test to determine phage concentration (8.26)
4) CsCl gradient (8.26)
5) Characterizing post-CsCl phage (8.27-9.2)
V) Results 1) T7 propagation
 2) Applying the mutagen
3) Spot test to determine phage concentration
 5) Characterizing post-CsCl phage
| |