|
- Small Phage
- March-April
- May-June
- July-August
- September-October
|
8.26 Mutagen Concentration Test - Eighth Protocol
I) Purpose
- To mutate T7 phage for selection of different capsid sizes.
II) Expected Outcome
- A decrease in phage viability with increasing mutagen concentration.
- A few random mutations that produce smaller and larger phage which can then be isolated.
III) Reagents Used
- 5-bromodeoxyuridine stock in freezer labeled T7 (10mg/mL)
- Uracil solution (2.5mg/mL)
- Adenine solution (5mg/mL)
IV) Procedure
1) Propagation of T7 bacteria phage (8.22-8.25)
- Phage concentration of 7.19 T7 stock during its storage in the fridge. Thus, we needed to propagate T7 for preparation in mutagenesis.
- Propagation procedure: 4mL of LB and 1mL of E coli B liquid culture overnight were added to 2 separate test tube. To the test tube labeled +phage, 10uL of 7.19 T7 stock was added. Both test tubes were incubated on shaker at 37 Celsius for approximately 2 full days.
- After propagation, phage solution was aliquoted (1mL increments) into eppendorf tubes and centrifuged at 3000rpm for 5 minutes. The supernatant was removed and 100uL of chloroform was added to each.
- 1:10 dilution series was performed to generate -1 through -7 sample. Spot test followed when we spotted 5uL of each sample unto one plate overlaid with 0.5mL of E coli B overnight and 5mL of x1 top agar.
- Titers were performed for the -6 and -7 samples: 0.5 mL of E coli B liquid culture overnight was infected with 20 uL of each phage sample for approximately 20 minutes before 5mL of x1 top agar was added and content plated.
2) Applying the mutagen (8.26)
- Label 4 test tubes C, 0, 500, and 1000. Add 10mL of LB and 200ul of E coli B overnight into each test tube. Incubate on the shaker at 37 Celsius for approximately an hour before 50uL of adenine solution was added to each test tube.
- Remove all the test tubes off the shaker after another hour of incubation. Add 40ul of adenine and 80ul of uracil to each test tube. Also add the corresponding amount in ul of 5-bromodeoxyuridine, a mutagen, to each test tube. (Ex: Add 200ul of mutagen to tube labeled 200)
- Place all the tubes on the shaker at 37 Celsius.
- After 20 minutes, take only the tube labeled 0 from the shaker. Take 1mL from this tube and pipette it into a cuvette labeled 0. Using 1mL of LB in a cuvette, blank the spectrophotometer at 600 OD. Then measure the absorbance of the cuvette labeled 0. (In the actual procedure, 2 readings were done on the tube labeled 0 to check for consistency. This means that the tube labeled 0 only had 8mL in it when the phage was added, which will slightly alter the phage to bacteria ratio for that tube.)
- Remove the other two tubes after 30 minutes of incubation and add 87ul of T7 phage from the "10ul 7.19 stock" to each tube. (There should be a 1:10 phage to bacteria concentration. The calculations are as follows: The spectrophotometer reading was 0.435A, which indicates there are 2.175E8 bacteria/ml. Because there are 10ml in each tube, there is roughly 2.175E9 bacteria per tube. This means that we need 2.175E8 phage added to each tube. Because the 7.19 stock is concentrated at 2.5E9 phage/ml [5E7 phage/20ul], 87ul of phage will provide 2.175E8 phage.)
- Incubate all the tubes on the shaker at 37 Celsius for 80 minutes.
- Remove all the tubes and add 1mL of chloroform to each. Gently shake each tube and centrifuge it at 4000rpm for 10 minutes at 7 Celsius. Remove the supernatant from each tube with a pipette and place it in a new tube with the same label. Be careful not to get the chloroform or bacteria when you remove the supernatant.
- Store the supernatants at 4 Celsius.
3) Spot test to determine phage concentration (8.14)
- Dilution series -2 through -7 were performed all three samples (0, 200, and 500). These dilutions samples were then used in spot tests to estimate phage titer.
- Specifically, three plates were prepared for spot tests using E. coli B by adding 0.5mL overnight into a tube, mixing it with 5mL of x1 top agar, and then plating the content. 5ul of each dilution sample was spotted onto corresponding plate.
4) CsCl gradient (8.15)
- Phage Purification Team was able to finalize their procedures for performing CsCl gradient on T7 phage. For specifics please refer to 8.16 CsCl Gradient
- The finished gradient was aliquoted into 27 eppendorf tubes, each containing 0.5-1mL solution. We will need to determine phage characteristics in each aliquot before proceeding with dialysis and TEM.
5) Characterizing post-CsCl phage (8.16-8.18)
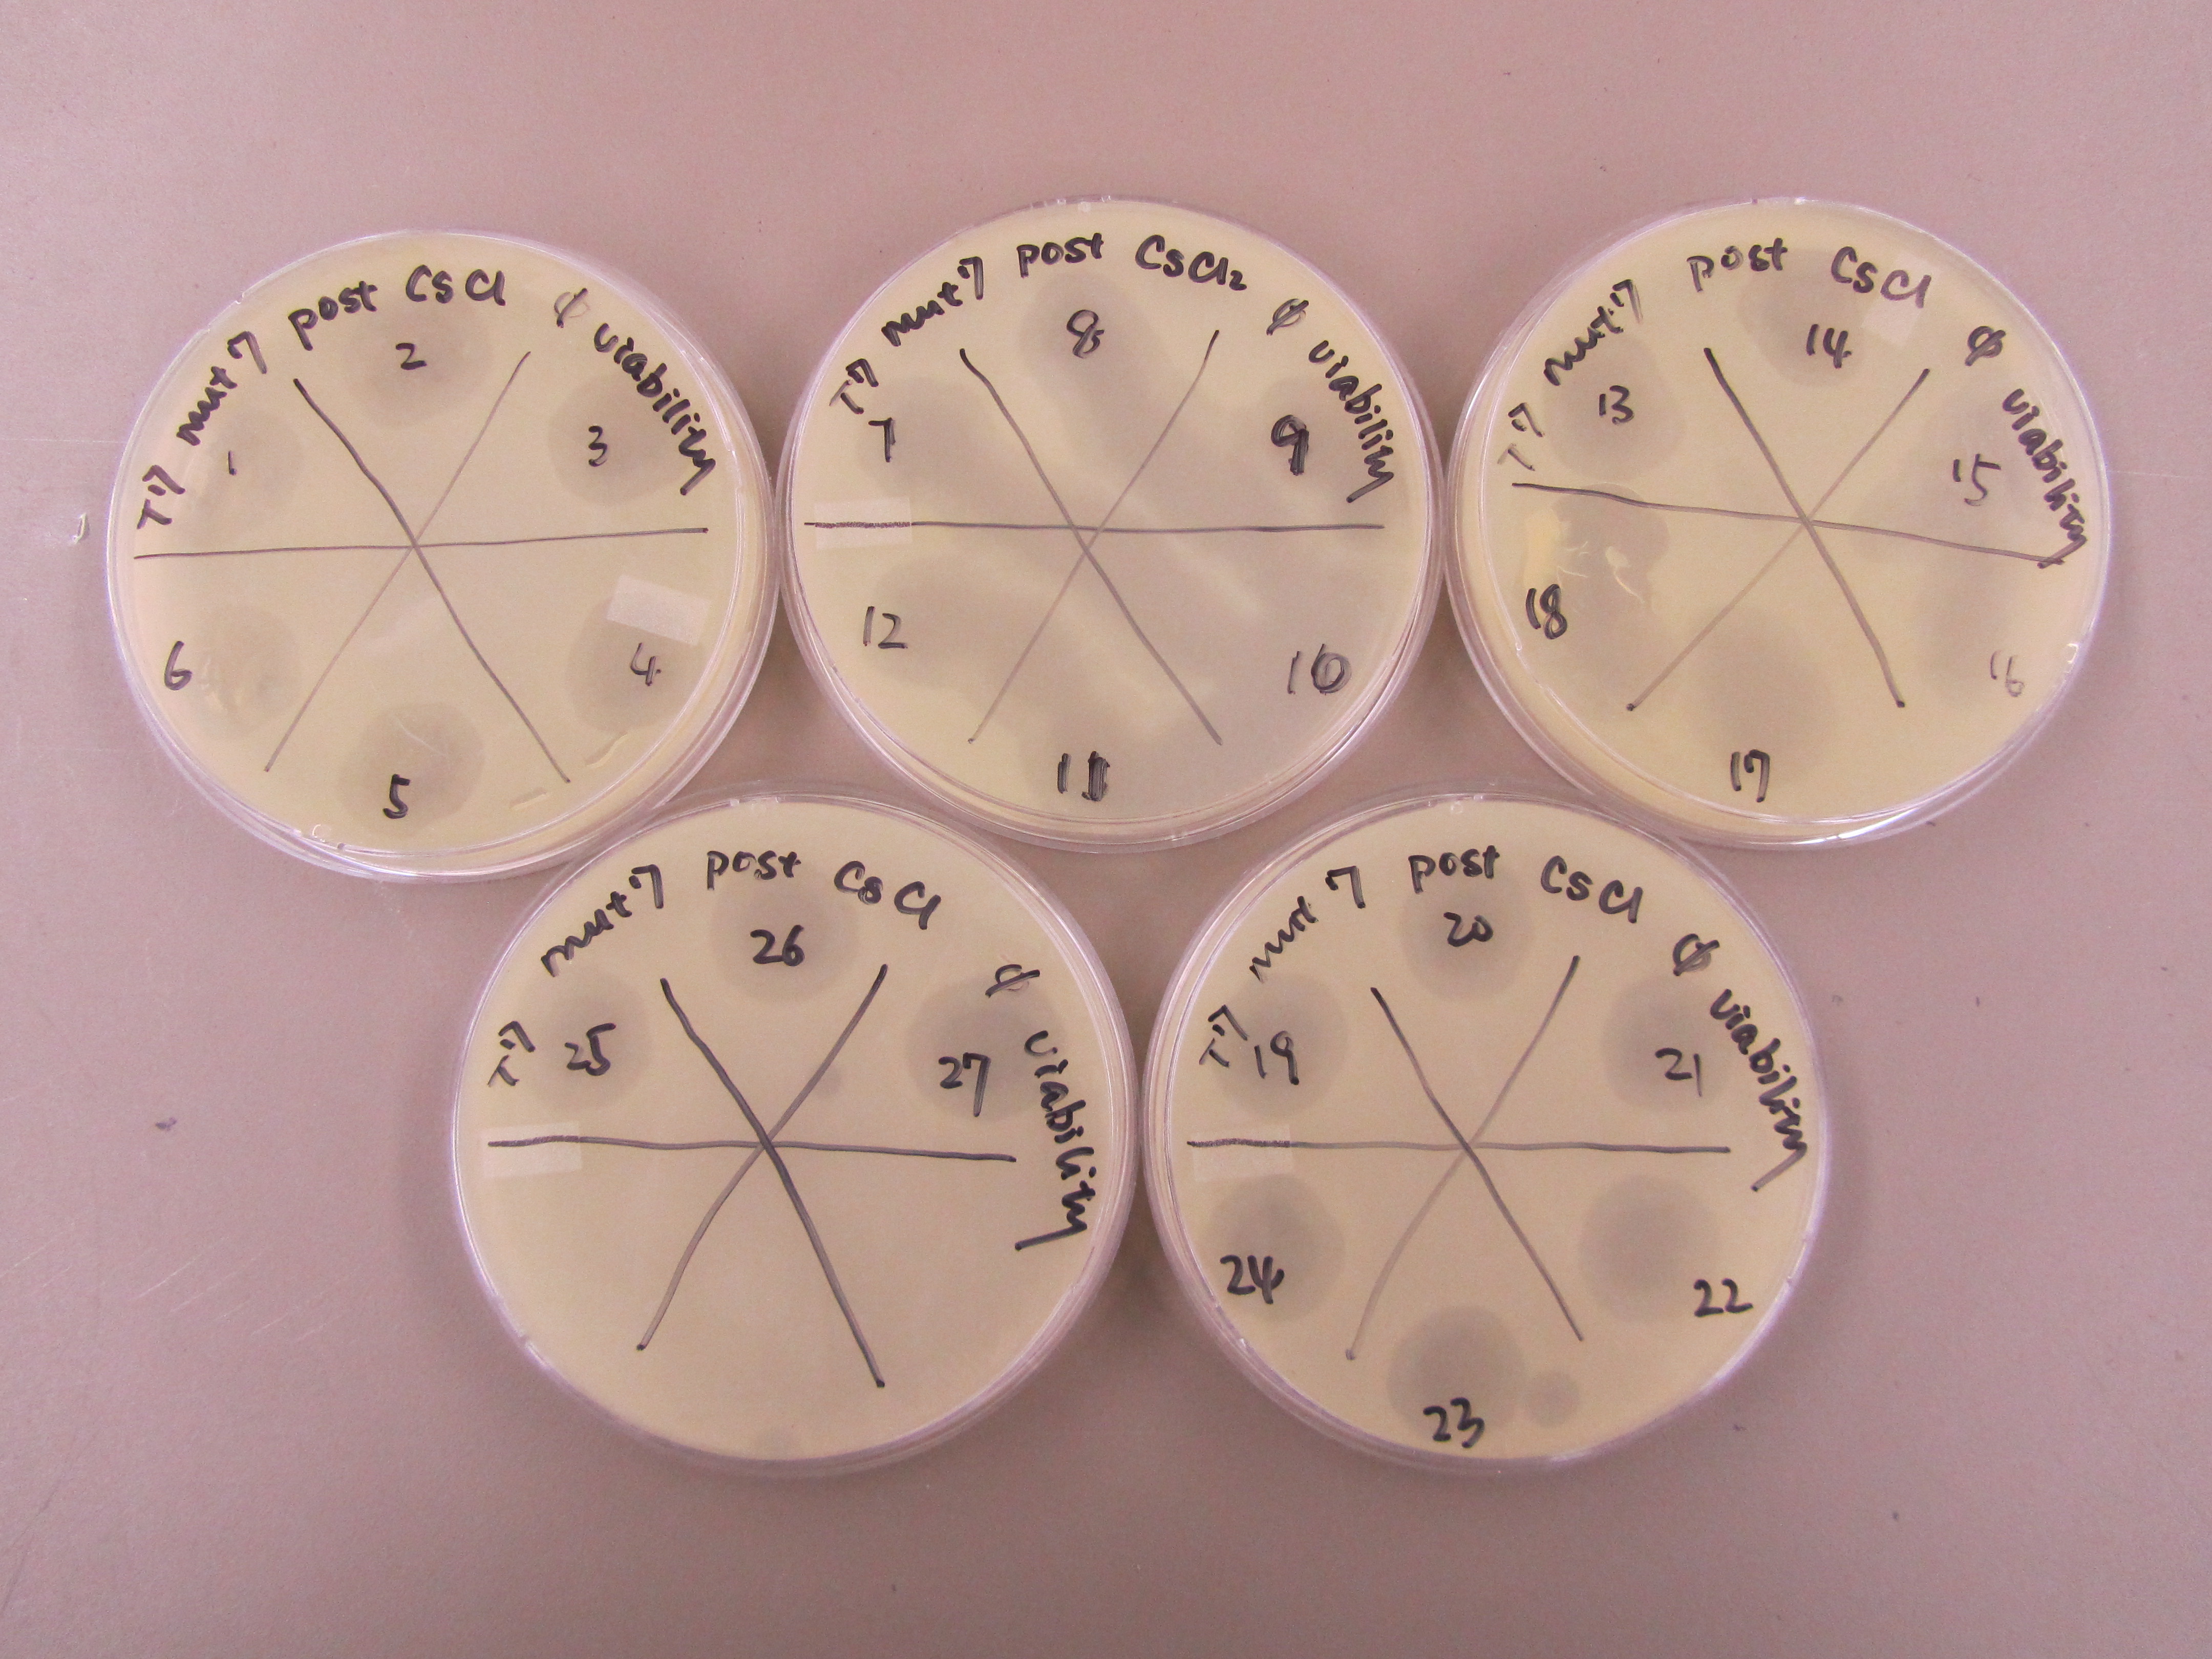
- Spot test was performed to determine which aliquots contain viable phage. Specifically, after plating 0.5mL of E coli B overnight and 5mL of x1 agar onto each plate, 10uL of each aliquot was spotted onto the plates. Plaques formation would indicate a phage concentration of at least 10E2 pfu/mL.
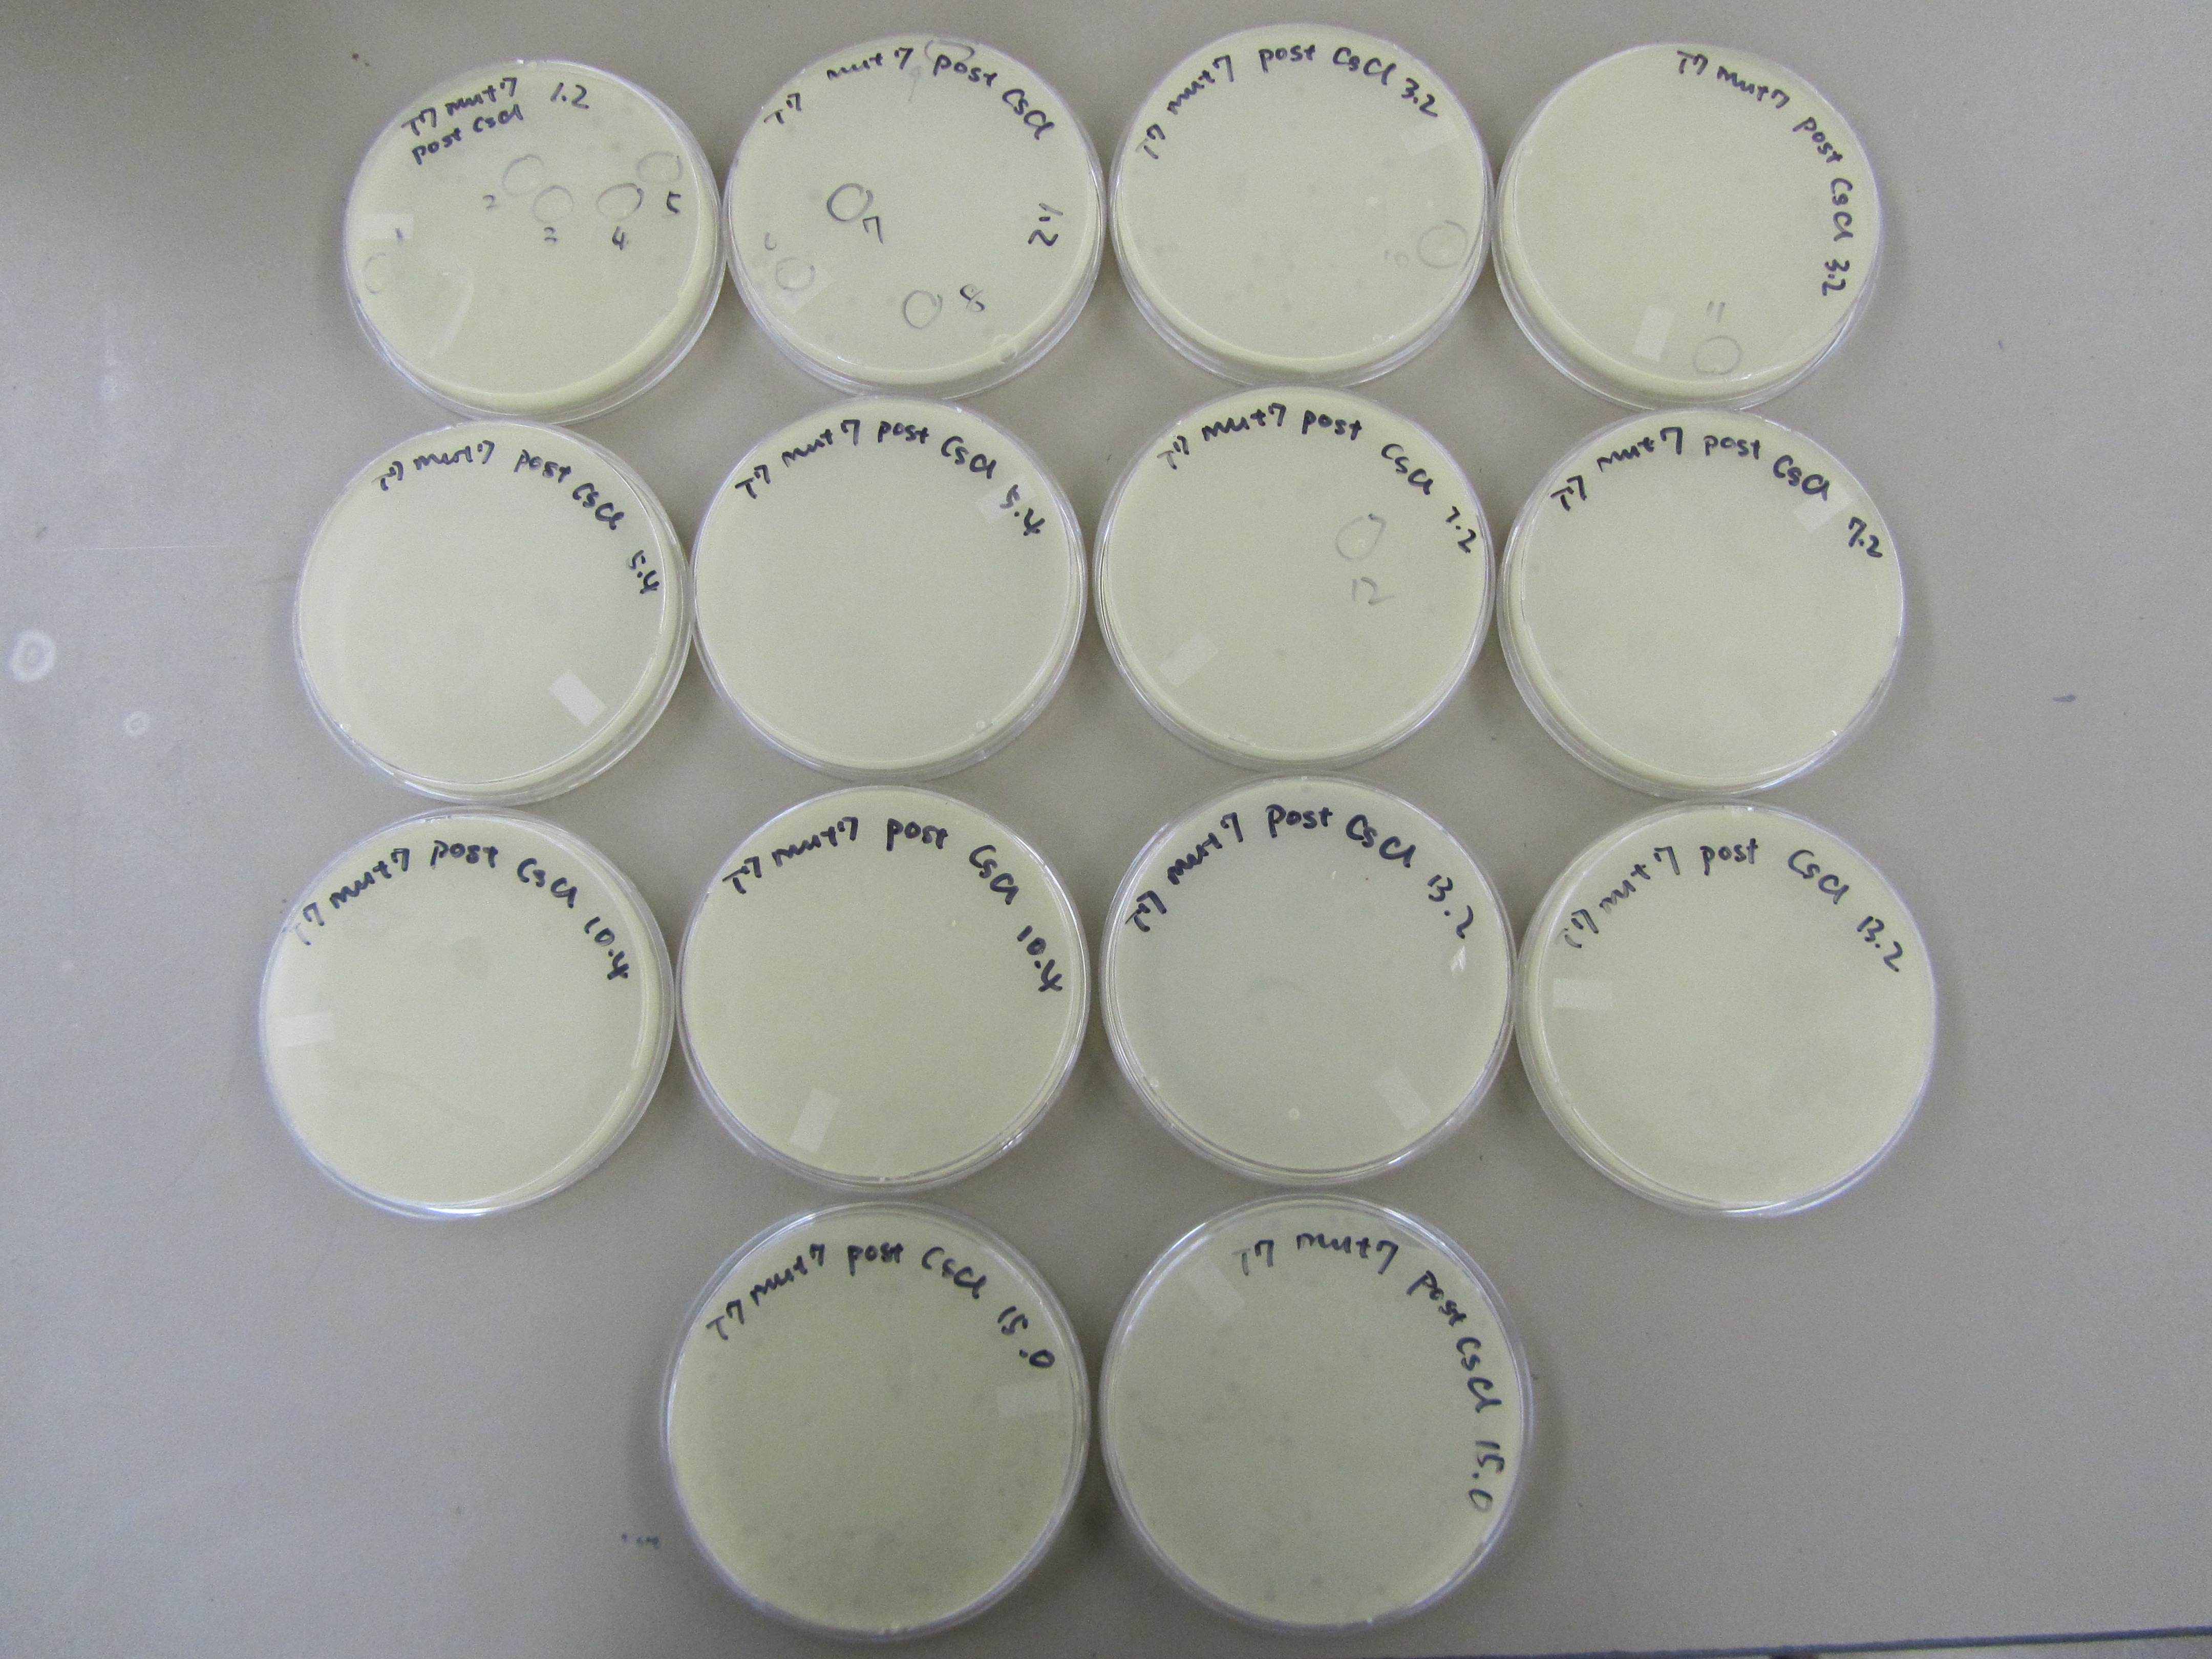
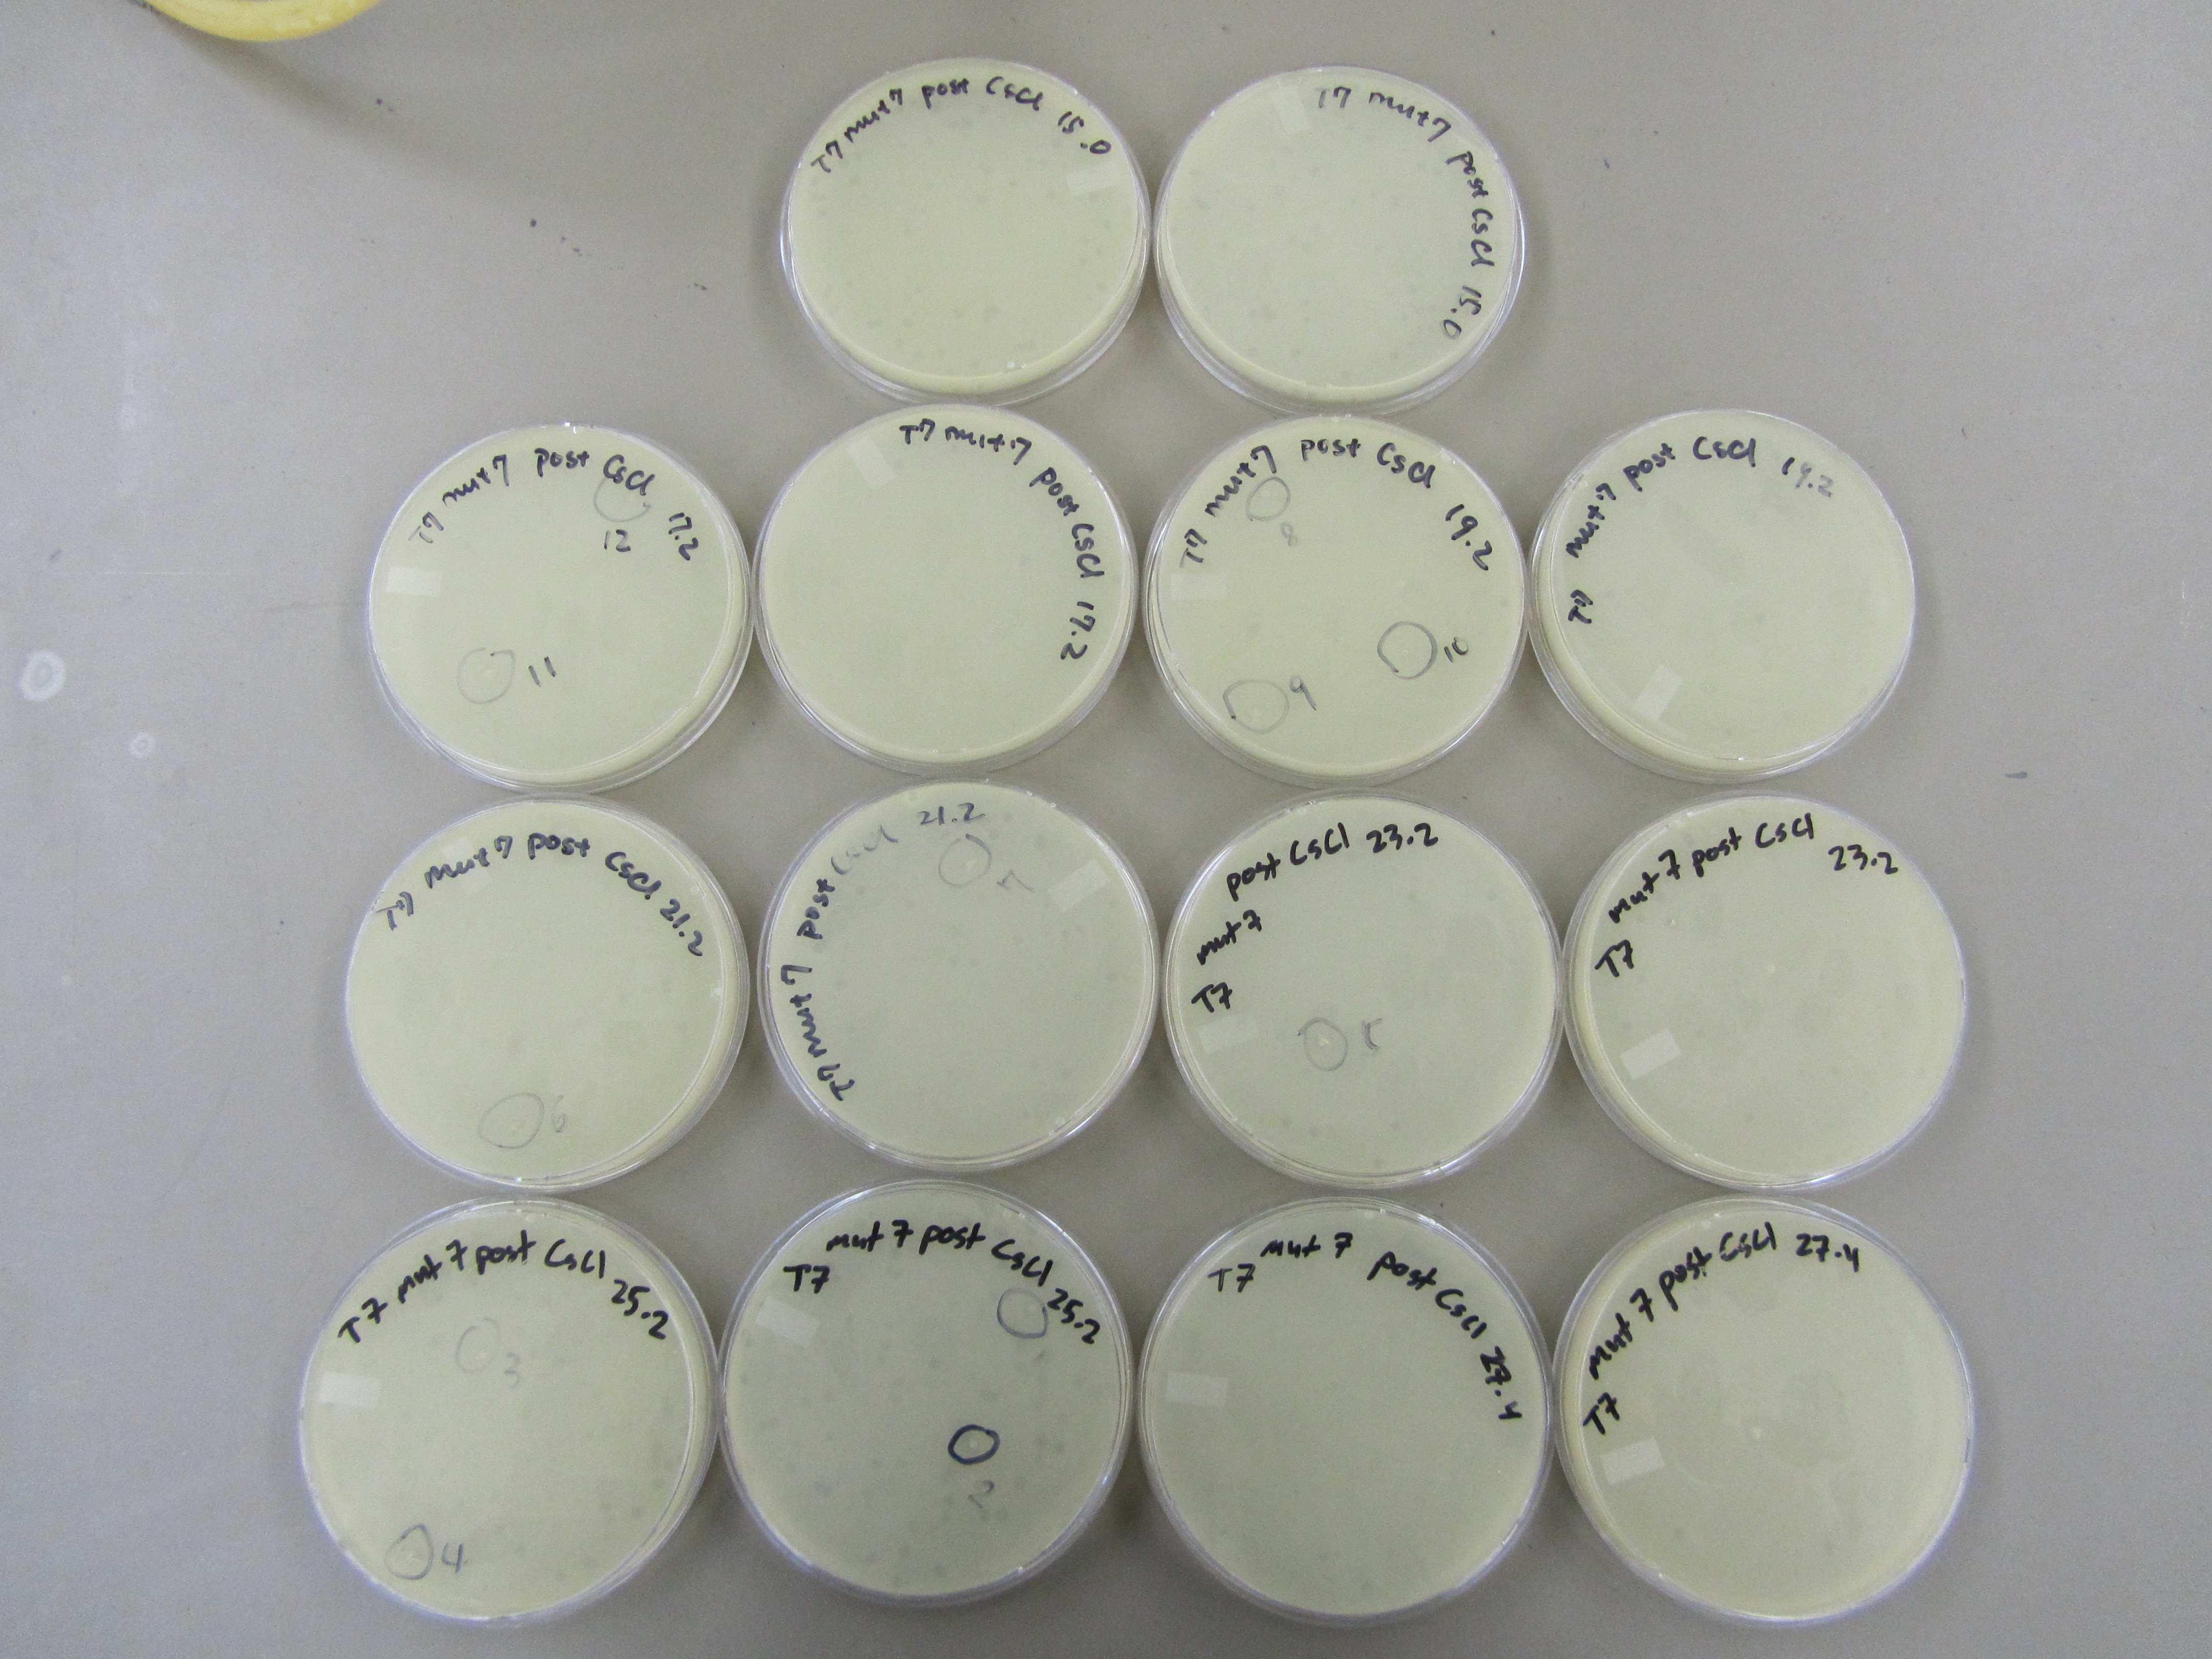
- All 27 aliquots formed plaques. Thus, further spot tests are needed to estimate the concentration of phage in each aliquot. 1:100 dilution series were performed for each aliquot to generate a -2 and -4 dilution sample for each. All dilution samples were spotted (5uL) onto plates overlaid with 0.5mL of E coli B overnight and 5mL of x1 agar.
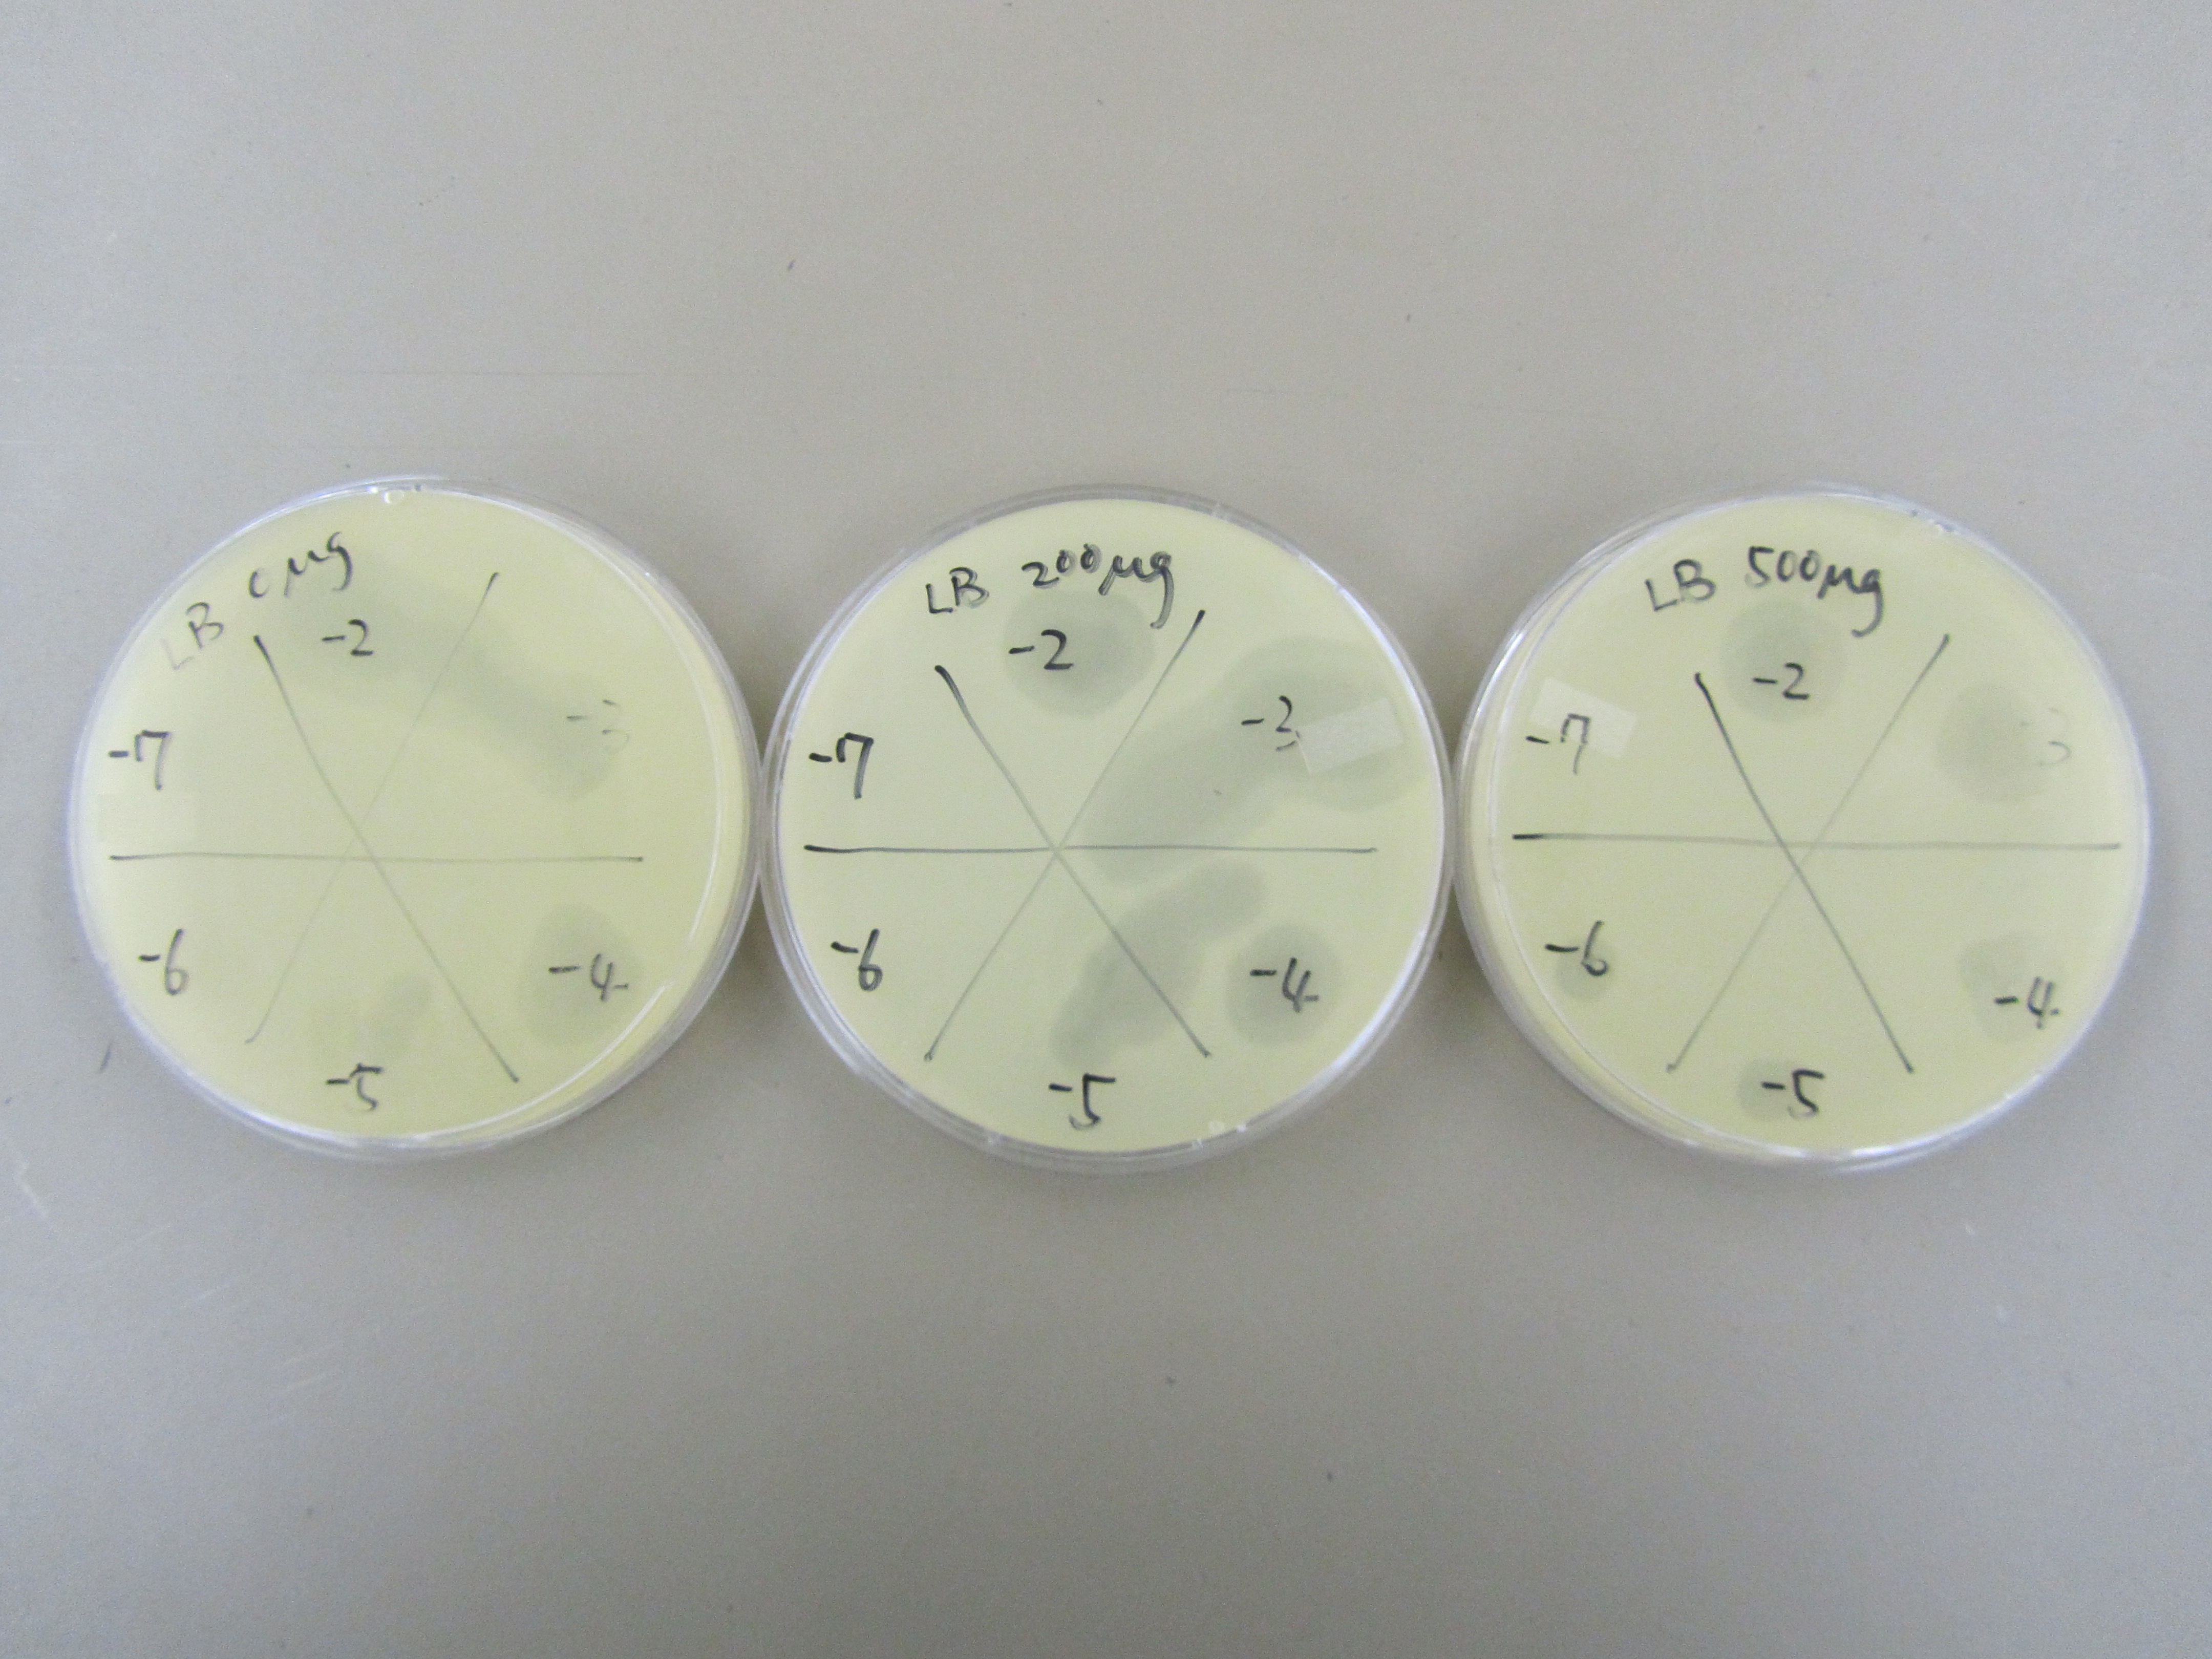
- Results from concentration spot test was superimposed on the deduced gradient. Reconstructed CsCl gradient is drawn below. 13 aliquots were selected for plating. Each aliquot was plated using the lowest dilution (-2 or -4) that showed plaque during previous concentration spot test. Specifically, 0.5mL of E coli B was infected with 50uL of phage sample for approximately 15 minutes before they were plated along with 6mL of x6 top agar.
- Variation exist on every plate. Generally, aliquots with smaller number showed the smaller plaques correlating with bigger phage that migrated to the bottom of the gradient. In contrast, aliquots with bigger number showed bigger plaques correlation with smaller phage that didn't move too far down the gradient. 12 small plaques and 12 big plaques are the respective end of the spectrum were selected (see picture below for more graphic description). Each plaque was picked with a pipet tip and dipped into 50uL of LB.
- The picked plaques were plated. Specifically, 0.5mL of E coli B was infected with 20uL of collected plaque sample (in LB) for approximately 15 minutes before they were plated along with 6 mL of x6 top agar.
V) Results
2) Applying the mutagen
- The OD reading was 0.435A, which indicates there are 2.175E8 bacteria/ml. Because there are 10ml in each tube, there is roughly 2.175E9 bacteria per tube.
3) Spot test to determine phage concentration
- 0 went down to -5; 200 went down to -5; 500 went down to -6.
5) Characterizing post-CsCl phage
- Specific descriptions of results are recorded with the procedures.
- Spot test to determine phage viability (left) and estimate their titer in each aliquot (right).
- Deduced gradient with respective estimated titer.
- Plating of selected aliquots
- Selected plaques are circled and numbered. Small plaques/big phage (S1-S12) are located on the left picture, while the big plaques/small phage (B1-B12) are located on the right picture.
VI) Conclusion
|
 "
"