 "
"
Team:HIT-Harbin/Application
From 2013.igem.org
| (5 intermediate revisions not shown) | |||
| Line 11: | Line 11: | ||
<div class="mainarea"> | <div class="mainarea"> | ||
<div class="multi-columns"> | <div class="multi-columns"> | ||
| - | <h5 class="hashed"><span> | + | <h5 class="hashed"><span>1 lactobacillus: from lactose to lactic acid</span></h5> |
| - | + | ||
| - | + | ||
| - | + | ||
| - | + | ||
| - | + | ||
| - | + | ||
| - | + | ||
| - | + | <p>Reaction 1: endocytosis transportation of lactose | |
| - | + | <p>Table 1 the definition variables | |
| - | + | ||
| - | + | ||
| - | + | ||
| - | + | ||
| - | + | <p>The unit of concentration is mmol/L. | |
| - | L+ | + | <p>LS+Lout <=> temp1 : R1(lactose combines with transporting enzyme) |
| - | + | <p>vf = k1*Lout*LS(the reaction rate is proportional to reactants’ concentrations) | |
| - | + | <p>vr =k_1*temp1(the reverse reaction rate is proportional to product’s concentration) | |
| + | <p>temp1 => L+LS : R2(lactose is transported into the cell) | ||
| + | <p>vf = k2*temp1(the reaction rate is proportional to reactants’ concentrations) | ||
| - | + | <p>Lout is known as 136mmol/L. We estimate that the time for the overall transportation of lactose into cells is 400s and assume that k1=0.1,k_1=0.05,k2=0.1,LS=5,temp1=0,L=0。Then the simulation result is as below: | |
| - | + | ||
| - | + | <img src="https://static.igem.org/mediawiki/2013/1/1d/0001.png" alt=""/> | |
| - | + | <p>Fig 1. Simulation of lactose transportation | |
| - | + | <p>We can get from the simulation that the transportation is completed when time is 300s. | |
| - | vf = | + | |
| - | + | ||
| - | + | <p>Reaction 2: from lactose to lactic acid | |
| - | + | ||
| - | + | ||
| - | gala | + | |
| - | + | <p>L+LZ <=> temp2 : R3(lactose combines with galactosidase) | |
| - | + | <p>vf = k3*L*LZ(the reaction rate is proportional to reactants’ concentrations) | |
| - | + | <p>vr = k_3*temp2(the reverse reaction rate is proportional to product’s concentration) | |
| - | + | ||
| - | + | <p>temp2 => Glu+LZ+gala : R4(lactose decomposes into glucose and galactose) | |
| - | + | <p>vf = k4*temp2(the reaction rate is proportional to reactants’ concentrations) | |
| - | + | ||
| - | Km1 | + | <p>Glu => 2*PA : R5(glucose decomposes into pyruvic acid, multi-step reaction) |
| - | + | <p>vf = k5*Glu(decomposition rate is proportional to glucose concentration) | |
| + | |||
| + | <p>PA => LA : R6(from pyruvic acid to lactic acid) | ||
| + | <p>vf = rm1*PA/(Km1+PA)(Michealis equation, the reactant is adequate) | ||
| + | <p>the simulation result is as below: | ||
| + | |||
| - | + | <p>Fig 2. Simulation of lactic acid produciton | |
| - | + | <p>We can get from the simulation that all lactose becomes lactic acid. The final concentration of lactic acid is 272 mmol/L. | |
| + | |||
| + | <p>Then we consider reaction1 and reaction2 together, the simulation result is as below: | ||
| - | + | <p>Fig 3. Considering reacton1 and 2 together | |
| - | + | <p>We can see that once lactose enters cells, it is consumed, and the transportation of lactose is faster than the production of lactic acid, which ensure that the production of lactic acid is continuing. | |
| + | <p>The cells are assumed in normal condition. | ||
| - | + | <p>Now we are going to analyze the pH switching function f(p)=1-tanh(n*(p-p*)). The curve of f(x)=1-tanh(x) is as below: | |
| - | f(x)=1-tanh(x) | + | |
| - | + | <p>Fig 4. Curve of f(x)=1-tanh(x) | |
| - | + | ||
| - | f(x)=1-tanh(30*x) | + | <p>When x=1, f(x) is nearly 0, the switch is off. That is, when n=1, the difference between pH in cell and pH threshold should be smaller than 1 that the switch can be on. |
| + | |||
| + | <p>The curve of f(x)=1-tanh(30*x) is as below: | ||
| - | + | <p>Fig 5. Curve of f(x)=1-tanh(30*x) | |
| - | + | <p>When x=0.1, f(x) is nearly 0, the switch is off. That is, when n=30, the difference between pH in cell and pH threshold should be smaller than 0.1 that the switch can be on. | |
| + | |||
| + | <p>Besides, we get the relationship between pH and lactic acid concentration from experiments: | ||
| + | <p>pH=6.32311-0.02168*[LA]+0.0000426042*[LA]^2(0<[LA]<250) | ||
| + | <p>its curve is as below: | ||
| - | + | <p>Fig 5. Relationship between pH and lactic acid concentration | |
| - | + | <p>In experiments, the maximum of pH is 6.3, the minimum is 3.6. We assume that the threshold of pH is 5.5. | |
| - | + | ||
| - | + | ||
| - | + | ||
| - | + | ||
| - | + | <h5 class="hashed"><span>2 the expression of LacR through pH-induced promoter</span></h5> | |
| - | + | ||
| - | => | + | <p>=> LA |
| - | vf = | + | <p>vf = 0 |
| + | <p>=> mRNA1 | ||
| + | <p>vf = v0+v1*f(LA)-dm1*mRNA1 | ||
| - | => | + | <p>=> LR |
| - | vf = | + | <p>vf = km*mRNA1-dn1*LR |
| - | => | + | <p>=> mRNA2 |
| - | vf = | + | <p>vf = vm-dm2*mRNA2-c*a*LR/(1+a*LR) |
| - | + | ||
| - | + | <p>=> LS | |
| - | LR | + | <p>vf = ks*mRNA2-ds*LS |
| - | + | ||
| - | + | <p>=> LZ | |
| - | + | <p>vf = kz*mRNA2-dz*LZ | |
| - | mRNA2 | + | |
| - | + | <p>Table 3 the value of variables | |
| - | + | ||
| - | + | ||
| - | + | <p>the simulation result is as below: | |
| - | + | ||
| - | + | ||
| - | + | ||
| - | + | ||
| - | + | ||
| - | + | ||
| - | + | ||
| - | + | ||
| - | + | ||
| - | + | ||
| - | + | <p>Fig 6. Simulation of pH induction | |
| - | + | <p>Form the figure we can see that in 20s (far from 400s) the concentration of transporting enzyme and galactosidase is very small, which means the inhibition resulted from pH induction is transitory for production of lactic acid. In other word, the inhibition can respond to the fast change of pH. | |
| - | + | ||
| + | <p>Finally, we put pH induction and lactic acid production together. | ||
| + | <p>When n=1, the simulation is as below: | ||
| - | + | <p>Fig 7. Taking pH induction and lactic acid production together (n=1) | |
| - | + | <p>We can see that the concentration of lactic acid doesn’t decline but only slow down (the inhibition). Time to achieve platform phase increases to 800s. | |
| - | + | ||
| - | + | ||
| - | + | ||
| - | + | ||
| - | + | ||
| + | <p>When n=30, the simulation is as below: | ||
| - | + | <p>Fig 8. Taking pH induction and lactic acid production together (n=30) | |
| - | + | ||
| - | + | <p>The time to achieve platform phase decreases to 100s. | |
| + | |||
| + | |||
Latest revision as of 04:14, 28 September 2013
Application
1 lactobacillus: from lactose to lactic acid
Reaction 1: endocytosis transportation of lactose
Table 1 the definition variables
The unit of concentration is mmol/L.
LS+Lout <=> temp1 : R1(lactose combines with transporting enzyme)
vf = k1*Lout*LS(the reaction rate is proportional to reactants’ concentrations)
vr =k_1*temp1(the reverse reaction rate is proportional to product’s concentration)
temp1 => L+LS : R2(lactose is transported into the cell)
vf = k2*temp1(the reaction rate is proportional to reactants’ concentrations)
Lout is known as 136mmol/L. We estimate that the time for the overall transportation of lactose into cells is 400s and assume that k1=0.1,k_1=0.05,k2=0.1,LS=5,temp1=0,L=0。Then the simulation result is as below:
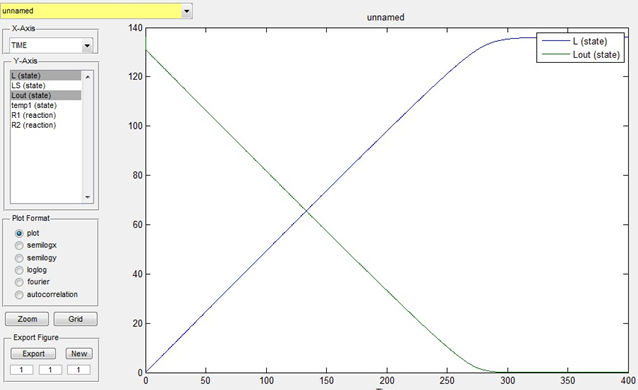
Fig 1. Simulation of lactose transportation
We can get from the simulation that the transportation is completed when time is 300s.
Reaction 2: from lactose to lactic acid
L+LZ <=> temp2 : R3(lactose combines with galactosidase)
vf = k3*L*LZ(the reaction rate is proportional to reactants’ concentrations)
vr = k_3*temp2(the reverse reaction rate is proportional to product’s concentration)
temp2 => Glu+LZ+gala : R4(lactose decomposes into glucose and galactose)
vf = k4*temp2(the reaction rate is proportional to reactants’ concentrations)
Glu => 2*PA : R5(glucose decomposes into pyruvic acid, multi-step reaction)
vf = k5*Glu(decomposition rate is proportional to glucose concentration)
PA => LA : R6(from pyruvic acid to lactic acid)
vf = rm1*PA/(Km1+PA)(Michealis equation, the reactant is adequate)
the simulation result is as below:
Fig 2. Simulation of lactic acid produciton
We can get from the simulation that all lactose becomes lactic acid. The final concentration of lactic acid is 272 mmol/L.
Then we consider reaction1 and reaction2 together, the simulation result is as below:
Fig 3. Considering reacton1 and 2 together
We can see that once lactose enters cells, it is consumed, and the transportation of lactose is faster than the production of lactic acid, which ensure that the production of lactic acid is continuing.
The cells are assumed in normal condition.
Now we are going to analyze the pH switching function f(p)=1-tanh(n*(p-p*)). The curve of f(x)=1-tanh(x) is as below:
Fig 4. Curve of f(x)=1-tanh(x)
When x=1, f(x) is nearly 0, the switch is off. That is, when n=1, the difference between pH in cell and pH threshold should be smaller than 1 that the switch can be on.
The curve of f(x)=1-tanh(30*x) is as below:
Fig 5. Curve of f(x)=1-tanh(30*x)
When x=0.1, f(x) is nearly 0, the switch is off. That is, when n=30, the difference between pH in cell and pH threshold should be smaller than 0.1 that the switch can be on.
Besides, we get the relationship between pH and lactic acid concentration from experiments:
pH=6.32311-0.02168*[LA]+0.0000426042*[LA]^2(0<[LA]<250)
its curve is as below:
Fig 5. Relationship between pH and lactic acid concentration
In experiments, the maximum of pH is 6.3, the minimum is 3.6. We assume that the threshold of pH is 5.5.
2 the expression of LacR through pH-induced promoter
=> LA
vf = 0
=> mRNA1
vf = v0+v1*f(LA)-dm1*mRNA1
=> LR
vf = km*mRNA1-dn1*LR
=> mRNA2
vf = vm-dm2*mRNA2-c*a*LR/(1+a*LR)
=> LS
vf = ks*mRNA2-ds*LS
=> LZ
vf = kz*mRNA2-dz*LZ
Table 3 the value of variables
the simulation result is as below:
Fig 6. Simulation of pH induction
Form the figure we can see that in 20s (far from 400s) the concentration of transporting enzyme and galactosidase is very small, which means the inhibition resulted from pH induction is transitory for production of lactic acid. In other word, the inhibition can respond to the fast change of pH.
Finally, we put pH induction and lactic acid production together.
When n=1, the simulation is as below:
Fig 7. Taking pH induction and lactic acid production together (n=1)
We can see that the concentration of lactic acid doesn’t decline but only slow down (the inhibition). Time to achieve platform phase increases to 800s.
When n=30, the simulation is as below:
Fig 8. Taking pH induction and lactic acid production together (n=30)
The time to achieve platform phase decreases to 100s.