 "
"
Team:Imperial College/BioPlastic Recycling: PHB
From 2013.igem.org
| Line 86: | Line 86: | ||
<div class="TabbedPanelsContent"> | <div class="TabbedPanelsContent"> | ||
<div id="CollapsiblePanelMod1" class="CollapsiblePanel"> | <div id="CollapsiblePanelMod1" class="CollapsiblePanel"> | ||
| - | <div class="CollapsiblePanelTab" tabindex="0"><h3> | + | <div class="CollapsiblePanelTab" tabindex="0"><h3>P(3HB) Degradation Model</html><font size="1">▼</font size="1"><html></h3></div> |
| - | <div class="CollapsiblePanelContent"></html> | + | <div class="CollapsiblePanelContent"> |
| + | |||
| + | Content | ||
| + | </div> | ||
| + | </div> | ||
| + | |||
| + | |||
| + | |||
| + | <div id="CollapsiblePanelMod2" class="CollapsiblePanel"> | ||
| + | <div class="CollapsiblePanelTab" tabindex="0"><h3>PLA Degradation Model</html><font size="1">▼</font size="1"><html></h3></div> | ||
| + | <div class="CollapsiblePanelContent"> | ||
| + | </html> | ||
<h2>Introduction</h2> | <h2>Introduction</h2> | ||
<p align="justify"> | <p align="justify"> | ||
| Line 284: | Line 295: | ||
[[File:PLAD.png]] | [[File:PLAD.png]] | ||
<p>The simulation result shows a fast degradation of that large amount of polylactic acid by proteinase K. 40mM of the plastic can be completely degraded in 6 minutes. The reason for fast degradation is that we have relative large kinetic parameters for the enzyme. Polylactic acid was not used as the substrate in our kinetic assays. Therefore, we made an assumption that polylactic acid in the model has similar length of chain as that of the substrate in the assays. </p> | <p>The simulation result shows a fast degradation of that large amount of polylactic acid by proteinase K. 40mM of the plastic can be completely degraded in 6 minutes. The reason for fast degradation is that we have relative large kinetic parameters for the enzyme. Polylactic acid was not used as the substrate in our kinetic assays. Therefore, we made an assumption that polylactic acid in the model has similar length of chain as that of the substrate in the assays. </p> | ||
| - | |||
| - | |||
| - | |||
| - | |||
| - | |||
| - | |||
| - | |||
| - | |||
| - | |||
| - | |||
| - | |||
| - | |||
<html> | <html> | ||
</div> | </div> | ||
Revision as of 13:53, 4 October 2013


Module 2: Plastic Fantastic

Plastic Fantastic is a complete P(3HB) bioplastic recycling platform, where P(3HB) is degraded into monomeric form and then re-polymerised back into de novo P(3HB) for future applications.
Overview
Specifications
Design
Modelling
Testing & results
Future work
Overview

We are developing a system by which PHB can be recycled when products made from it come to the end of their life. In in order to do this, we have engineered E.coli to break down P3HB extracellularly to release the monomers of 3-hydroxybutyrate (3-HB). E.coli in a different bioreactor will then use the 3-HB as their carbon source for the reproduction of P3HB. We have thoroughly characterised the phaZ1 PHB depolimerase enzyme and demonstrated that it degrades PHB in various experiments. Our models predict that use of the enzyme on a bioreactor scale will be effective in degrading bioplastic on an industrial or local scale. For the adjustment of the PHB synthesis pathway, we designed a metabolic pathway where a permease will take up 3HB and the bdh2 dehydrogenase enzyme will convert it to acetoacetate, which can be then used for PHB synthesis.
We are also establishing a second bioplastic recycling platform for polylactic acid (PLA)
This aspect of our module is in collaboration with the Yale iGEM team
Specification
Degradation of P(3HB)
Our bacteria should be resist any toxic effects that are associated with P(3HB) or 3HB
Our bacteria should degrade (P3HB)
Synthesis of P(3HB)
Our bacteria should take up and internalise 3HB from the surrounding media
Our bacteria should be able to utilise P(3HB) as a sole carbon source
P(3HB) Degradation: Pathway
The phaZ1 enzyme from Ralstonia eutropha can break down PHB. This bacterium uses PHB as storage molecule and expresses PhaZ1 when it needs to mobilise the nutrients from the polymer inside the cell. In our system, the enzyme will be secreted.</p>

P(3HB) Degradation: Biobrick design
BBa_K1149010: Extracellular expression of phaZ1, PHB depolymerase enzyme. It is regulated by a strong xylose the inducible promoter BBa_I741018 and we are using the RBS 0034. For extracellular secretion, we fused pelB secretion tag BBa_J32015 to the N terminus of the protein.

Synthesis of P(3HB) from 3HB: Pathway
3HB Permease: We designed a biobrick for the expression of a Putative permease identified from the literature [1] for 3HB inport. We optimised the sequence for E.coli and planned experiments with the construct. However, the gene synthesis was delayed and we did not get to the stage of characterizing and submitting the part.

Synthesis of P(3HB) from 3HB: Biobrick design
Construct for bdh2 dehydrogenase expression
BBa_K1149050: Intracellular expression of bdh2, 3HB dehydrogenase enzyme . We have used a strong arabinose inducible promoter BBa_K206000 in front of the operon for controlled expression of the enzyme since the enzyme is only necessairy for the cell if 3HB is present. We have included superfolder GFP BBa_K515005 in operon with phaZ1 so that we can monitor gene expression from the promoter via fluorescence measurements. (see our corresponding data under results)


Safety
Bacteria strains
We used E. coli K-12 strains MG1655, NEB 10 beta, NEB 5 alpha and TOP10 (similar to E. coli K-12 DH 10 beta that fall under Risk Group 1 for the experiments, but eventually only MG1655 strain will be used in the bioreactors. This strain is shown rarely survives outside labs, although minor symptoms may show if infected. Meanwhile, the parts we designed are specialised for degrading PUR and they are not expected to harm human health.
Bioreactor safety
We have come up with a few strategies to prevent release of our bacteria into the environment. Firstly, the bioreactor containing bacteria will have a kill switch that kills bacteria if the bioreactor is opened when operating. Secondly, we lyse the cells at the end of reactions to harvest our product. This also ensures living bacteria will not be released unexpectedly.
P(3HB) Degradation Model▼
PLA Degradation Model▼
Introduction
The efficiency of Polylactic acid is important for the performance of MAPLE. Therefore, we chose a strong enzyme Proteinase K which is suggested by many literature as an efficient PLA degrading enzyme. We performed several assays in order to determine the kinetic properties of Proteinase K. The PLA degradation model was then built based on the experimental results.
Objective and Design
1. With the defined kinetic properties of Proteinase K. The model can predict the time needed to degrade a certain amount of PLA. The information is important as it estimates the efficiency of the MAPLE system when degrading the large amount of plastic.Therefore, further improvements can be made if the system is not efficient.
2. The model also involves the gene expression model of the Proteinase K with an inducible promoter. Therefore, gene expression can be regulated by adjusting the inducer concentration. The overall plastic degradation can be regulated by the gene expression.
3. The secretion model is also contained in the model which assumes the efficiency of enzyme secretion to the culture.
Specifications of the model
Polylactic acid (PLA) degradation involves proteinase K:
| enzyme | source organism | biobrick | reference |
|---|---|---|---|
| Proteinase K | Engyodontium album | BBa_K1149002 | [2] |
The overall PLA degradation model is shown as below:

There are two compartments which represents cells and the culture from left to right. The "cell" compartment contains the gene expression module whereas the "culture" compartment contains the degradation module. The "secretion" block that connects two compartments is the secretion module.
Parameters and assumptions
Gene expression module of Proteinase K
| Parameter | Description | Value | Units | Sources | Assumptions |
|---|---|---|---|---|---|
| β | maximum rate of transcription | 0.020 | mM/min | Please see derivation 1 below. | Please see derivation 1 below. |
| K | Activation coefficient | 0.0031 | mM | [3] | Taking the "switch point" as the activation coefficient |
| dmRNA | mRNA degradation rate | 0.10 | 1/min | [4] | Taking the value of mRNA half-life in E.coli strain MG1655 as 6.8min. rate = ln2/half-life = ln2/6.8 = 0.10 |
| dprotein | Protein degradation rate | 0.050 | 1/min | [5] | There is no active degradation pathway and that dilution is the dominant way by which the protein level decreases in a cell. Rate = 1/doubling time, where doubling time = 20min. Assuming steady-state growth in LB broth as presented in paper. |
| k2 | Protein production rate (Proteinase K) | 3.0 | 1/min | Please see derivation 2 below. | Please see derivation 2 below. |
| [Arabinose] | Concentration of arabinose | Initial: 0.008 | mM | ||
| [mRNA] | Concentration of mRNA | - | mM | - | - |
| [Proteinase K] | Concentration of Proteinase K | - | mM | - | - |
1.Derivation of the maximal expression rate,β
- Average molecular weight (Mw) of a base pair = 660g/mol[6][7]
- Average mass of a base pair = 660g/mol x 1.66x10-24 = 1.1x10⁻²¹g
- Volume of an E.coli cell = 1µm3[8] = 1x10-15L
- ∴Mass concentration =
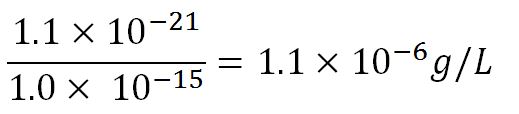
- ∴Molar concentration of 1 base pair in the volume of E.coli =
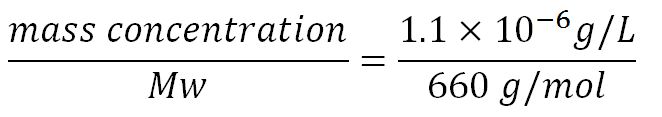 = 1.66x10⁻⁶ mM
- ∴Mass concentration =
- BioBrick assembly plasmid pSB1C3 is a high copy number plasmid (100-300 copies per cell)[9]
- assume 200 copies per cell
- ∴ concentration of the gene per cell = N x 200 x 1.66x10-6mM, where N = number of base pairs
- ∴ concentration of the gene proteinase K (N = 1194) in the volume of an E.coli cell is = 0.40mM
- Transcription rate in E.coli = 80bp/s[10] = 80 x 1.66x10-6mM/s = 80 x 1.66x10-6 x 60mM/min = 7.97x10⁻³mM/min
- ∴ Rate of mRNA_Proteinase K production under the control of pBAD = 7.97x10⁻³ ÷ 0.40 = 0.020/min

- Average molecular weight(Mw) of an amino acid(aa)= 110g/mol[11][12]
- Average mass of an amino acid = 110g/mol x 1.66x10-24=1.83x10⁻²²g/L
- ∴Mass concentration of one aa in the volume of an E.coli =
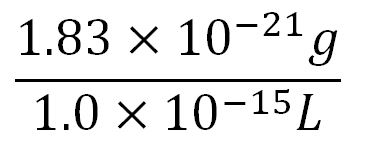 = 1.83x10⁻⁶g/L
- ∴Molar concentration of one aa =
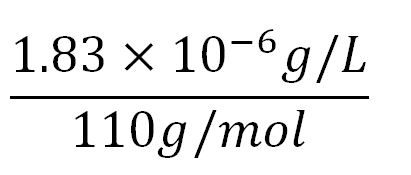 = 1.66x10⁻⁵mM
- ∴Mass concentration of one aa in the volume of an E.coli =
- Translation rate = 20aa/s = (20 x 1.66x10-5 x 60)mM/min = 0.020mM/min
- Proteinase K comprises of 398aa[13]
- ∴concentration of Proteinase K's aa in the volume of an E.coli = 1.66x10-5mM x 398 = 6.61x10⁻³mM
- ∴ Rate of protein production = 0.020 ÷ 4.25x10-3 = 3.0/min


Degradation
The reaction equation of the PLA degradation is:
[Polylactic acid]+[Proteinase K]= 660 [lactic acid] + [Proteinase K]
Assumptions:
We assumed 1 mole of polylactic acid can produce 660 moles of lactic acid.
The molecular weight of a single polylactic acid monomer is 90 g/mol [14]whereas the molecular weight of the solid polylactic acid is around 59500 g/mol.[15]Therefore, the short-chain polylactic acid consists approximately 660 monomers. 660 molecules of lactic acid will be produced by degrading one chain of polymer.
We also assumed a simple Michaelis-Menten mechanism for proteinase K

"[Proteinase K]" here is the concentration of the enzyme Proteinase K in mM, whereas "[Polylactic acid]" represents the concentration of polylactic acid in mM as well.
The parameters for the kinetic equations are:
| Parameter | Description | Value | Units | Sources |
|---|---|---|---|---|
| Km | Michaelis constant | 0.032 | mM | - |
| Vmax | Maximum velocity | 2.472 | mM/min | - |
| Proteinase K | Concentration of the enzyme in assays | 30 | mg/L | - |
| Kcat | turnover number | 2348.4 | 1/min | See derivation below |
| Mw | Molecular weight of proteinase K | 28.5 | KDa | [16] |
Derivation:Turnover number (Kcat) = Vmax*Mw/[proteinase K] = 2348.4
The efficiency of Secretion is assumed to be 90% secretion over 2 hours.[17] The rate of secretion in the model is therefore:
rate of secretion = 0.9[concentration of Proteinase K]/120 (mM/mins)
Simulations and Results
The initial concentration of Polylactic acid is 40mM, which can be converted to 2380g/L. The derivation is: 40*59500/1000 = 2380g/L. There is approximately 2kg of polylactic acid in the 1 litre bioreactor. It's a really large amount of plastic, the simulation result is:

The simulation result shows a fast degradation of that large amount of polylactic acid by proteinase K. 40mM of the plastic can be completely degraded in 6 minutes. The reason for fast degradation is that we have relative large kinetic parameters for the enzyme. Polylactic acid was not used as the substrate in our kinetic assays. Therefore, we made an assumption that polylactic acid in the model has similar length of chain as that of the substrate in the assays.
Our chassis can grow with P(3HB) and 3HB▼
Summary
Our chassis can grow and survive in reasonable concentrations of P(3HB) and 3HB. To increase tolerance to 3HB we have re-designed our system to include expression of Bdh2 (BBa_K1149050, 3HB dehydrogenase), which breaks down 3HB to acetoacetate. Acetoacetate toxicity was examined and these data are being utilised along with our metabolic models to determine the effects of differing levels of 3HB and acetoacetate on bioplastic (P3HB) production.
MG1655 transformed with either native phaCAB or empty vector (control) plasmid were grown for 6h in LB containing 3-HB or P-3HB to assess any potential toxicities associated with these bioplasrics.
3-hydroxybutyrate (3HB)

Poly(3-hydroxybutyrate) P(3HB)

Conclusion:3HB is toxic above 10mM and P(3HB) had no effect on growth at 31 μg/L. These data can be utilised to determine the maximum level of 3HB which should be present in our final bioreactor design. We have shared these data with our modelling team in order to determine maximum P(3HB) production at or below 10mM (3HB). In light of these data we have modified our design to include the expression of bdh2 (BBa_K1149050)</b>, which is a 3HB dehydrogenase that can convert 3HB into acetoacetate, a common metabolite in E.coli. Expression of bdh2 should overcome the toxicity limit of 3HB, since E. coli can metabolise acetoacetate</b>To this end we tested whether an increase in acetoacetate would present any toxicities.
Acetoacetate

Conclusion:Acetoacetate toxicity lies somewhere between 1mM and 287 mM.
Bioplastic degradation: Phaz1 enzymatic assays▼
Enzyme activity of PHB depolymerase (phaz1)
It can be seen from the Western Blot results that phaz1 BBa_K1149010 was being expressed. To show that this enzyme has esterase activity, colourimetric assays were performed using the substrate analog para-Nitrophenyl butyrate. When the ester bond in this substrate is cleaved, 4-Nitrophenol is released. This is accompanied by an increase in absorbance at the wavelength 405 nm and a colour change from colourless to yellow. The concentration of 4-Nitrophenol produced could then be calculated with the Beer-Lambert Law, as the extinction coefficient of 4-NP at 405 nm is 18,000 M-1 cm-1. This experiment was performed with both the crude cell lysate and purified PHB depolymerase. Our data shows that this enzyme is definitely active.


Cell lysate assay
After 48 hours of growing and inducing the phaz1 culture, the cells were lysed by probe-sonication, spun down and resuspended in 50mM Tris-HCl buffer. A reaction mixture containing 5 µL of crude phaz1 lysate, 4 µL of para-Nitrophenyl butyrate solution and 1 mL of 50 mM Tris-HCl pH 7.4 buffer was incubated in the Eppendorf BioSpectrometer for 570 seconds, whilst the absorbance at 405 nm was automatically recorded every 30 seconds.


The above graph shows that greater esterase activity occurs when the phaz1 cell lysate is in the reaction mixture. The graph shows that there is also esterase activity occuring in the Empty Vector and Substrate alone reaction mixtures, but this is due to the imidazole present in the Tris-HCl buffer, which acts as a general base catalysis. (6)
Purified enzyme assay
Since the phaz1 BBa_K1149010 construct contains a His tag, the protein could be purified by metal affinity chromatography. The colourimetric assay was carried out, as with the cell lysate. 100 mM potassium phosphate (pH 7.4) buffer was used instead of the Tris-HCl buffer, to eliminate the esterase activity caused by imidazole in the buffer used previously. Every 30 seconds for 30 minutes the absorbance at 405 nm of the reaction mixture was recorded. The reaction mixture contained 1 ml of phosphate buffer, 2.5 µL of purified PHB depolyermase (stock concentration 0.230 mg/ml) and para-Nitrophenyl butyrate to make final concentrations of 50 µM, 100 µM, 150 µM, 200 µM and 250 µM of substrate.

The above graph shows how the concentration of 4-Nitrophenol produced is greater when the para-Nitrophenyl butyrate substrate concentration is greater. This data shows that we have successfully purified active PHB depolyermase.

Bioplastic degradation: Phaz1 degrades P(3HB)▼
Clearing Zone Assay
Clearing zone experiment was conducted to semi-quantitatively test the ability of PhaZ1 to break down P3HB. PhaZ1 cell lysate was tested on a P3HB LB agar plate. The protocol can be found here.
We can degrade the PHB made by our own bacteria
In the below experiments we show that:
The phaZ1 PHB depolimerase enzyme that we expressed and purified from E.coli is functional.
The white and grey "stuff" that we purified in various experiments is Poly-Hydroxy-Butyrate bioplastc.
The grey sample was purified from waste, therefore we made PHB bioplastic from waste.
We can close the loop and degrade our own bioplastic.
The plastic samples were incubated with phaZ1 enzyme overnight and the 3HB was detected from the samples using a 3HB colorimetric assay kit. Please see the protocol and the data for details.

The amount of 3HB monomers freed from the polymer is more in case of PhZ1 treated samples. There is less 3HB produced from the samples that were purified from bacteria than from the pure polymer. This could be because I put less amount in the assay, which I did because there was less available. I put about a 0.1g of grey and white and 0.5 grams of pure PHB.
We do expect to see some background 3HB in the untreated sample since it was in the shaking incubator at 37°C in the Buffer solution. PHB is a bioplastic and degrades spontaneously as well as enzymatically. However, the spontaneous degradation occurs slowly. We have made the process significantly more efficient and we are working on models to predict if this would be industrially scalable.
It is possible to work out how much PHB can be broken down by 1 gram of phaZ1 in an hour:
amount of 3HB monomers freed from polymer in average: 153.8 mM in 800uL
molecular weight of 3HB: 126.09
amount of phaZ1 enzyme: 0.230 mg/ml, I used 10 uL per reaction
time was overnight for about 15 hours.
Our chassis can utilise 3HB▼
bdh2 improves growth on 3HB
We have previously observed that MG1655 cells can survive in minimal media that contains 3HB as sole carbon source. This is evidence for that some uptake mechanism and a metabolic pathway is active at a low level in the cells. We hypothesised that the 3HB dehydrogenase could improve growth since it can convert 3HB into acetoacetate, a common metabolite in E.coli.
In order to test this, we run a growth experiment with various 3HB concentrations where the growth of cells containing bdh2 (BBa_K1149050) and Empty vector was recorded on a 96 well plate. We have calculated the growth rates from this data and plot it on the graph below.
 |  |
.png) | _fluor.png) |
Conclusion:We can conclude that there is a slight increase in the growth rate of bdh2 containing cells at 10 000 uM 3HB. This suggests that bdh2 is able to function as expected and produces acetoacetate which is used by the cell`s central metabolic pathways for growth. At 100uM or 100 000 uM, we did not observe any differences in growth. This could be be because the rate limiting step at low concentrations could be the uptake of 3HB rather than it`s conversion to acetoacetate. We hope that we could observe an increase in growth if we added the putative permease we designed to the system. At higher level, there is a drop in growth rates in both bdh2 and control cells, probably because of toxicity issues. In addition, fluorescence is highly elevated in bdh2 compared to empty vector control.
Completing the cycle▼
PLA degradation▼
Proteinase K kinetic activity
According to the literature, protease K breaks down poly L-lactic acid as well as fibrous proteins, such as silk fibroin. In the active site of proteinase K is a catalytic triad containing serine, histidine and aspartic acid. L-lactic acid is analogous to L-alanine. Poly L-lactic acid, therefore, can bind to and be catalysed by the catalytic triad, as it mimics silk fibroin which is rich with L-alanine residues. Proteinase K cannot catalyse the breakdown of poly D-lactic acid, because the catalytic triad will not accommodate it. [18] [19]
To obtain parameters to use in our PLA degradation model that kinetic activity of proteinase K was measured with a substrate analogue, N-succinyl Ala-Ala-Pro-Leu p-nitroanilide (AAPL p-NA). Cleavage of AAPL p-NA releases 4-nitroaniline (4-NA), which can be recorded by an increase in absorbance at wavelength 405nm. For this assay, proteinase K and AAPL p-NA were purchased from Sigma.

The extinction coefficient of 4-nitroaniline is 9,500 M-1s-1 at wavelength 405 nm, according to Sigma. Using the Beer-Lambert law, the concentrations of 4-NA were calculated and plotted against time.


The initial velocities were calculated as the gradient between 0 and 30 seconds, when time = 0 seconds. These were plotted against the concentration AAPLp-NA and graphpad was used to estimate the Michaelis-Menten fit. It determined the Vmax as 46.31 µM/s and the Km as 19.28 µM.

Proteinase K is a hydrolytic enzyme and active
Proteinase K is expressed in MG1655 cells transformed with BBa_K1149008
Proteinase K degrades PLA cup
Below come all the fabulous SEM images we shall hopefully have:

Extras▼
Protocols▼
Safety▼
Chemical reagents
Some of the reagents we used were slightly toxic to human. In order to reduce the risks of using toxic reagents, we always wear gloves and labcoats. For some toxic reagents, we performed in fume cupboard. Click on the reagents to see the MSDS.
1. Poly(R)-3-hydroxybutyric acid.
2. Proteinase K.
4. Arabinose.
5. Acetoacetate.
Papers Referenced
- ANDERSON A, DAWES E. Occurrence, Metabolism, Metabolic Role, and Industrial Uses of Bacterial Polyhydroxyalkanoates. Microbiol Rev 1990 DEC;54(4):450-472.
- Harding KG, Dennis JS, von Blottnitz H, Harrison STL. Environmental analysis of plastic production processes: Comparing petroleum-based polypropylene and polyethylene with biologically-based poly-beta-hydroxybutyric acid using life cycle analysis. J Biotechnol 2007 MAY 31;130(1):57-66.
- Kim S, Dale BE. Energy and Greenhouse Gas Profiles of Polyhydroxybutyrates Derived from Corn Grain: A Life Cycle Perspective. Environ Sci Technol 2008 OCT 15;42(20):7690-7695.
- Jendrossek D, Handrick R. Microbial degradation of polyhydroxyalkanoates. Annu Rev Microbiol 2002;56:403-432.
- Philip S, Keshavarz T, Roy I. Polyhydroxyalkanoates: biodegradable polymers with a range of applications. Journal of Chemical Technology and Biotechnology 2007 MAR;82(3):233-247.
- Thomas C. Bruice , Thomas H. Fife , John J. Bruno , Patricia. BenkovicHydroxyl Group (V)1 and Imidazole (X)2 Catalysis. The General Base Catalysis of Ester Hydrolysis by Imidazole and the Influence of a Neighboring Hydroxyl Group. J. Am. Chem. Soc., 1962, 84 (15), pp 3012–3018
- Fusako Kawai, Kosuke Nakadai, Emiko Niskioka, Hajime Nakajima, Hitomi Ohara, Kazao Masaki, Haruyaki Lefuji.Different enantioselectivity of two types of poly (lactic acid) depolymerases toward poly (L-lactic acid) and poly (D-lactic acid).Polymer Degradation and Stability Volume 96, Issue 7, July 2011, Pages 1342–1348
- Jun Liao, Manfred K Warmuth, Sridhar Govindarajan, Jon E Ness, Rebecca P Wang, Claes Gustafsson, Jeremy MinshullEngineering proteinase K using machine learning and synthetic genes.BMC Biotechnology 2007, 7:16 doi:10.1186/1472-6750-7-16
We are changing the pelB secretion tag to OsmY-fusion partner for better secretion
As seen in the Western Blot results, some of the enzymes designed for secretion were not secreted. These proteins may have been stuck in the periplasmic space. Thus we are optimising enzyme secretion by building a new construct with OsmY BBa_K892008 fusion for secretion. OsmY is naturally secreted from E.coli and will carry our PUR esterase enzyme with. Once in the culture medium, we think that the enzyme is going to be functional in the fusion form but we included a TEV site in between the domains that can be cleaved by TEV protease if needed.

The linker sequence we have designed between the domains is T G S E N L Y F Q G S (ACCGGCAGCGAGAACCTGTACTTCCAAGGCAGC) and includes the 7 amino acids of the TEV site as well as 4 other amino acids for flexibility.
This construct will be a substitute for BBa_K1149010 and BBa_K1149008 biobricks which are the PHB depolymerase PhaZ1 and ProteinaseK with the pelB seretion tag.
We will construct phaCB
This construct requires removal of phaA which links central metabolism to the P(3HB) synthesis process. By removing this we may optimise plastic production by decreasing a means by which the intermediates before P(3HB) synthesis are converted into products of the central metabolism by a non-favourable equilibrium.
Bacillus subtilis conversion
Our long term goal is to transform our whole system into 2 or 3 organisms to optimise the system. The chassis we intend to use for this will be B. subtilis as it is both very successful at secreting proteins extracellularly and sporulates, which makes it ideal for transport and long term storage. This would be implemented at the stage when we have thoroughly tested all of our constructs within E. coli to ensure they function as specified and to do this more rapidly too.