|
|
| Line 116: |
Line 116: |
| | <h3 class="clear">LB</h3> | | <h3 class="clear">LB</h3> |
| | {| class="wikitable" style="margin: 1em auto 1em auto;" | | {| class="wikitable" style="margin: 1em auto 1em auto;" |
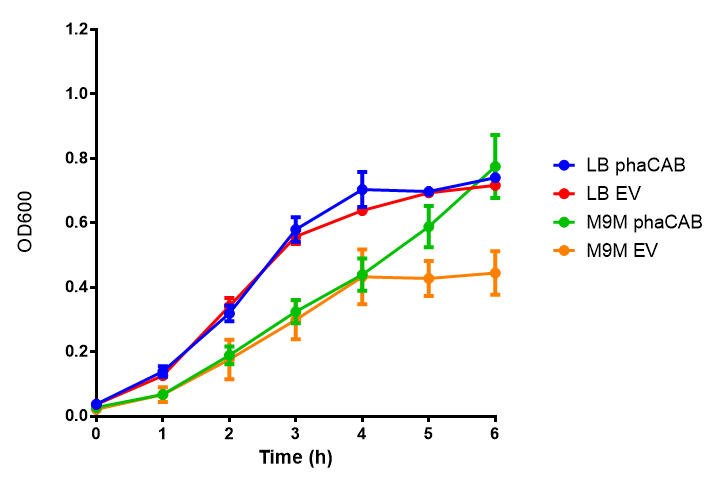
| - | |[[File:LB.png|thumbnail|center|450px|<b>Figure 1: MG1655 in LB with plasmids EV and phaCAB ([http://parts.igem.org/wiki/index.php?title=Part:BBa_K1149041 BBa_K1149041]).</b> There is no growth inhibition when comparing the empty vector with the phaCAB vector in each media. LB shows the strongest growth curve with minimal lag phase. Growth was at 37°C with shaking over 6h. Error bars are SEM, n=4. Figure made by Imperial College London 2013 iGEM.]] | + | |[[File:LB.png|thumbnail|center|450px|<b>Figure 1: MG1655 in LB with plasmids EV and phaCAB ([http://parts.igem.org/wiki/index.php?title=Part:BBa_K1149041 BBa_K1149041]).</b> There is no growth inhibition when comparing the empty vector with the phaCAB vector in LB media. LB shows the strongest growth curve with minimal lag phase. Growth was at 37°C with shaking over 6h. Error bars are SEM, n=4. Figure made by Imperial College London 2013 iGEM.]] |
| | | | |
| | |[[File:PhaCAB_LB.png|thumbnail|center|450px|<b>Figure 1: MG1655 in LB with plasmid EV and the native, constitutive and hybrid promoters for phaCAB.</b> The plasmids all show similar growth curves in LB for all 3 promoters. Indeed this is confirmed by an ANOVA test, which shows no significance in terms of growth difference the constructs (<i>F</i> <sub>3,24</sub> = 0.3573, p < 0.7843). Growth was at 37°C with shaking over 6h. Error bars are SEM, n=4. Figure made by Imperial College London 2013 iGEM.]] | | |[[File:PhaCAB_LB.png|thumbnail|center|450px|<b>Figure 1: MG1655 in LB with plasmid EV and the native, constitutive and hybrid promoters for phaCAB.</b> The plasmids all show similar growth curves in LB for all 3 promoters. Indeed this is confirmed by an ANOVA test, which shows no significance in terms of growth difference the constructs (<i>F</i> <sub>3,24</sub> = 0.3573, p < 0.7843). Growth was at 37°C with shaking over 6h. Error bars are SEM, n=4. Figure made by Imperial College London 2013 iGEM.]] |
| Line 122: |
Line 122: |
| | | | |
| | <h3 class="clear">M9 Minimal</h3> | | <h3 class="clear">M9 Minimal</h3> |
| - | [[File:M9M.png|thumbnail|center|500px|<b>Figure 1: MG1655 in M9M with plasmids EV and phaCAB.</b> There is no growth inhibition when comparing the empty vector with the phaCAB vector in each media. M9M shows the least growth growth of all the medias as it has low carbon and amino acid content. Growth was at 37°C with shaking over 6h. Error bars are SEM, n=4. Figure made by Imperial College London 2013 iGEM.]] | + | [[File:M9M.png|thumbnail|center|500px|<b>Figure 1: MG1655 in M9M with plasmids EV and phaCAB.</b> There is no growth inhibition when comparing the empty vector with the phaCAB vector in minimal media. M9M shows the least growth growth of all the media as it has low carbon and amino acid content. Growth was at 37°C with shaking over 5h. Error bars are SEM, n=4. Figure made by Imperial College London 2013 iGEM.]] |
| | | | |
| | <h3 class="clear">M9 Supplemented</h3> | | <h3 class="clear">M9 Supplemented</h3> |
| - | [[File:M9S.png|thumbnail|center|500px|<b>Figure 1: MG1655 in M9S with plasmids EV and phaCAB.</b> There is no growth inhibition when comparing the empty vector with the phaCAB vector in each media. M9S shows a lag phase in growth but quickly increases due to increased amino acid content, nearly reaching LB after 5h. Growth was at 37°C with shaking over 6h. Error bars are SEM, n=4. Figure made by Imperial College London 2013 iGEM.]] | + | [[File:M9S.png|thumbnail|center|500px|<b>Figure 1: MG1655 in M9S with plasmids EV and phaCAB.</b> There is no growth inhibition when comparing the empty vector with the phaCAB vector in supplemented minimal media. M9S shows a lag phase in growth but quickly increases due to increased amino acid content, nearly reaching LB after 5h. Growth was at 37°C with shaking. Error bars are SEM, n=4. Figure made by Imperial College London 2013 iGEM.]] |
| | | | |
| | | | |
| Line 132: |
Line 132: |
| | | | |
| | {| class="wikitable" style="margin: 1em auto 1em auto;" | | {| class="wikitable" style="margin: 1em auto 1em auto;" |
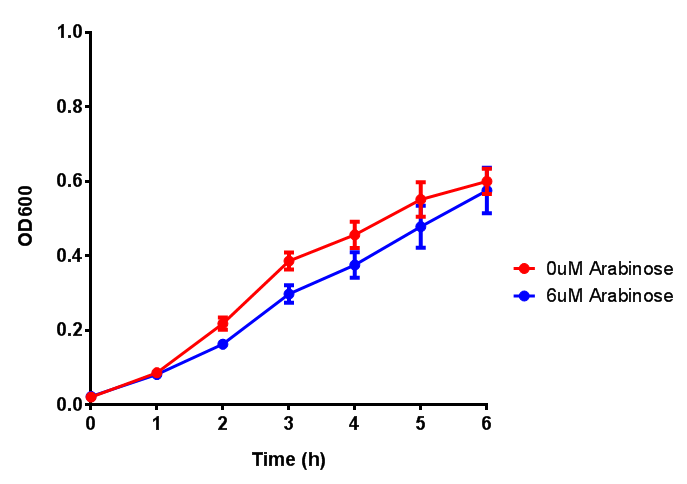
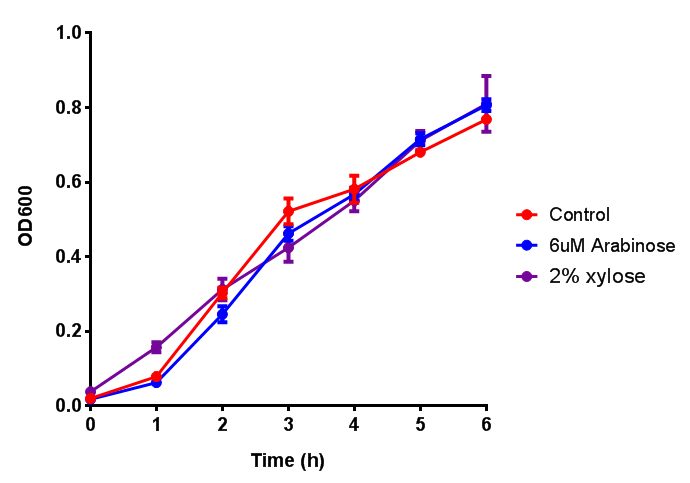
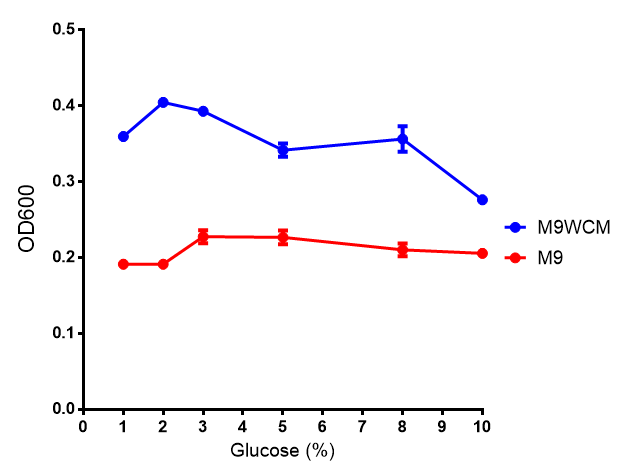
| - | | [[File:Arabinose_induction.png|thumbnail|right|450px|Cell growth over 6h with IPTG induction. mCherry production is induced by the stress pathway and detection of ppGpps. In order to bypass this, we induced with IPTG which inhibits LacI, resulting in mCherry expression.]] | + | |[[File:Arabinose_induction.png|thumbnail|right|450px|<b>Influence of Arabinose Concentration on growth in minimal media.</b> Characterisation was done in both M9 minimal media and M9 minimal [https://2013.igem.org/Team:Imperial_College/Protocols#Waste_Conditioned_Media_.28WCM.29 waste conditioned media]. This showed that while growth was unaffected with Arabinose induction from 2-10 μM, M9WCM had decreased growth with an optimum at 10 μM. Growth was at 37°C with shaking over 6h. Error bars are SEM, n=4. Figure made by Imperial College London 2013 iGEM.]] |
| - | | [[File:F_arabinose_induction.png|thumbnail|right|450px|Fluorescence of the cells under IPTG induction over a 6h period.]] | + | |
| | + | |[[File:F_arabinose_induction.png|thumbnail|right|450px|<b>Influence of Arabinose Concentration on fluorescence in minimal media.</b> Characterisation was done in M9 and M9WCM. The trend shows that fluorescence is increased in M9 at lower induction ceonctration than M9WCM, however, the graph requires normalisation to better reflect reality. Growth was at 37°C with shaking over 6h. Error bars are SEM, n=4. Figure made by Imperial College London 2013 iGEM.]] |
| | |} | | |} |
| | + | |
| | The null hypothesis, arabinose concentration does not influence growth of MG1655 in M9 minimal (M9M) media and M9 minimal waste conditioned media (M9MWCM) was tested using a two-tailed t-test. This must be rejected because p < 0.0001, thus arabinose concentration has an influence on growth in M9M and M9MWCM. | | The null hypothesis, arabinose concentration does not influence growth of MG1655 in M9 minimal (M9M) media and M9 minimal waste conditioned media (M9MWCM) was tested using a two-tailed t-test. This must be rejected because p < 0.0001, thus arabinose concentration has an influence on growth in M9M and M9MWCM. |
| | | | |
Growth and Toxicity Assays
This page includes all of our experimental growth, toxicity and sole carbon source assay data.
Growth assays with different experimental media
In additional to standard LB and minimal media, several novel experimental media were developed in order to characterise Biobricks within a mixed waste/landfill setting. These media were characterised through an examination of pH and through an array of growth assays with the project chassis, E.coli (MG1655).
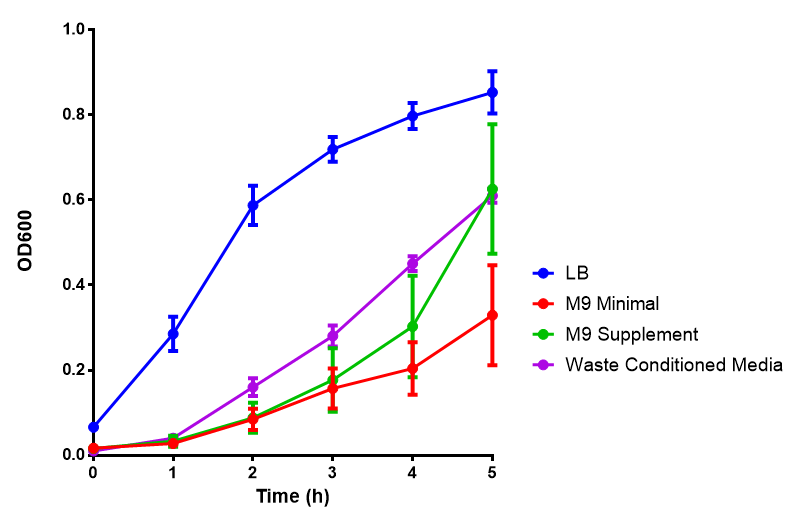 Media characterisation. E. coli strain MG1655 were transformed with a control plasmid and grown in different experimental media over a period of 5 hours. LB media, minimal media (M9M), supplemented minimal media (M9S), as described here or waste conditioned media (WCM), which is made from sterile filtrated mixed waste, see here. OD600 measured, error bars are S.E.M., n=4. Figure made by Imperial College London 2013 iGEM. | 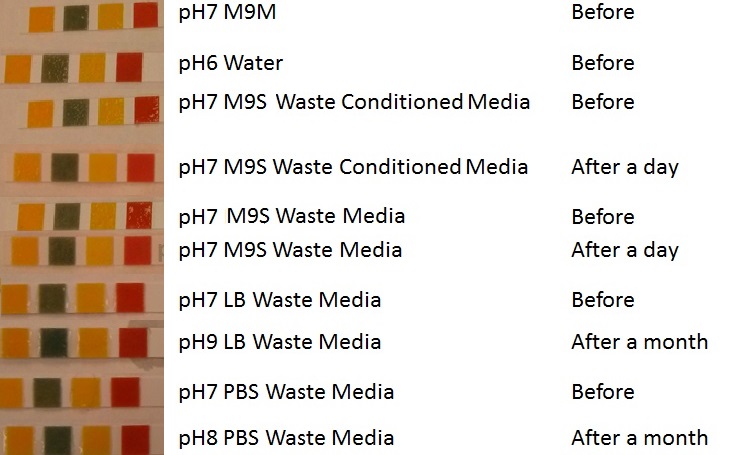 pH of experimental media. pH measurements of experimental media were made both before and after several experiments. The time periods refer to the duration MG1655 transformed E. coli were cultured in the media before a pH measurement was made. Figure made by Imperial College London 2013 iGEM. |
Conclusion: MG1655 E. coli are viable and grow in all of our experimental medias. We have established a novel media that is optimised for characterisation of biobricks within a mixed waste/landfill context.
Long term waste growth assays
These assays were designed to test whether our chassis, E. coli (MG1655) could grow directly with waste over a long period of time.
Waste media
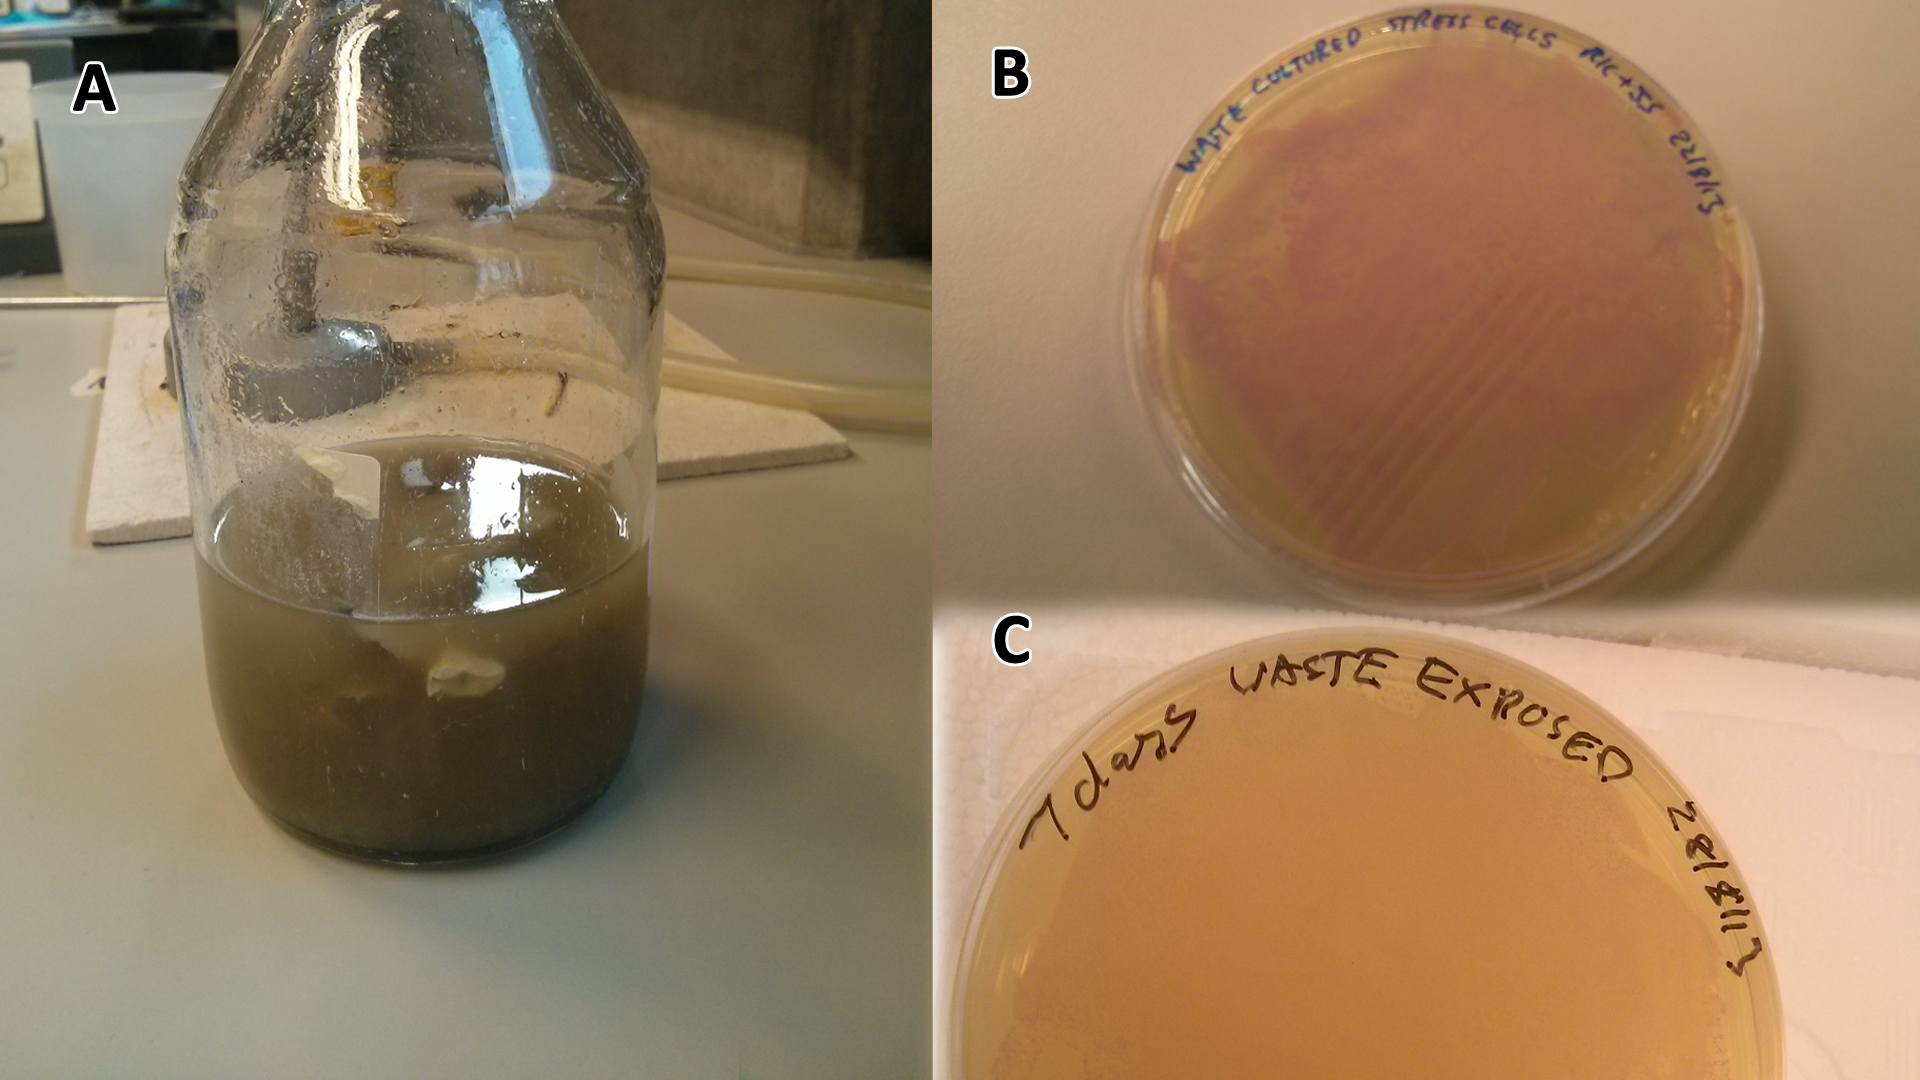 LB-waste assay(A) Waste media (B) Ecoli containing mCherry stress biosensor (BBa_K639003) were grown in mixed waste (A) over 3 days, then streaked in a qualitative assay to check for growth. (C) mCherry stress biosensor (BBa_K639003) transformed Ecoli were streaked again after 7 days growth in SRF. Figure made by Imperial College London 2013 iGEM. | 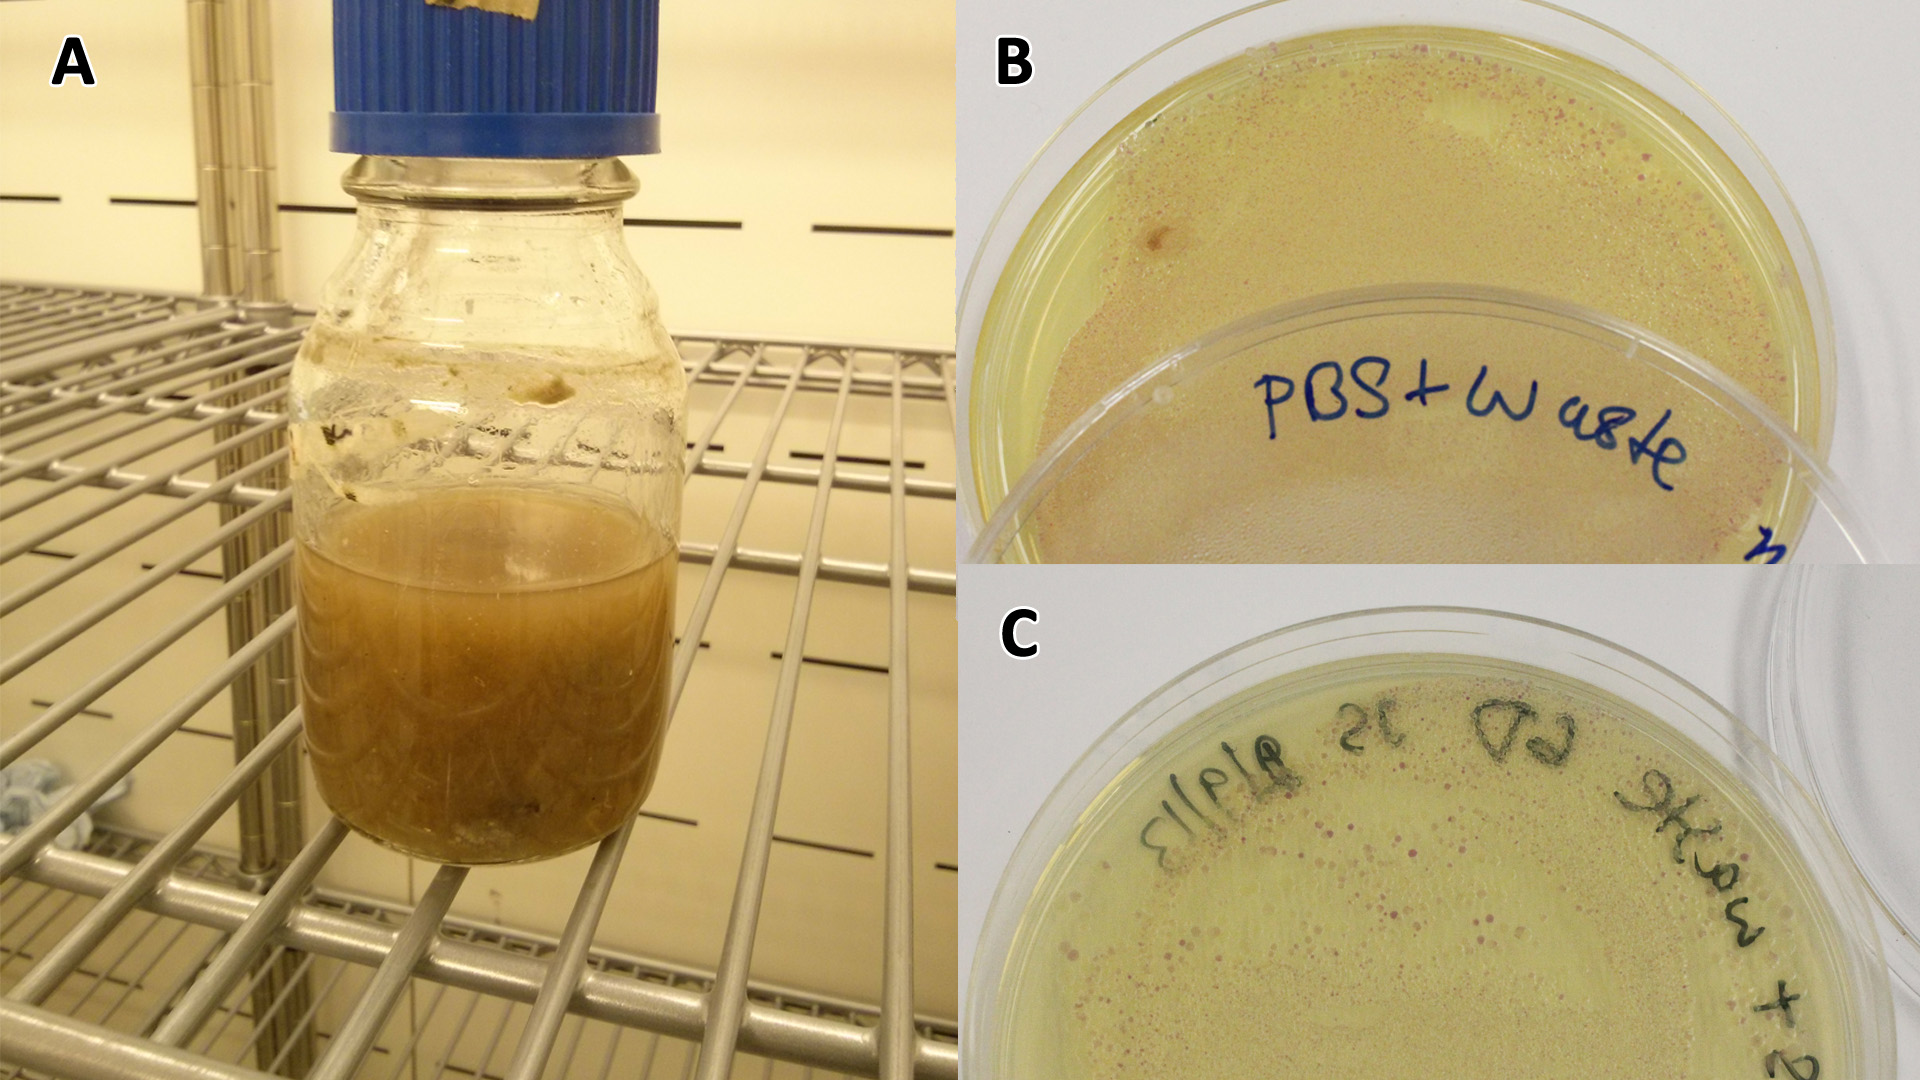 PBS-waste assay(A) waste media made up in PBS (phosphate buffered saline). (B) E coli expressing mCherry stress biosensor (BBa_K639003) grown in waste media (A) over 3 days, then streaked onto an antibiotic containing plate to qualitatively assess whether the E. coli had survived. (C) Streaked again after 6 days growth in SRF. Figure made by Imperial College London 2013 iGEM. |
Conclusion: MG1655 E. coli are viable and grow on mixed waste alone. Therefore we have established that our chassis could survive in a mixed waste bio-reactor context, which is validation of our concept to industrially implement our system.
Waste conditioned media
These assays were designed to test whether our chassis, E. coli (MG1655) could grow with waste conditioned media (WCM) over a period of 24-48 hours. Waste conditioned media is a filter sterilised version of the waste media and was designed for several reasons; Firstly we were unsure whether mixed waste would be toxic to Ecoli and hence a less concentrated version may be more suitable and secondly large chunks of waste would prevent accurate OD600 measurements and therefore we decided to filter out the largest chunks.
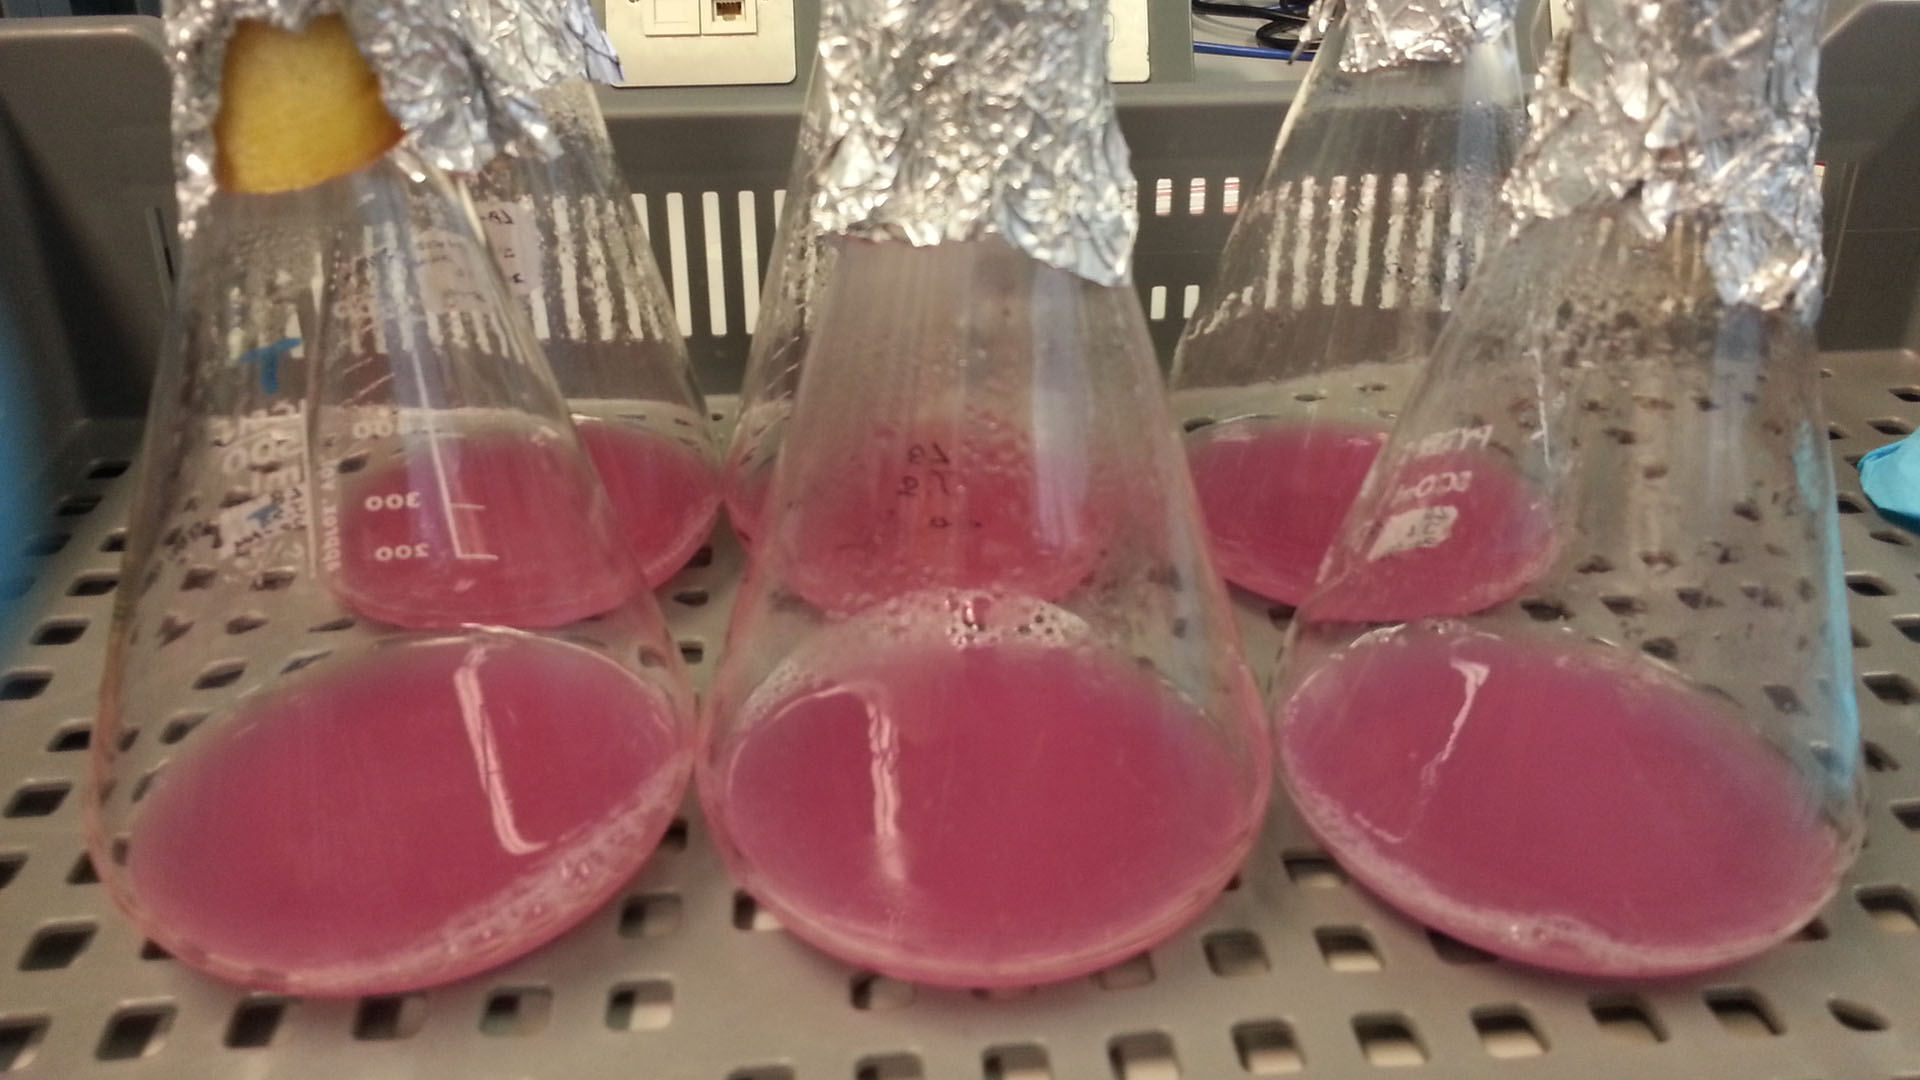 Photograph of waste conditioned media cultures mCherry stress biosensor (BBa_K639003) transformed MG1655 were grown with LB-WCM at 37ºC, with shaking for 48 hours. Figure made by Imperial College London 2013 iGEM. |
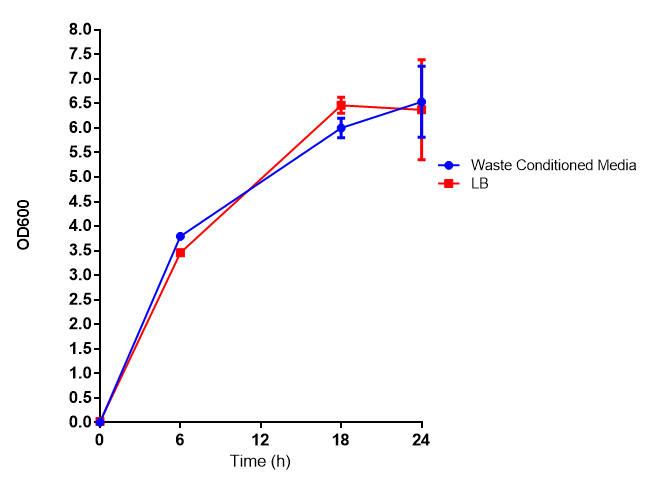 Growth assay in waste conditioned media (WCM). E. coli (MG1655) transformed with mCherry stress biosensor. were grown with LB-based waste conditioned media at 37ºC, with shaking. Error bars represent S.E.M., n=4. Figure made by Imperial College London 2013 iGEM. |
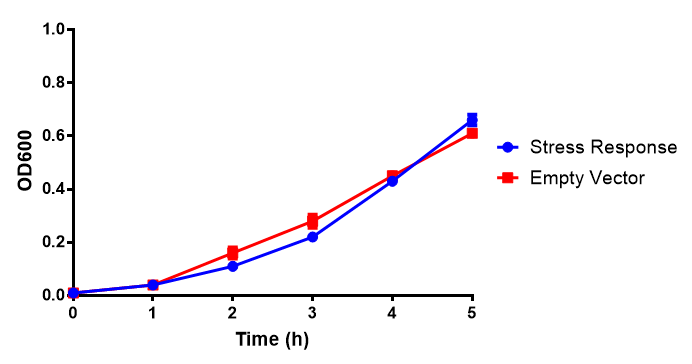 Growth assay in waste conditioned media (WCM). E. coli (MG1655) transformed with either empty vector control (EV) or mCherry stress biosensor (BBa_K639003) were grown in WCM for 5 hours, with shaking at 37ºC. Error bars are SEM, n=4. Figure made by Imperial College London 2013 iGEM. |
Conclusion: MG1655 transformed with either empty vector (EV) control or mCherry stress biosensor (BBa_K639003) vector are viable and can grow in waste conditioned media. Therefore waste conditioned media is an appropriate and novel experimental media with which to characterise biobricks within a mixed waste/landfill context. These data are also characterisation of an existing biobrick (BBa_K639003)
Growth and induction assays of our Biobricks
Growth and induction assays of our project biobricks. Several of our constructs contain sfGFP within an operon and therefore fluorescence can be utilised to determine if expression is being induced by either addition of Arabinose or Xylose as appropriate to the construct.
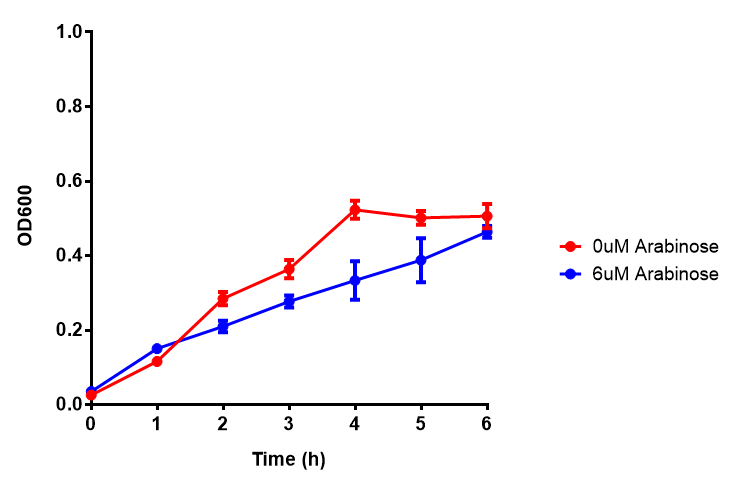
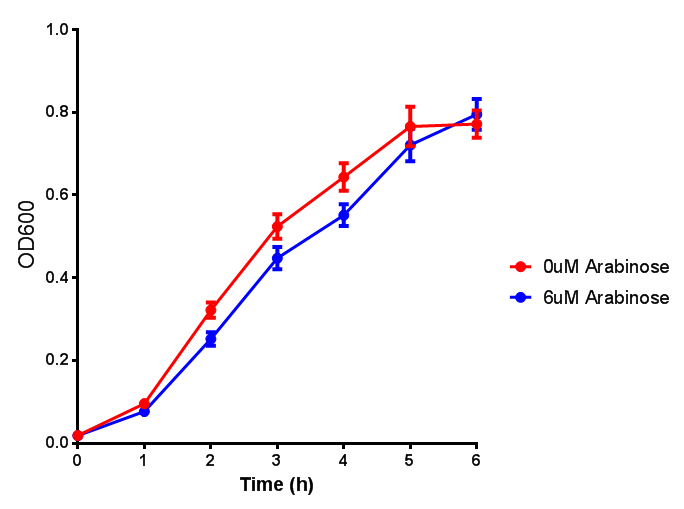
 Bdh2 with pelB secretion tag growth assay. E. coli (MG1655) transformed with pelB-bdh2 BBa_K1149013 were grown with either 0 μM or 6 μM Arabinose to induce bdh2 and sfGFP expression. Bdh2 induction shows reduced growth of MG1655 but after 6h they reach the same OD, the decrease in growth is confirmed as not significant by a two-tailed t-test where p = 0.6964 > 0.05 (critical value). Growth was at 37°C with shaking. Error bars are SEM, n=4. Figure made by Imperial College London 2013 iGEM. |  Bdh2 with pelB secretion tag induction assay. E. coli (MG1655) transformed with pelB-bdh2 BBa_K1149013 were grown with either 0 μM or 6 μM Arabinose to induce bdh2 and sfGFP expression. We see that induction leads to stronger expression of bdh2 than without, although the promoter is leaky as the curve follows a similar pathway. Growth was at 37°C with shaking. Error bars are SEM, n=4. Figure made by Imperial College London 2013 iGEM. |
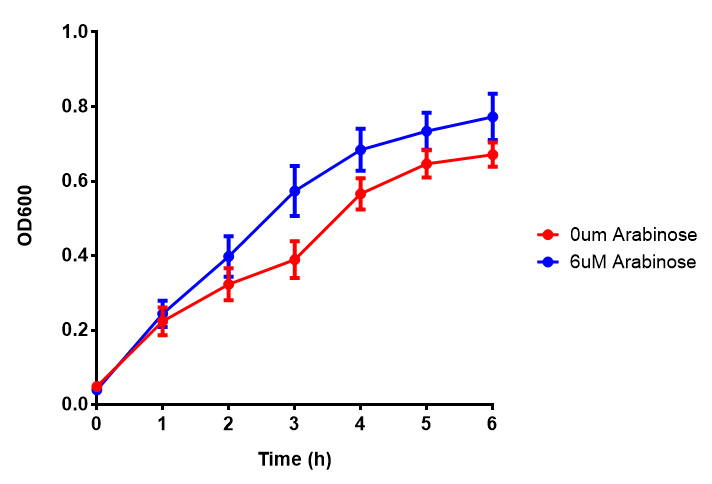
 Bdh2 with no pelB secretion tag growth assay MG1655 with intracellular bdh2 were grown over 6h to gauge the effect on growth when induced. Graph shows that while they reach the same end point, growth is initially faster without induction for BBa_K1149050, though this was not significant as a two-tailed t-test gave p = 0.4930 > 0.05, allowing us to accept the null hypothesis. Error bars are SEM, n=4. Figure made by Imperial College London 2013 iGEM. | 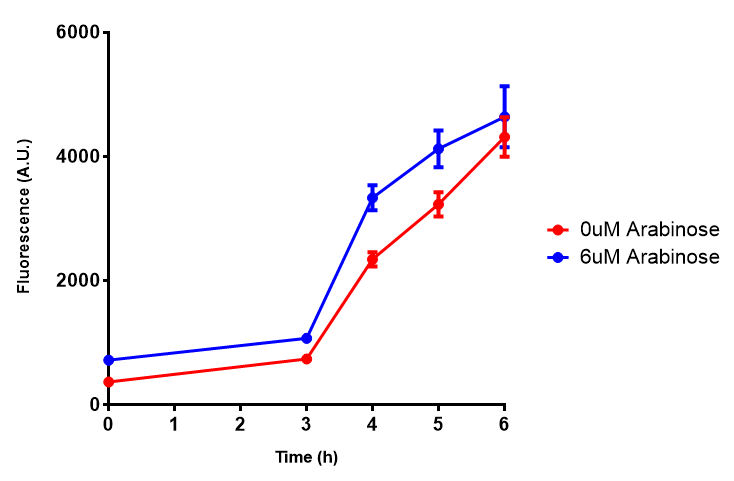 Bdh2 with no pelB secretion tag induction assay In addition to testing BBa_K1149050 growth, we looked at induction whereby we see that more sfGFP is produced when induced. Although the promoter is leaky as the curve of intracellular bdh2, as seen with bdh2-pelB is followed tightly by the non-induced cells. Error bars are SEM, n=4. Figure made by Imperial College London 2013 iGEM. |
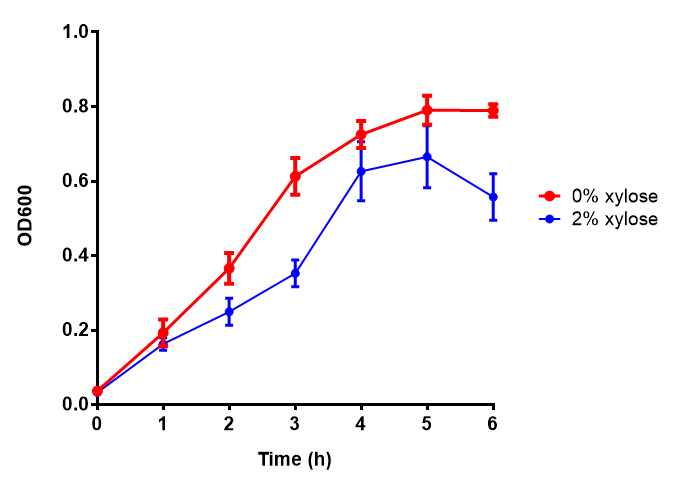
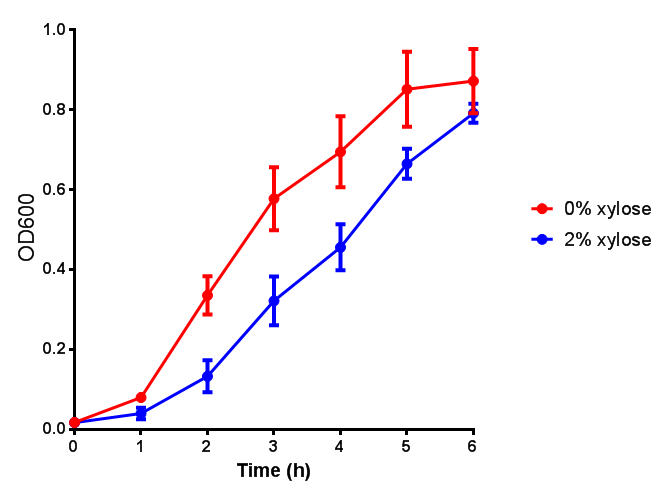 CLE growth assay. E. coli (MG1655) transformed with CLE BBa_K1149009 were grown with either 0% or 2% Xylose to induce CLE and sfGFP expression. Induction with xylose shows growth inhibition. Growth was at 37°C with shaking. Error bars are SEM, n=4. Figure made by Imperial College London 2013 iGEM. | 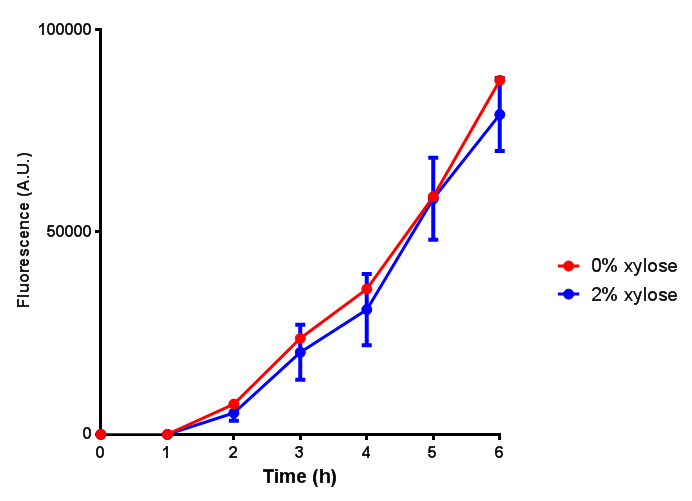 CLE induction assay. E. coli (MG1655) transformed with CLE BBa_K1149009 were grown with either 0% or 2% Xylose to induce CLE and sfGFP expression. CLE induction does not seem to increase the amount of fluorescence emitted by the GFP. Growth was at 37°C with shaking. Error bars are SEM, n=4. Figure made by Imperial College London 2013 iGEM. |
Ideally you would normalise the fluorescence with OD600 to give fluorescence/cell in order to get the actual difference in induction expression. A two-tailed t-test shows that p = 0.4308 > 0.05, therefore there is no statistical difference between induced and uninduced.
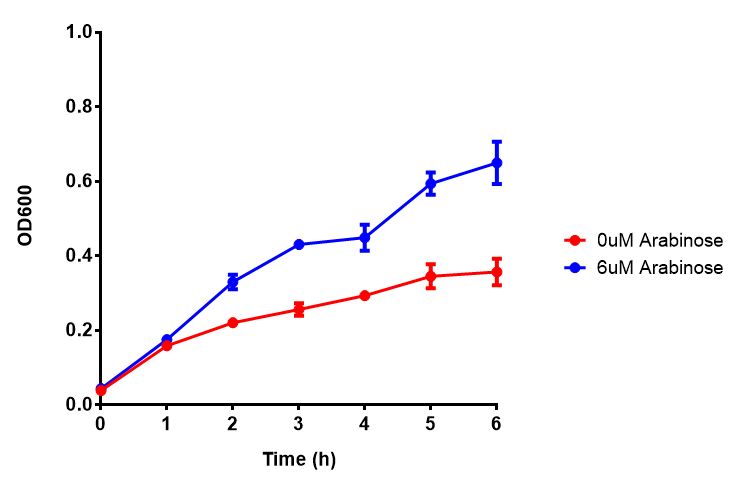
 ETSCS2 growth assay. E. coli (MG1655) transformed with ESTCS2 BBa_K1149002 were grown with either 0 μM or 6 μM Arabinose to induce ESTC2 and sfGFP expression. The growth curves appear very similar, which is confirmed by a two-tailed t-test p-value = 0.8118, thus no reason to say that there is any growth inhibition. Growth was at 37°C with shaking. Error bars are SEM, n=4. Figure made by Imperial College London 2013 iGEM. | 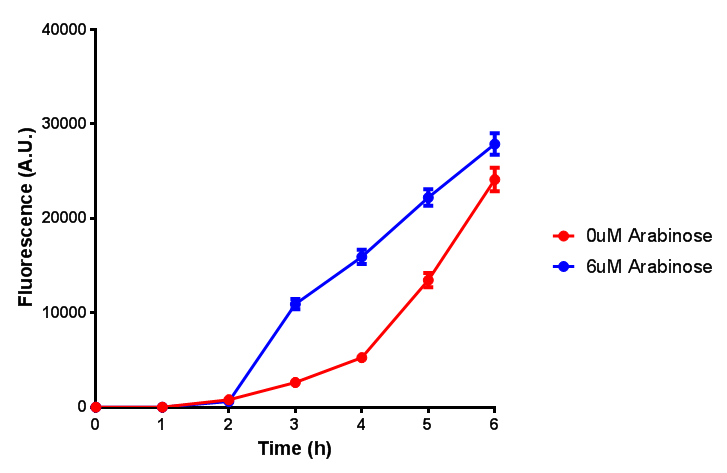 ETSCS2 induction assay. E. coli (MG1655) transformed with ESTCS2 BBa_K1149002 were grown with either 0uM or 6uM Arabinose to induce ESTC2 and sfGFP expression. Induction by Arabinose produces a strong response, with induced transformants fluorescing more. Growth was at 37°C with shaking. Error bars are SEM, n=4. Figure made by Imperial College London 2013 iGEM. |
 PueA growth assay. MG1655 E. coli were grown for 6h with 0 μM or 6 μM Arabinose. There was no difference between no induction and induction as a t-test gave p = 0.5559 > 0.05. Growth was at 37°C with shaking. Error bars are SEM, n=4. Figure made by Imperial College London 2013 iGEM. | 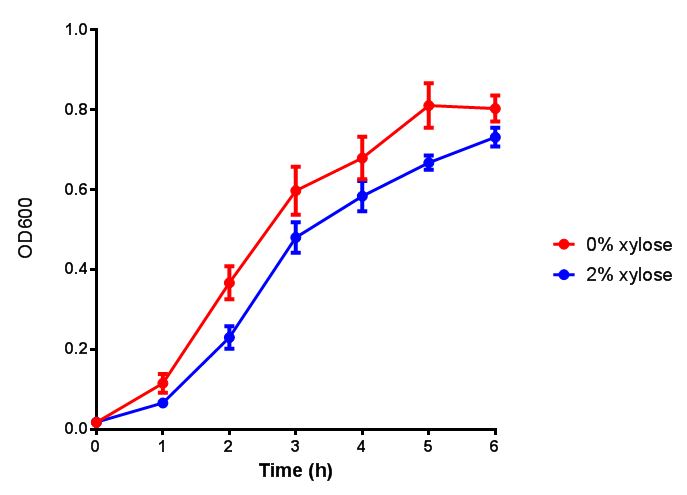 PueB growth assay. E. coli (MG1655) transformed with PueB BBa_K1149004 were grown with either 0% or 2% Xylose to induce PueB expression. There was no difference between no induction and induction as a t-test gave p = 0.6040 > 0.05. Growth was at 37°C with shaking. Error bars are SEM, n=4. Figure made by Imperial College London 2013 iGEM. |
 Phaz1 growth assay. MG1655 E. coli were grown for 6h with 0% and 2% Xylose to induce Phaz1 BBa_K1149010. A two-tailed t-test, with p = 0.4181 shows that there is no significant difference between induction and no induction with regards to growth inhibition, as the value exceeds the critical value of 0.05. Growth was at 37°C with shaking. Error bars are SEM, n=4. Figure made by Imperial College London 2013 iGEM. | 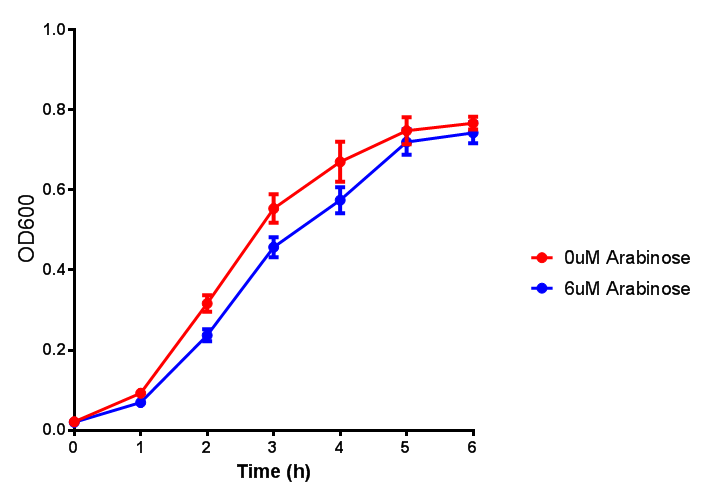 PulA growth assay. E. coli (MG1655) transformed with PulA (BBa_K1149006) were grown with either 0 μM or 6 μM Arabinose to induce PulA expression. There was no growth inhibition as p = 0.7648 > 0.05, therefore induction did not cause significant growth decrease. Growth was at 37°C with shaking. Error bars are SEM, n=4. Figure made by Imperial College London 2013 iGEM. |
 Proteinase K growth assay. MG1655 E. coli display strong growth with the induction of BBa_K1149007, though it is not significant as a two-tailed t-test gave p = 0.1471. Growth was at 37°C with shaking. Error bars are SEM, n=4. Figure made by Imperial College London 2013 iGEM. | 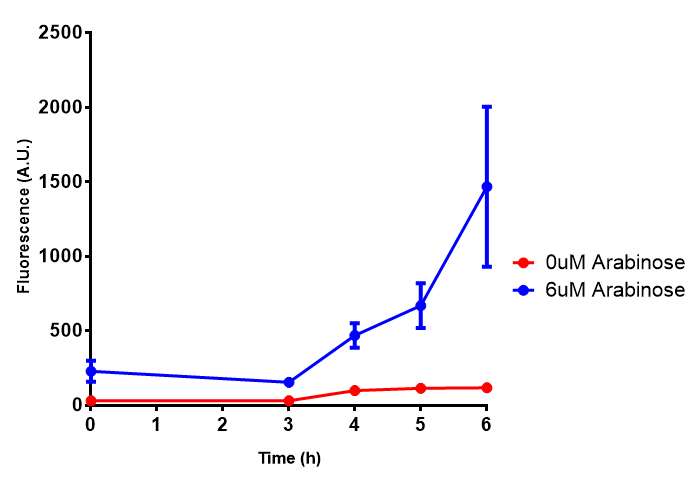 Proteinase K induction assay. When induced, there is a very clear increase in fluorescence for BBa_K1149007, however t-test analysis gives p = 0.0595 > 0.05 for this, thus the fluorescence does not significantly differ from uninduced. Growth was at 37°C with shaking. Error bars are SEM, n=4. Figure made by Imperial College London 2013 iGEM. |
 Proteinase K with pelB secretion tag growth assay. As with Proteinase K without pelB, there is increased growth compared to uninduced for BBa_K1149008. However this is not significant as a two-tailed t-test gave p = 0.4442. Growth was at 37°C with shaking. Error bars are SEM, n=4. Figure made by Imperial College London 2013 iGEM. | 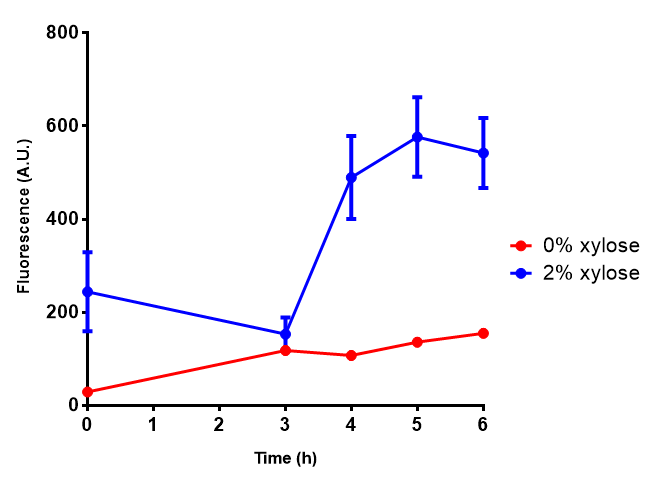 Proteinase K with pelB secretion tag induction assay. Induction of BBa_K1149008 gives a very strong induction response, this is significant as a two-tailed t-test gave a value of p = 0.0104 < 0.05. Thus the induction does have a significant effect on fluorescence for Proteinase K with pelB. Growth was at 37°C with shaking. Error bars are SEM, n=4. Figure made by Imperial College London 2013 iGEM. |
Empty Vector Control
Empty vector (EV) induction assay E. coli (MG1655) transformed with empty vector (EV) control plasmid were grown with either 0uM or 6uM Arabinose. Growth was at 37°C with shaking. Error bars are SEM, n=4. Figure made by Imperial College London 2013 iGEM.
Growth assay characterisation of existing biobricks
Stress biosensor characterisation (BBa_K639003)
Originally we intended on using BBa_K639003 to detect whether our cells were stressed when grown with an array of potentially toxic plastics and degradation products. However, as the data below shows, the promoter is leaky and expresses mCherry in a non stressed state. As an alternative we utilised the stress sensor as a marker for our chassis E. coli (MG1655) for an array of qualitative and quantitative waste growth and toxicity assays.
Note: The stress sensor induces mCherry production through a mechanism involving the ppGpp stress response. Induction with IPTG bypassess this mechanism through an inhibition of LacI, resulting in mCherry expression.
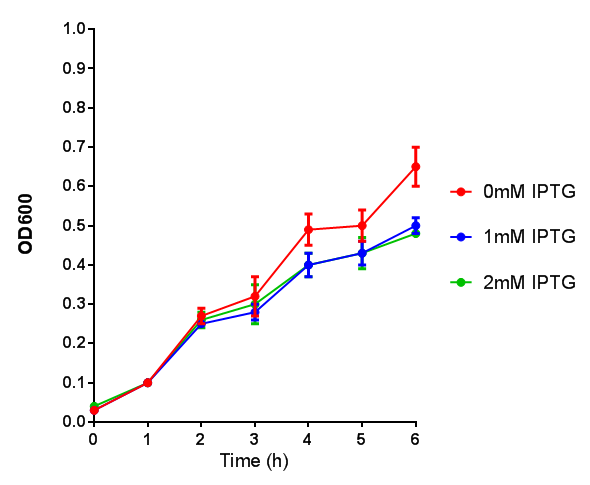 Stress sensor growth assay. E. coli (MG1655) transformed with stress biosensor BBa_K639003. Growth was at 37°C with shaking. Error bars are SEM, n=4. Figure made by Imperial College London 2013 iGEM. | 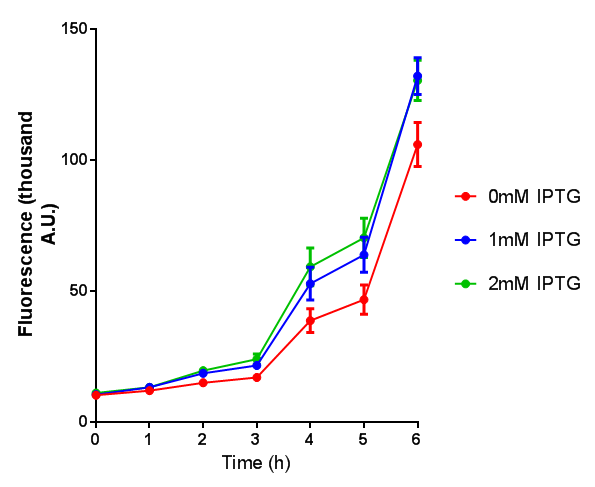 Stress sensor IPTG induced fluorescence. E. coli(MG1655) transformed with stress biosensor BBa_K639003. Growth was at 37°C with shaking over 6h. Error bars are SEM, n=4. Figure made by Imperial College London 2013 iGEM. |
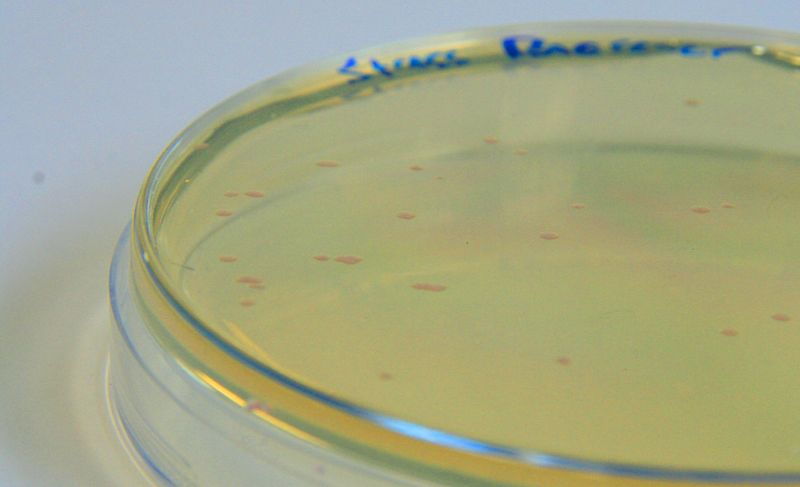 BBa_K639003 transformed into E. coli. strain MG1655. Pink colonies are visible, which relate to 'leaky' mCherry production | 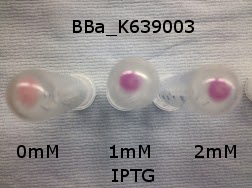 BBa_K639003 transformed into E. coli. strain MG1655. Cells were grown at 37°C in 4ml LB with 0, 1 or 2mM IPTG. At 6 hours post IPTG induction, cells were spun down and imaged. |
phaCAB biobrick characterisation
LB
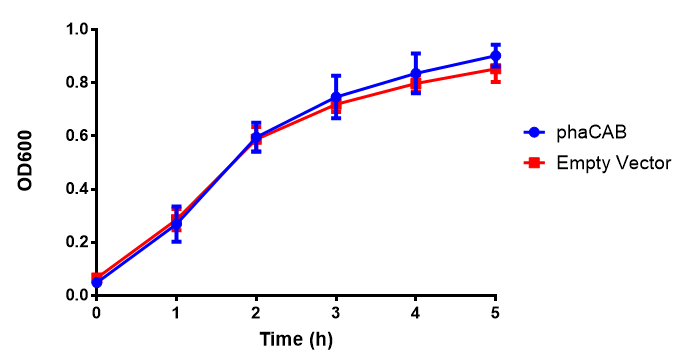 Figure 1: MG1655 in LB with plasmids EV and phaCAB (BBa_K1149041). There is no growth inhibition when comparing the empty vector with the phaCAB vector in LB media. LB shows the strongest growth curve with minimal lag phase. Growth was at 37°C with shaking over 6h. Error bars are SEM, n=4. Figure made by Imperial College London 2013 iGEM. | 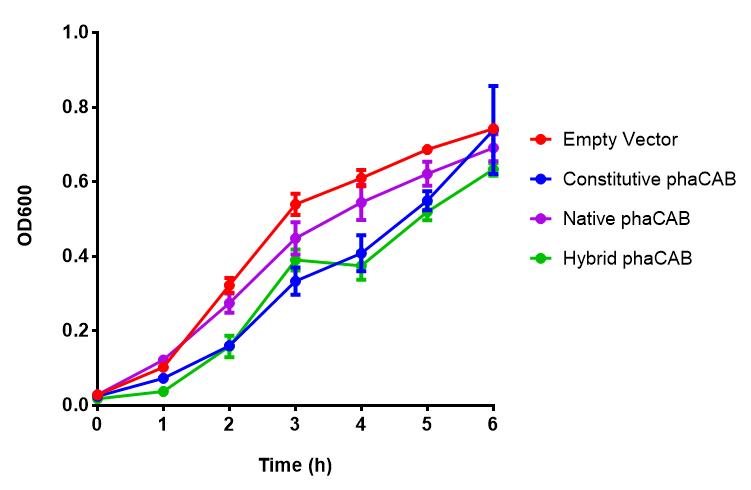 Figure 1: MG1655 in LB with plasmid EV and the native, constitutive and hybrid promoters for phaCAB. The plasmids all show similar growth curves in LB for all 3 promoters. Indeed this is confirmed by an ANOVA test, which shows no significance in terms of growth difference the constructs ( F 3,24 = 0.3573, p < 0.7843). Growth was at 37°C with shaking over 6h. Error bars are SEM, n=4. Figure made by Imperial College London 2013 iGEM. |
M9 Minimal
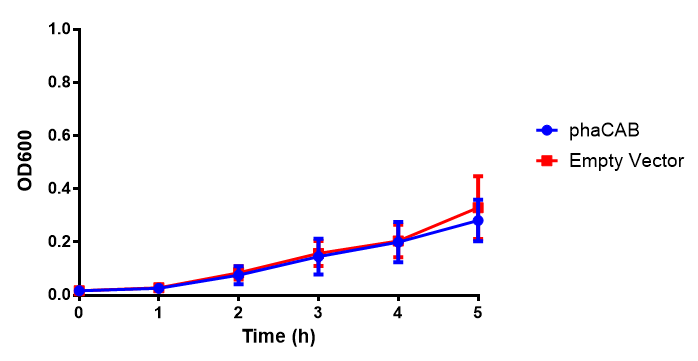
Figure 1: MG1655 in M9M with plasmids EV and phaCAB. There is no growth inhibition when comparing the empty vector with the phaCAB vector in minimal media. M9M shows the least growth growth of all the media as it has low carbon and amino acid content. Growth was at 37°C with shaking over 5h. Error bars are SEM, n=4. Figure made by Imperial College London 2013 iGEM.
M9 Supplemented
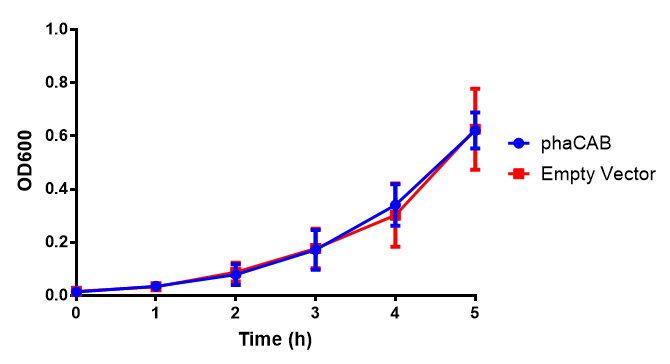
Figure 1: MG1655 in M9S with plasmids EV and phaCAB. There is no growth inhibition when comparing the empty vector with the phaCAB vector in supplemented minimal media. M9S shows a lag phase in growth but quickly increases due to increased amino acid content, nearly reaching LB after 5h. Growth was at 37°C with shaking. Error bars are SEM, n=4. Figure made by Imperial College London 2013 iGEM.
pBAD characterisation
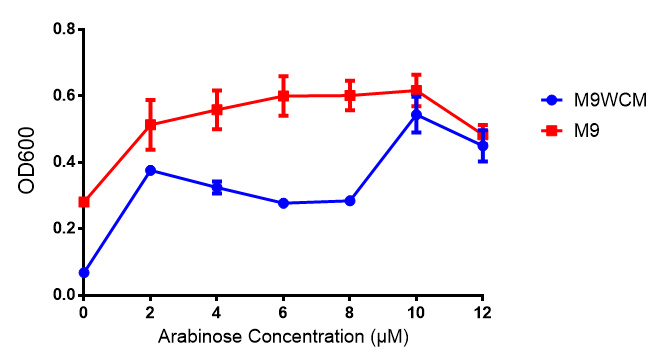 Influence of Arabinose Concentration on growth in minimal media. Characterisation was done in both M9 minimal media and M9 minimal waste conditioned media. This showed that while growth was unaffected with Arabinose induction from 2-10 μM, M9WCM had decreased growth with an optimum at 10 μM. Growth was at 37°C with shaking over 6h. Error bars are SEM, n=4. Figure made by Imperial College London 2013 iGEM. | 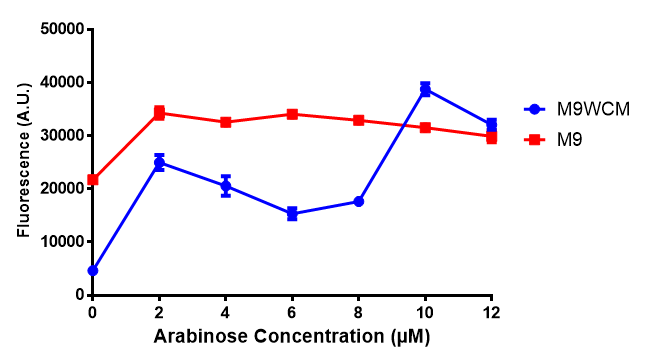 Influence of Arabinose Concentration on fluorescence in minimal media. Characterisation was done in M9 and M9WCM. The trend shows that fluorescence is increased in M9 at lower induction ceonctration than M9WCM, however, the graph requires normalisation to better reflect reality. Growth was at 37°C with shaking over 6h. Error bars are SEM, n=4. Figure made by Imperial College London 2013 iGEM. |
The null hypothesis, arabinose concentration does not influence growth of MG1655 in M9 minimal (M9M) media and M9 minimal waste conditioned media (M9MWCM) was tested using a two-tailed t-test. This must be rejected because p < 0.0001, thus arabinose concentration has an influence on growth in M9M and M9MWCM.
 Cell growth over 6h with IPTG induction. mCherry production is induced by the stress pathway and detection of ppGpps. In order to bypass this, we induced with IPTG which inhibits LacI, resulting in mCherry expression. | 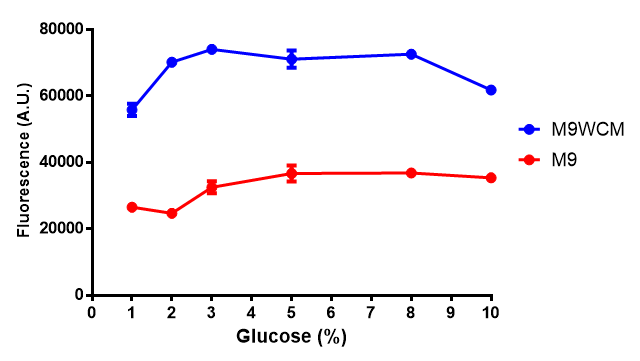 Fluorescence of the cells under IPTG induction over a 6h period. |
The null hypothesis, glucose concentration does not influence growth of MG1655 in M9 minimal (M9M) media and M9 minimal waste conditioned media (M9MWCM) was tested using a two-tailed t-test. This must be rejected because p < 0.0217, thus glucose concentration has an influence on growth in M9M and M9MWCM.
Glucose
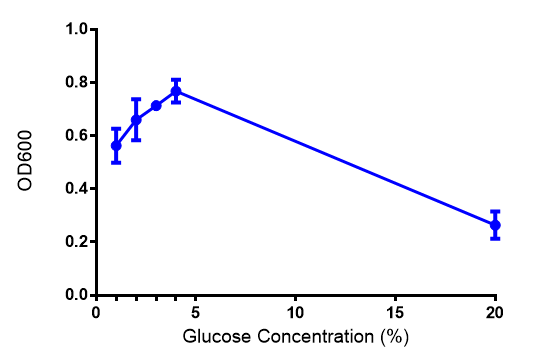 Cell growth of phaCAB E. coli at 4 concentrations of glucose. Optimum growth is at 2-4% glucose at 37ºC. Error bars represents SE of the mean, n=4 | 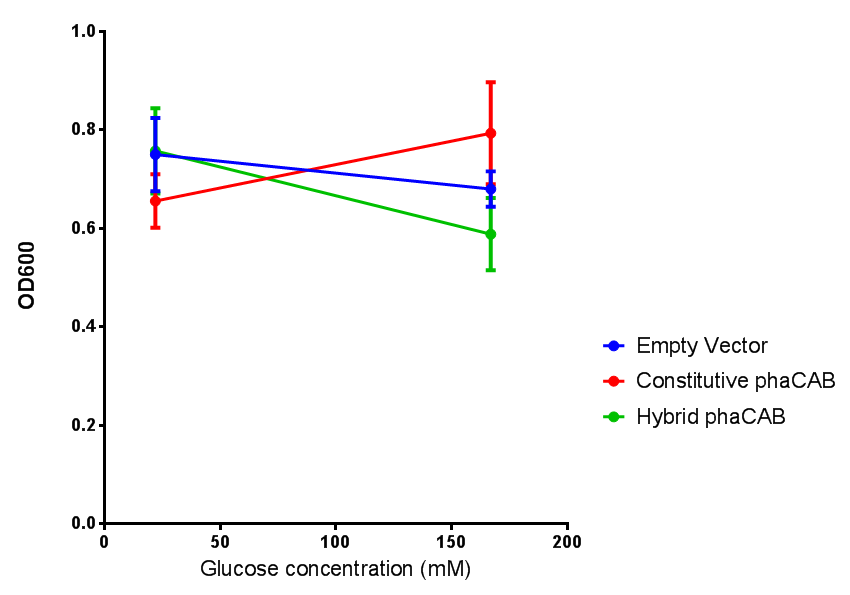 Cell growth of phaCAB E. coli |
 Cell growth over 6h in LB and M9M minimal media. LB grown MG1655 phaCAB grow more rapidly initially then M9M but reach the same OD after 6h while EV shows a different trend. EV in M9M levels off at a much lower OD at 4h, as seen with EV grown in LB. Error bars are SEM, n=4. | 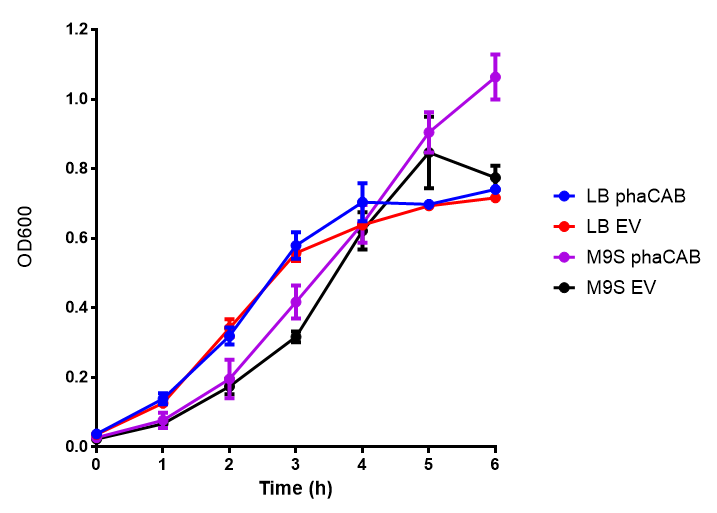 Cell growth over 6h in LB and M9S minimal media. LB grown MG1655 phaCAB grow more rapidly initially then M9S but after 5h, phaCAB in M9S continue to grow to a higher OD. EV shows a different trend, in M9S it levels off at a similar level to LB. Error bars are SEM, n=4. |
ANOVA analysis shows that the null hypothesis that there is no significant difference between M9M and LB in empty vector and phaCAB is true (F 3,24 = 0.8451, p < 0.4827). In addition to this the null hypothesis that there is no significant difference between M9S and LB similarly must be rejected as p > 0.05 (F 3,24 = 0.9802, p < 0.06009)
Plastic Toxicity Assays
L-lactic Acid
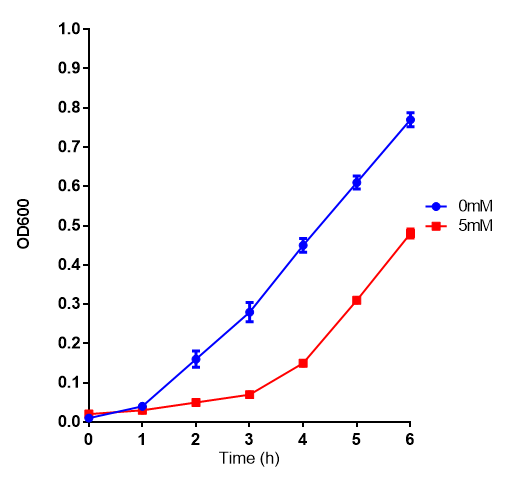
Cell growth of MG1655 on 5mM L-Lactic Acid. Error bars represents SE of the mean, n=4.
Ethylene glycol
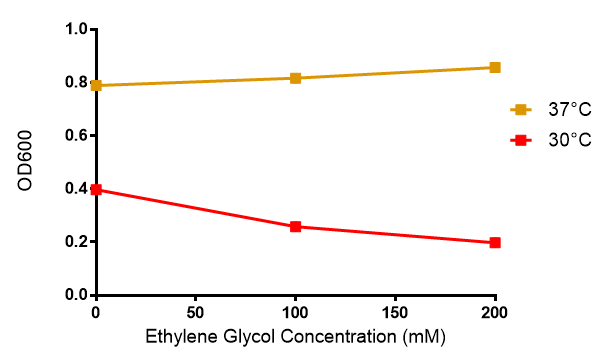
Cell growth of MG1655 in ethylene glycol, a byproduct of polyurethane degradation. Cells were grown in 0mM, 100mM or 200mM Ethylene Glycol at 30ºC. Error bars represents SE of the mean, n=4
Reduced growth at 30oC likely due to decreased efficiency of MG1655 ethylene glycol break down enzymes. These enzymes (see UC Davis 2012) are endogenously expressed and detoxify Ethylene Glycol.
3-hydroxybutyrate (3HB)
Acetoacetate
Poly(3-hydroxybutyrate) P(3HB)
Poly(lactic acid) (PLA)
Sole carbon source
3HB
Acetoacetate
Compiled sole carbon growth
phaCAB on M9 minimal and supplemented media
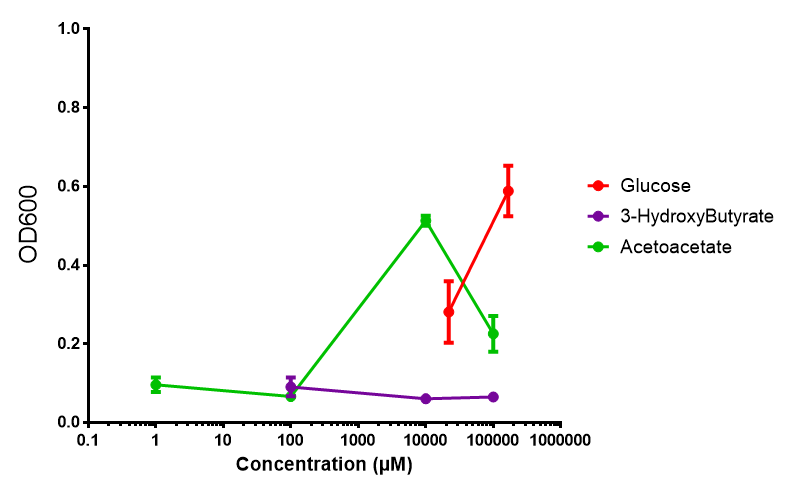 phaCAB growth in sole carbon sources under M9M | 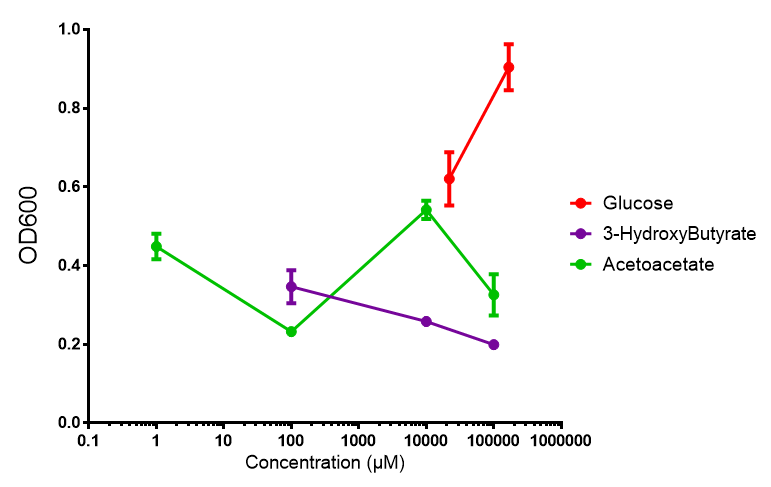 phaCAB growth in sole carbon sources under M9S |
phaCAB with novel promoter
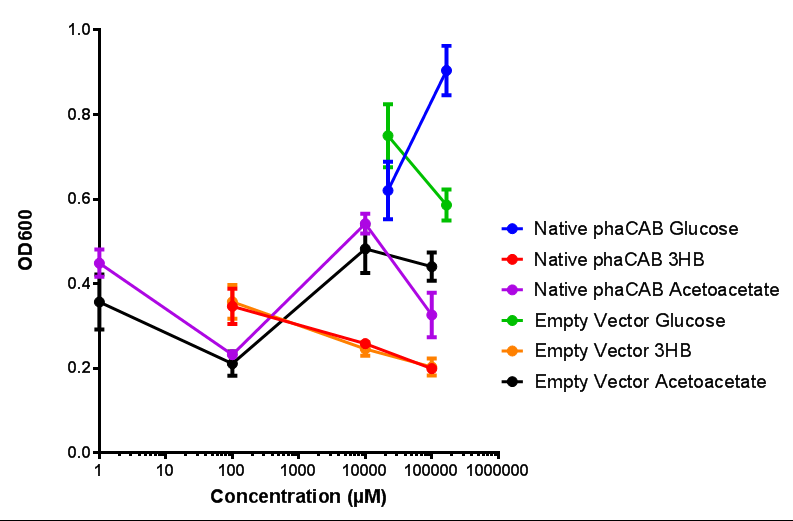 Native promoter in phaCAB growth in sole carbon sources under M9S | 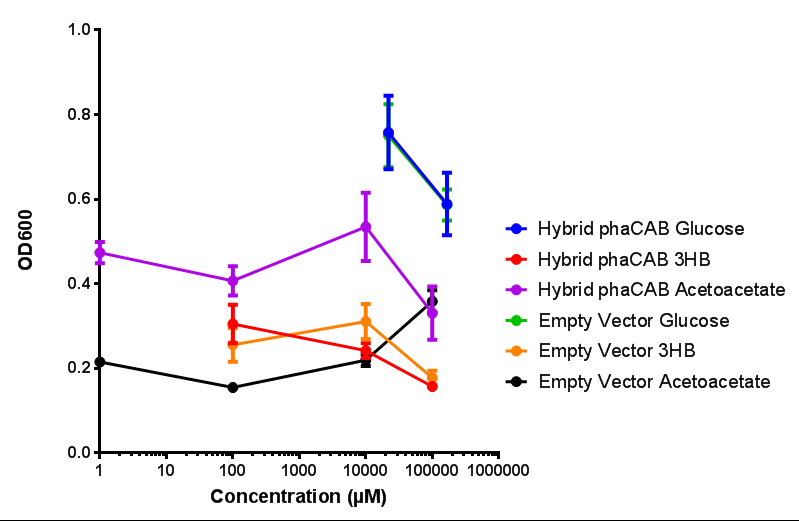 Hybrid promoter in phaCAB growth in sole carbon sources under M9S |
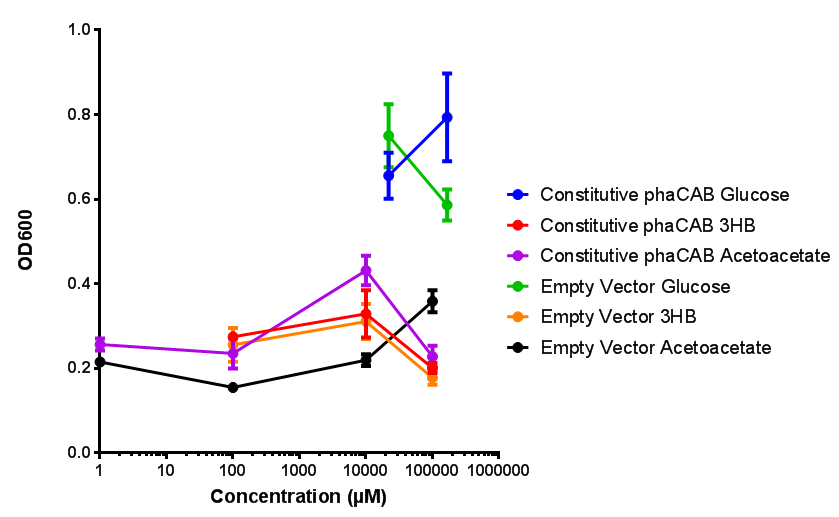 Constitutive promoter in phaCAB growth in sole carbon sources under M9S |
 "
"


.png)


.png)
_fluor.png)


.png)
.png)
.png)