Result
Result 1 Test the function of Riboregulator
We assembled BBa_K1087004 with mRFP to create [http://parts.igem.org/wiki/index.php?title=Part:BBa_K1087015 BBa_K1087015], band we assembled [http://parts.igem.org/wiki/index.php?title=Part:BBa_K1087015 BBa_K1087015] with RiboKey BBa_K145215 to create [http://parts.igem.org/wiki/index.php?title=Part:BBa_K1087021 BBa_K1087021].
[http://parts.igem.org/wiki/index.php?title=Part:BBa_K1087015 BBa_K1087015] 
[http://parts.igem.org/wiki/index.php?title=Part:BBa_K1087021 BBa_K1087021] 
Positive control 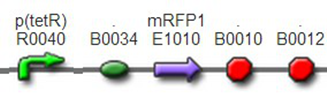
Negative control: BBa_J61046
We transformed [http://parts.igem.org/wiki/index.php?title=Part:BBa_K1087015 BBa_K1087015] and [http://parts.igem.org/wiki/index.php?title=Part:BBa_K1087021 BBa_K1087021] into E. coli DH5, respectively. And we used Ptet+mRFP1 (BBa_I13521) as positive control, irrelevant BBa_J61046 with no fluorescence gene as negative control.
All of the constructs were expressed in high copy plasmid PSB1X3.
The transformed cells were cultured in 37℃, 200rpm.
We used fluorescence microscope to observe the fluorescence at 16h, and we also used Thermo Varioskan Flash to quantitatively measure the fluorescence intensity at 16h, 18h, and 19h, respectively. 150ul culture fluid was added into each well of the 96-well black plate to measure the fluorescence intensity, and OD600 were measured using spectrophotometer at the same time one by one to quantify the concentration of bacteria.
Each sample had three duplicates when cultured. And the fluorescence value was handled through mathematical method.
The fluorescence intensity of above transformants was divided by the OD600 value and minus that of negative control.
Data Qualitative representation of Riboregulator 1, color change with time revealed the expression level of corresponding parts.
|
|
13h
|
14.5h
|
16h
|
17.5
|
19h
|
20.5h
|
|
5H1
|
white
|
light pink
|
pink
|
pink
|
pink
|
rose red
|
|
5H2
|
white
|
light pink
|
pink
|
pink
|
pink
|
rose red
|
|
5H3
|
white
|
light pink
|
pink
|
pink
|
pink
|
rose red
|
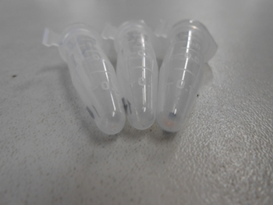
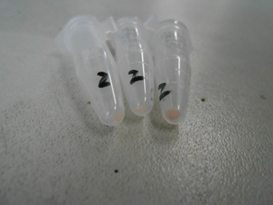
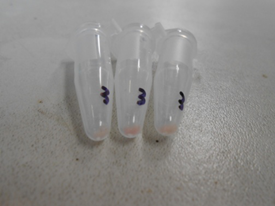

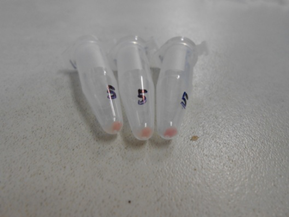
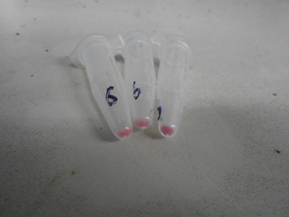
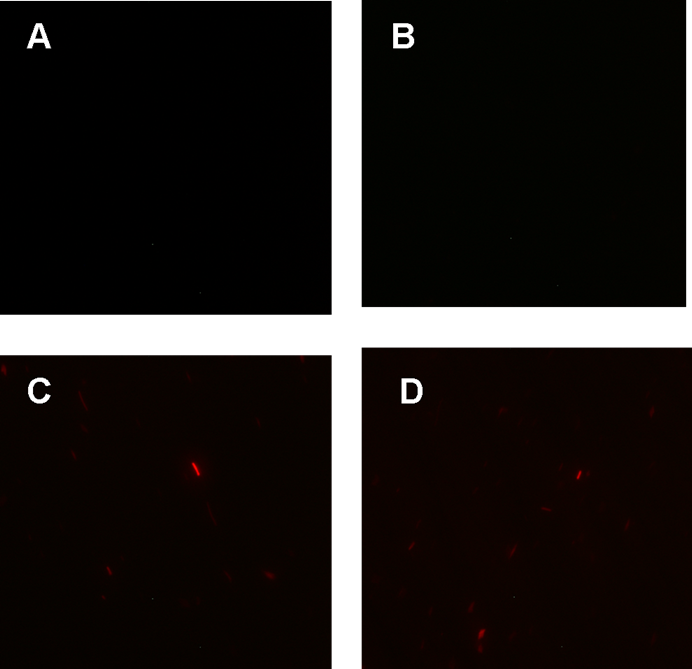
Figure 1. fluorescence observation using fluorescence microscope.
A. Negative control: Coletit DH5αtransformed with B Ba_J61046 in PSB1X3.
B. Coletit DH5αtransformed with [http://parts.igem.org/wiki/index.php?title=Part:BBa_K1087015 BBa_K1087015].
C. Coletit DH5αtransformed with [http://parts.igem.org/wiki/index.php?title=Part:BBa_K1087015 BBa_K10870]21.
D. Positive control: Coletit DH5αtransformed with B Ba_I13521.

Figure2. quantitatively measurement of the fluorescence intensity.
Red: Coletit DH5αtransformed with [http://parts.igem.org/wiki/index.php?title=Part:BBa_K1087015 BBa_K1087015].
Blue: Coletit DH5αtransformed with [http://parts.igem.org/wiki/index.php?title=Part:BBa_K1087015 BBa_K10870]21.
Black: Positive control: Coletit DH5αtransformed with B Ba_I13521.
PS: the fluorescence intensity of above transformants was divided by the OD600 value and minus that of negative control.
According to above figures, it’s obvious that the ribolock BBa_K1087004 worked well, and its fluorescence intensity was only 2.6531% compared to positive control even at 19h, while that of lock & key ([http://parts.igem.org/wiki/index.php?title=Part:BBa_K1087021 BBa_K1087021]) was 91.7138% at 19h. The results suggested that the key BBa_K145215 could hugely improve the expression level of the lock BBa_K1087004.
Data:
|
Fluorescence per OD
|
[http://parts.igem.org/wiki/index.php?title=Part:BBa_K1087015 BBa_K1087015]
|
[http://parts.igem.org/wiki/index.php?title=Part:BBa_K1087015 BBa_K10870]21
|
BBa_I13521
|
|
16h
|
0.089
|
6.8595
|
14.849
|
|
18h
|
0.486
|
16.011
|
18.363
|
|
19h
|
0.629
|
21.7435
|
23.708
|
|
percentage
|
[http://parts.igem.org/wiki/index.php?title=Part:BBa_K1087015 BBa_K1087015]
|
[http://parts.igem.org/wiki/index.php?title=Part:BBa_K1087015 BBa_K10870]21
|
BBa_I13521
|
|
16h
|
0.00599367
|
0.4619503
|
1
|
|
18h
|
0.026466264
|
0.871916354
|
1
|
|
19h
|
0.026531129
|
0.917137675
|
1
|
Result 2 Test the function of the Riboregulator and PhiR73 activator together
We assembled PO promoter with mRFP1 to create [http://parts.igem.org/wiki/index.php?title=Part:BBa_K1087018 BBa_K1087018],so that we can test the basal expression level of PO promoter.
We also assembled “TetR promoter + lock3d” with phiR73 activator to create [http://parts.igem.org/wiki/index.php?title=Part:BBa_K1087007 BBa_K1087007]. Then, we assembly [http://parts.igem.org/wiki/index.php?title=Part:BBa_K1087007 BBa_K1087007] with [http://parts.igem.org/wiki/index.php?title=Part:BBa_K1087018 BBa_K1087018] to create [http://parts.igem.org/wiki/index.php?title=Part:BBa_K1087022 BBa_K1087022].
Finally, we assembled RiboKey BBa_K145215 with [http://parts.igem.org/wiki/index.php?title=Part:BBa_K1087022 BBa_K1087022] to create [http://parts.igem.org/wiki/index.php?title=Part:BBa_K1087022 BBa_K108702]3.
[http://parts.igem.org/wiki/index.php?title=Part:BBa_K1087018 BBa_K1087018] 
[http://parts.igem.org/wiki/index.php?title=Part:BBa_K1087022 BBa_K1087022] 
[http://parts.igem.org/wiki/index.php?title=Part:BBa_K1087022 BBa_K108702]3 
We transformed [http://parts.igem.org/wiki/index.php?title=Part:BBa_K1087018 BBa_K1087018], [http://parts.igem.org/wiki/index.php?title=Part:BBa_K1087022 BBa_K1087022], and [http://parts.igem.org/wiki/index.php?title=Part:BBa_K1087022 BBa_K108702]3 into E. coli DH5α, respectively. And we used irrelevant BBa _J61046 with no fluorescence gene as negative control. The transformed cells were cultured separately in the same condition and measured fluorescence intensity at same time.
The measurement was done mainly the same as result 1.
Data Qualitative representation of Riboregulator 2, color change with time revealed the expression level of corresponding parts.
|
|
13h
|
14.5h
|
16h
|
17.5h
|
19h
|
20.5h
|
|
7H+22O 1
|
white
|
light yellow
|
light yellow
|
light yellow
|
light pink
|
light pink
|
|
7H+22O 2
|
white
|
light yellow
|
light yellow
|
light yellow
|
light pink
|
light pink
|
|
6I+3N+12G+23L+7H+22O 1
|
white
|
light yellow
|
light yellow
|
light yellow
|
light yellow
|
light yellow
|
|
6I+3N+12G+23L+7H+22O 2
|
white
|
light yellow
|
light yellow
|
light yellow
|
light yellow
|
light yellow
|
|
13J+6I+3N+12G+23L+7H+22O 1
|
white
|
light pink
|
light pink
|
light pink
|
pink
|
rose red
|
|
13J+6I+3N+12G+23L+7H+22O 2
|
white
|
Light pink
|
Light pink
|
Light pink
|
pink
|
Rose red
|
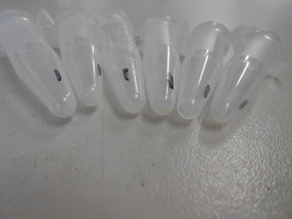
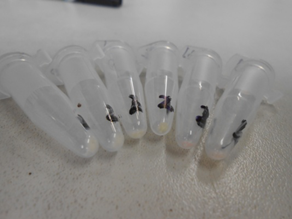
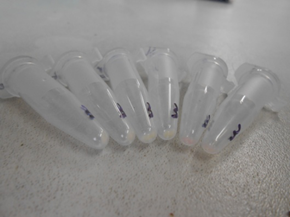
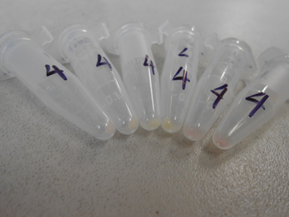
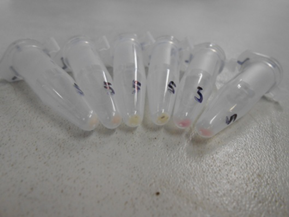
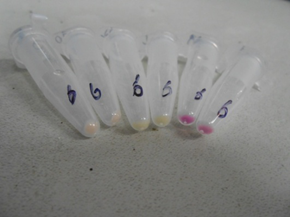
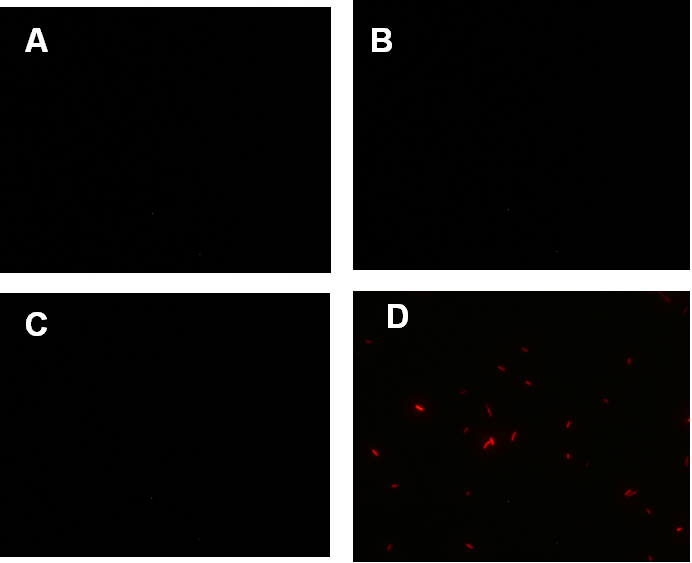
Figure 1. Figure 1. fluorescence observation using fluorescence microscope.
A. Negative control: Ecoli DH5αtransformed with BBa_J61046 in PSB1X3.
B. E. coli DH5αtransformed with [http://parts.igem.org/wiki/index.php?title=Part:BBa_K1087018 BBa_K1087018].
C. E. coli DH5αtransformed with [http://parts.igem.org/wiki/index.php?title=Part:BBa_K1087015 BBa_K10870]22.
D. E. coli DH5αtransformed with [http://parts.igem.org/wiki/index.php?title=Part:BBa_K1087015 BBa_K10870]23.
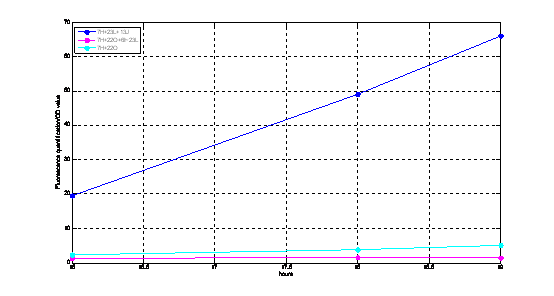
Figure2. Quantitatively measurement of the fluorescence intensity.
Blue: E. coli DH5αtransformed with [http://parts.igem.org/wiki/index.php?title=Part:BBa_K1087015 BBa_K10870]23.
Green: E. coli DH5αtransformed with [http://parts.igem.org/wiki/index.php?title=Part:BBa_K1087015 BBa_K10870]18.
Pink: E. coli DH5αtransformed with BBa_K108722.
PS: the fluorescence intensity of above transformants was divided by the OD600 value and minus that of negative control.
We could see clearly from above figures that the basal expression level of PO promoter was really low, and its strength could be improved about 11 times when induced by PhiR73 controlled by ribokey and lock.
Data:
|
Fluorescence per OD
|
[http://parts.igem.org/wiki/index.php?title=Part:BBa_K1087015 BBa_K10870]23
|
BBa_K108722
|
[http://parts.igem.org/wiki/index.php?title=Part:BBa_K1087015 BBa_K10870]18
|
|
16h
|
19.55141667
|
1.29
|
2.311
|
|
18h
|
49.09341667
|
1.5785
|
3.885
|
|
19h
|
66.099625
|
1.43575
|
5.043
|
|
fold
|
[http://parts.igem.org/wiki/index.php?title=Part:BBa_K1087015 BBa_K10870]23
|
BBa_K108722
|
[http://parts.igem.org/wiki/index.php?title=Part:BBa_K1087015 BBa_K10870]18
|
|
16h
|
8.460154334
|
0.558199913
|
1
|
|
18h
|
12.63665809
|
0.406306306
|
1
|
|
19h
|
13.1072
|
0.2847
|
1
|
Result 3 Test the function of Part BBa_K1087016 BBa_K1087016
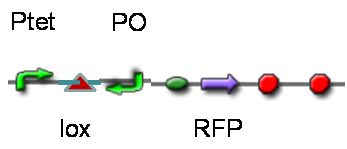
Normally, we picked two colonies from the agar plate for [http://parts.igem.org/wiki/index.php?title=Part:BBa_K1087018 BBa_K108701]6, called A and B. We transformed [http://parts.igem.org/wiki/index.php?title=Part:BBa_K1087018 BBa_K108701]6A and B into E. coli DH5, respectively. And we use Ptet+mRFP1(BBa_I13521) as positive control, irrelevant BBa_J61046 with no fluorescence gene as negative control. The transformed cells were cultured separately in the same condition and measured fluorescence intensity at same time.
The measurement was done mainly the same as result 1.
Data Qualitative representation of Riboregulator 3 , color change with time revealed the expression level of corresponding parts.
|
|
13.5h
|
15h
|
16.5h
|
18h
|
|
2-1
|
white
|
white
|
white
|
Light pink
|
|
2-2
|
|
3-1
|
Light pink
|
pink
|
Rose red
|
Rose red
|
|
3-2
|
|
4-1
|
white
|
white
|
Light pink
|
pink
|
|
4-2
|
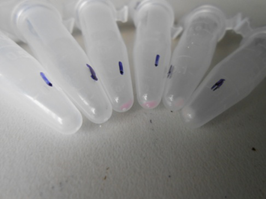
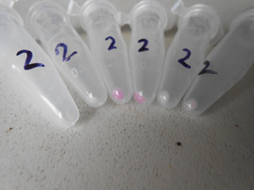
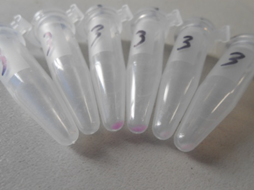
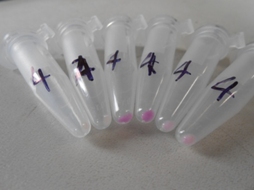
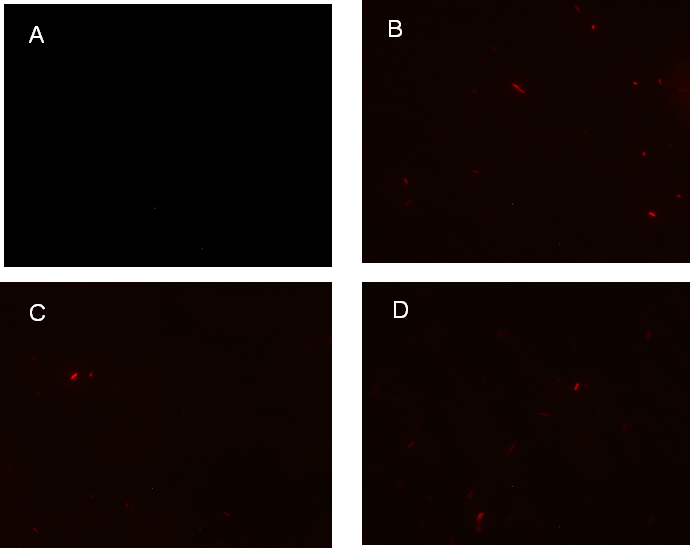
Figure1. fluorescence observation using fluorescence microscope.
A. Negative control: E. coli DH5αtransformed with BBa_J61046 in PSB1X3.
B. E. coli DH5αtransformed with [http://parts.igem.org/wiki/index.php?title=Part:BBa_K1087018 BBa_K108701]6A.
C. E. coli DH5αtransformed with [http://parts.igem.org/wiki/index.php?title=Part:BBa_K1087018 BBa_K108701]6B.
D. Positive control: E. coli DH5αtransformed with BBa_I13521.
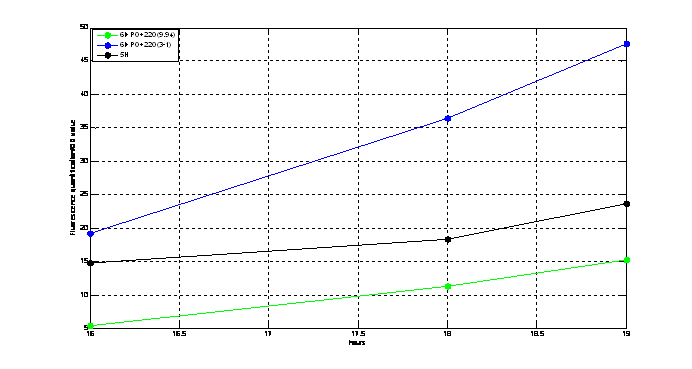
Figure2. Quantitatively measurement of the fluorescence intensity.
Blue: E. coli DH5αtransformed with [http://parts.igem.org/wiki/index.php?title=Part:BBa_K1087018 BBa_K108701]6A.
Black: Positive control, E. coli DH5αtransformed with BBa_I13521.
Green: E. coli DH5αtransformed with [http://parts.igem.org/wiki/index.php?title=Part:BBa_K1087018 BBa_K108701]6B.
PS: the fluorescence intensity of above transformants was divided by the OD600 value and minus that of negative control.
From above figures, we could conclude that the Ptet and mRFP1 in [http://parts.igem.org/wiki/index.php?title=Part:BBa_K1087018 BBa_K108701]6 worked well. It was comparable to even stronger than the positive control BBa_I13521 in fluorescence intensity. For [http://parts.igem.org/wiki/index.php?title=Part:BBa_K1087018 BBa_K108701]6A, it expressed about twice fluorescence of BBa_I13521. Results for sequencing suggested that the first half of the Ptet was lost in [http://parts.igem.org/wiki/index.php?title=Part:BBa_K1087018 BBa_K108701]6A, which may account for its increase in strength.
Data:
|
Fluorescence per OD
|
[http://parts.igem.org/wiki/index.php?title=Part:BBa_K1087018 BBa_K108701]6B
|
[http://parts.igem.org/wiki/index.php?title=Part:BBa_K1087018 BBa_K108701]6A
|
BBa_I13521
|
|
16h
|
5.4215
|
19.23766667
|
14.849
|
|
18h
|
11.37075
|
36.49133333
|
18.363
|
|
19h
|
15.27725
|
47.6205
|
23.708
|
|
fold
|
[http://parts.igem.org/wiki/index.php?title=Part:BBa_K1087018 BBa_K108701]6B
|
[http://parts.igem.org/wiki/index.php?title=Part:BBa_K1087018 BBa_K108701]6A
|
BBa_I13521
|
|
16h
|
0.365108762
|
1.295553011
|
1
|
|
18h
|
0.619220716
|
1.987220679
|
1
|
|
19h
|
0.644392188
|
2.00862578
|
1
|
| 
 "
"


