Team:SydneyUni Australia/Modelling Results
From 2013.igem.org


Running the Model
All enzyme concentrations were given a value of 0.1 mM. The temperature was set as T=298K. A plasma membrane distance of d=2nm was given. The cell concentration was given as 1E8 cells/mL. No cellular growth rate was implemented. Glycolate, ε, was left ‘unprocessed’, i.e. it is left to simply accumulate.
Using the constants above the flux took the value:
Assumptions
- All enzymes follow MM kinetics as described in the literature.
- The enzymes and metabolites are homogeneously distributed within the cell.
- The metabolites in the pathway are processed only by the proposed enzymes.
- The enzyme concentrations remain constant.
- The partition coefficient for DCA in octanol and water is approximately the same as the partition coefficient for the cell membrane.
- The cells only grow/divide through DCA-derived-glycolate.
- Diffusion can accurately follow
- All cells are of the same size (ie equal membrane surface area)
Raw MATLAB code:
function dy = nop450(t,y)

dy=zeros(6,1);

dy(1)= -6*(10^4)*0.0463067*(y(1)-y(2));
dy(2)= 6*(10^4)*0.0463067*(y(1)-y(2))-3.3*0.1*(y(2)/(0.53+y(2)));
dy(3)= 3.3*0.1*(y(2)/(0.53+y(2)))-0.0871*0.1*(y(3)/(0.94+y(3)));
dy(4)= .0871*0.1*(y(3)/(0.94+y(3)))- 0.6*0.1*(y(4)/(0.16+y(4)));
dy(5)= 0.6*0.1*(y(4)/(0.16+y(4))) - 25.4*0.1*(y(5)/(20+y(5)));
dy(6)= 25.4*0.1*(y(5)/(20+y(5)));

end
Raw MATLAB code for the pathway not involving p450
function dy = p450(t,y)

dy=zeros(5,1);

dy(1)= -6*(10^12)*0.0463067*(y(1)-y(2));
dy(2)= 6*(10^12)*0.0463067*(y(1)-y(2))-89.8*0.1*(y(2)/(7.2+y(2)));
dy(3)= 89.8*0.1*(y(2)/(7.2+y(2)))-0.6*0.1*(y(3)/(0.16+y(3)));
dy(4)= 0.6*0.1*(y(3)/(0.16+y(3))) - 25.4*0.1*(y(4)/(20+y(4)));
dy(5)= 25.4*0.1*(y(4)/(20+y(4)));

end
Raw MATLAB code for the pathway involving p450
Output:
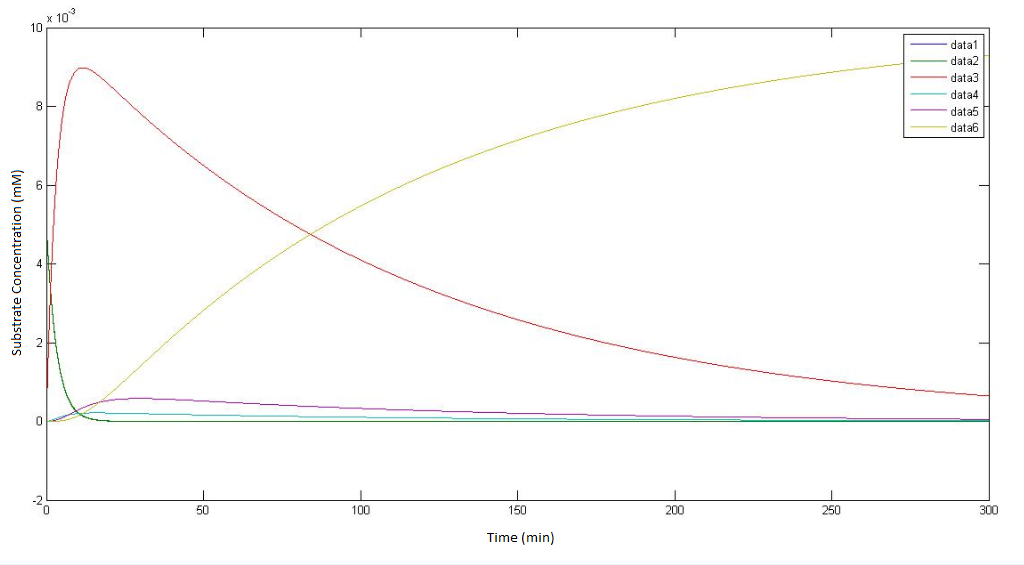
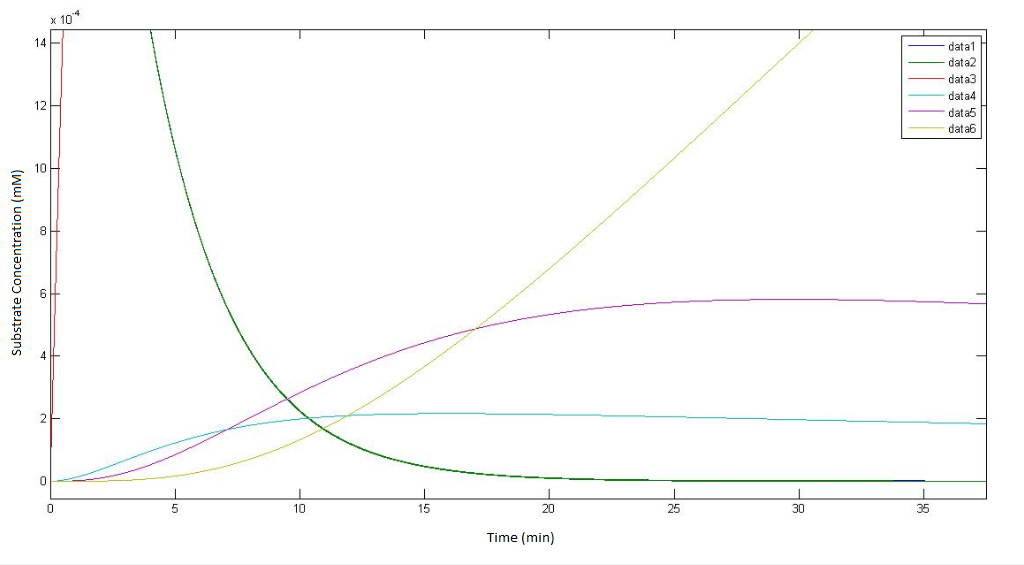
The output of the raw MATLAB code for the pathway not involving p450 which depicte how the concentrations of each metabolite change over time.
Regarding the figure legends with in the graphs themselves data 1, data 2, data 3, data 4, data 5 * data 6, represents the concentration of the metabolites αin, αout, β, γ, δ & ε respectively.
References:
[1] Krooshof, G. H., I. S. Ridder, et al. (1998). "Kinetic Analysis and X-ray Structure of Haloalkane Dehalogenase with a Modified Halide-Binding Site†." Biochemistry 37(43): 15013-15023.
[2] Janecki, D. J., K. G. Bemis, et al. (2007). "A multiple reaction monitoring method for absolute quantification of the human liver alcohol dehydrogenase ADH1C1 isoenzyme." Analytical Biochemistry 369(1): 18-26.
[3] Pandey, A. V. and C. E. Flück (2013). "NADPH P450 oxidoreductase: Structure, function, and pathology of diseases." Pharmacology & Therapeutics 138(2): 229-254.
[4] van der Ploeg, J., Shmidt, M. P., Landa, A. S., and Janssen, D. B. (1994). "Identification of Chloroacetaldehyde Dehydrogenase Involved in 1,2-Dichloroethane Degradation." Applied Environmental Microbiology (60(5): 1699-1605.
[5] van der Ploeg, J., van Hall, G., Janssen, D. B. (1991) "Characterization of the haloacid dehalogenase from Xanthobacter autotrophicus GJ10 and sequencing of the dhlB gene." Journal of Bacteriology 173(24):7925-33.
[6] Sinensky, Mi “Homeoviscous Adaption – A Homeostatic Process that Regulates the Viscosity of Membrane Lipids in Escheria coli” Proceedings from the National Academy of Science 71(2): 522-525.
[7] CyberCell Database
 "
"


