Team:ETH Zurich/Modeling/Reaction Diffusion OOHL
From 2013.igem.org
Contents |
AHL: Reaction-diffusion equations
Modeling the AHL diffusion-reaction is a vital aspect of our biogame, because it plays an important role in determining the geometry of the game field and the timing. Thus, we evaluate if a suitable AHL gradient can be formed with the experimental setup we had in mind.
Video: 2D gradient formation over 24 hours, starting from AHL steady state concentration in the mine colonies.
Display: AHL concentration in mol/m3. Distance between colonies: 1.5 cm.
To explain how the concentration of AHL changes over time and space, we implemented a reaction-diffusion model. AHL concentration changes under the influence of two processes: (i) local chemical reactions and (ii) diffusion which causes the molecule to spread radially over the agar plate. (Eq. 1).
\begin{align} \frac{\partial [AHL](\textbf{z},t)}{\partial t} = Diff([AHL](\textbf{z},t),\textbf{z}) + R([AHL](\textbf{z},t)) \end{align}
Equation 1: General partial differential equation for AHL reaction-diffusion in 2D. $Diff([AHL](\textbf{z},t),\textbf{z})$ is the diffusive term, and $R([AHL](\textbf{z},t))$ accounts for all local reactions with $\textbf{z}=(x,y)$.
For diffusion, we have a partial differential equation (Eq. 2) which describes density fluctuations over time and space ($\textbf{z}=(x,y)$). We do not model AHL diffusion in and out cells explicitly; the underlying assumption is that this process is fast or that the molecule diffuses freely. In equation 2, $D_{AHL}([AHL](\textbf{z},t),\textbf{z})$ denotes the collective diffusion coefficient for AHL at location $\textbf{z}$. However, we assume that the diffusion coefficient is both anisotropic and independent of location, i.e., $D_{AHL}$ is a constant. The value reported in the literature for the diffusion constant corresponds to measurements performed in water at 25oC. As the AHL in our system diffuses in agar, we scaled the diffusion constant by a factor $C_{agar}$ (Fatin-Rouge et al., 2004). If plates are incubated at 37°C, the diffusion constant can also be adjusted using the Stokes-Einstein equation.
\begin{align}
Diff([AHL](\textbf{z},t),\textbf{z}) = \nabla \cdot \left(D_{AHL}([AHL](\textbf{z},t),\textbf{z}) \nabla [AHL](\textbf{z},t)\right)\\
\end{align}
\begin{align}
Diff([AHL](\textbf{z},t),\textbf{z}) = C_{agar} \cdot D_{AHL} \nabla^{2} [AHL](\textbf{z},t) \\
\end{align}
Diffusive term for AHL. $\textbf{z} = (x,y) $
For the reaction component, the change of AHL concentration over time is modeled by a set of ordinary differential equations (ODEs), that includes the production and linear degradation or decay. However, the types of reactions that take place depend on the localization, i.e. extracellular or cytoplasmic. In the case of cytoplasmic localization, we have to further distinguish between the two type of cells encountered in our system, sender cells and receiver cells. Mine cells synthesize the signalling molecule, the synthesis of which depends on the product of luxI gene, while for the degradation we assumed a linear dependency on the molecule concentration. For the receiver cells only linear degradation takes place, and we assume that it is under the same rate as in mine cells. However, for the extracellular decay we consider that AHL degrades at a different rate, because the intracellular process is driven by enzymatic degradation, whereas the extracellular decay is a passive process. Furthermore, we include a dilution factor to account for cell growth. It is modeled using the logistic equation (Eq. 3) with a growth rate obtained from our own experiments.
\begin{align} R([AHL](\textbf{z},t))_{MineCell} = DF \cdot \left(\alpha_{AHL} \cdot [LuxI](\textbf{z},t)-d_{AHL,i} \cdot [AHL](\textbf{z},t)\right)\\ \end{align} \begin{align} R([AHL](\textbf{z},t))_{ReceiverCell} = DF \cdot \left(-d_{AHL,i} \cdot [AHL](\textbf{z},t)\right)\\ \end{align} \begin{align} R([AHL](\textbf{z},t))_{plate} = -d_{AHL,e} \cdot [AHL](\textbf{z},t)\\ \end{align} \begin{align} DF =\frac{N_{0} \cdot N_{m} \cdot e^{k \cdot t} }{N_{m}+N_{0} \cdot [e^{(k \cdot t)}-1]}\\ \end{align}
Reaction term for AHL. $DF$ is the dimensionless dilution factor, where $N_{0}$ is the initial concentration and $N_{m}$ is the carrying capacity (scaling factor, $N_{m} = 1$).
Finally, we need to specify initial conditions (at time $t = 0$) and boundary conditions. At the starting point there is no AHL in the agar plate, thus the initial concentration is zero ($[AHL](\textbf{r},t) = 0 M$) for receiver colonies and in the agar plate. However, the initial concentration in the mine colonies was set to the steady state concentration, which was obtained from a single cell model. For the boundary condition, we take into account that there is no flux out of the agar plate.
\begin{align} \frac{d[AHL](r=R,t)}{dr}=0\\ \end{align} \begin{align} r=\sqrt[]{x^2+y^2}\\ \end{align}
Neumann (no flux) Boundary Condition.
Maximum Concentration of AHL at the Sender Colonies
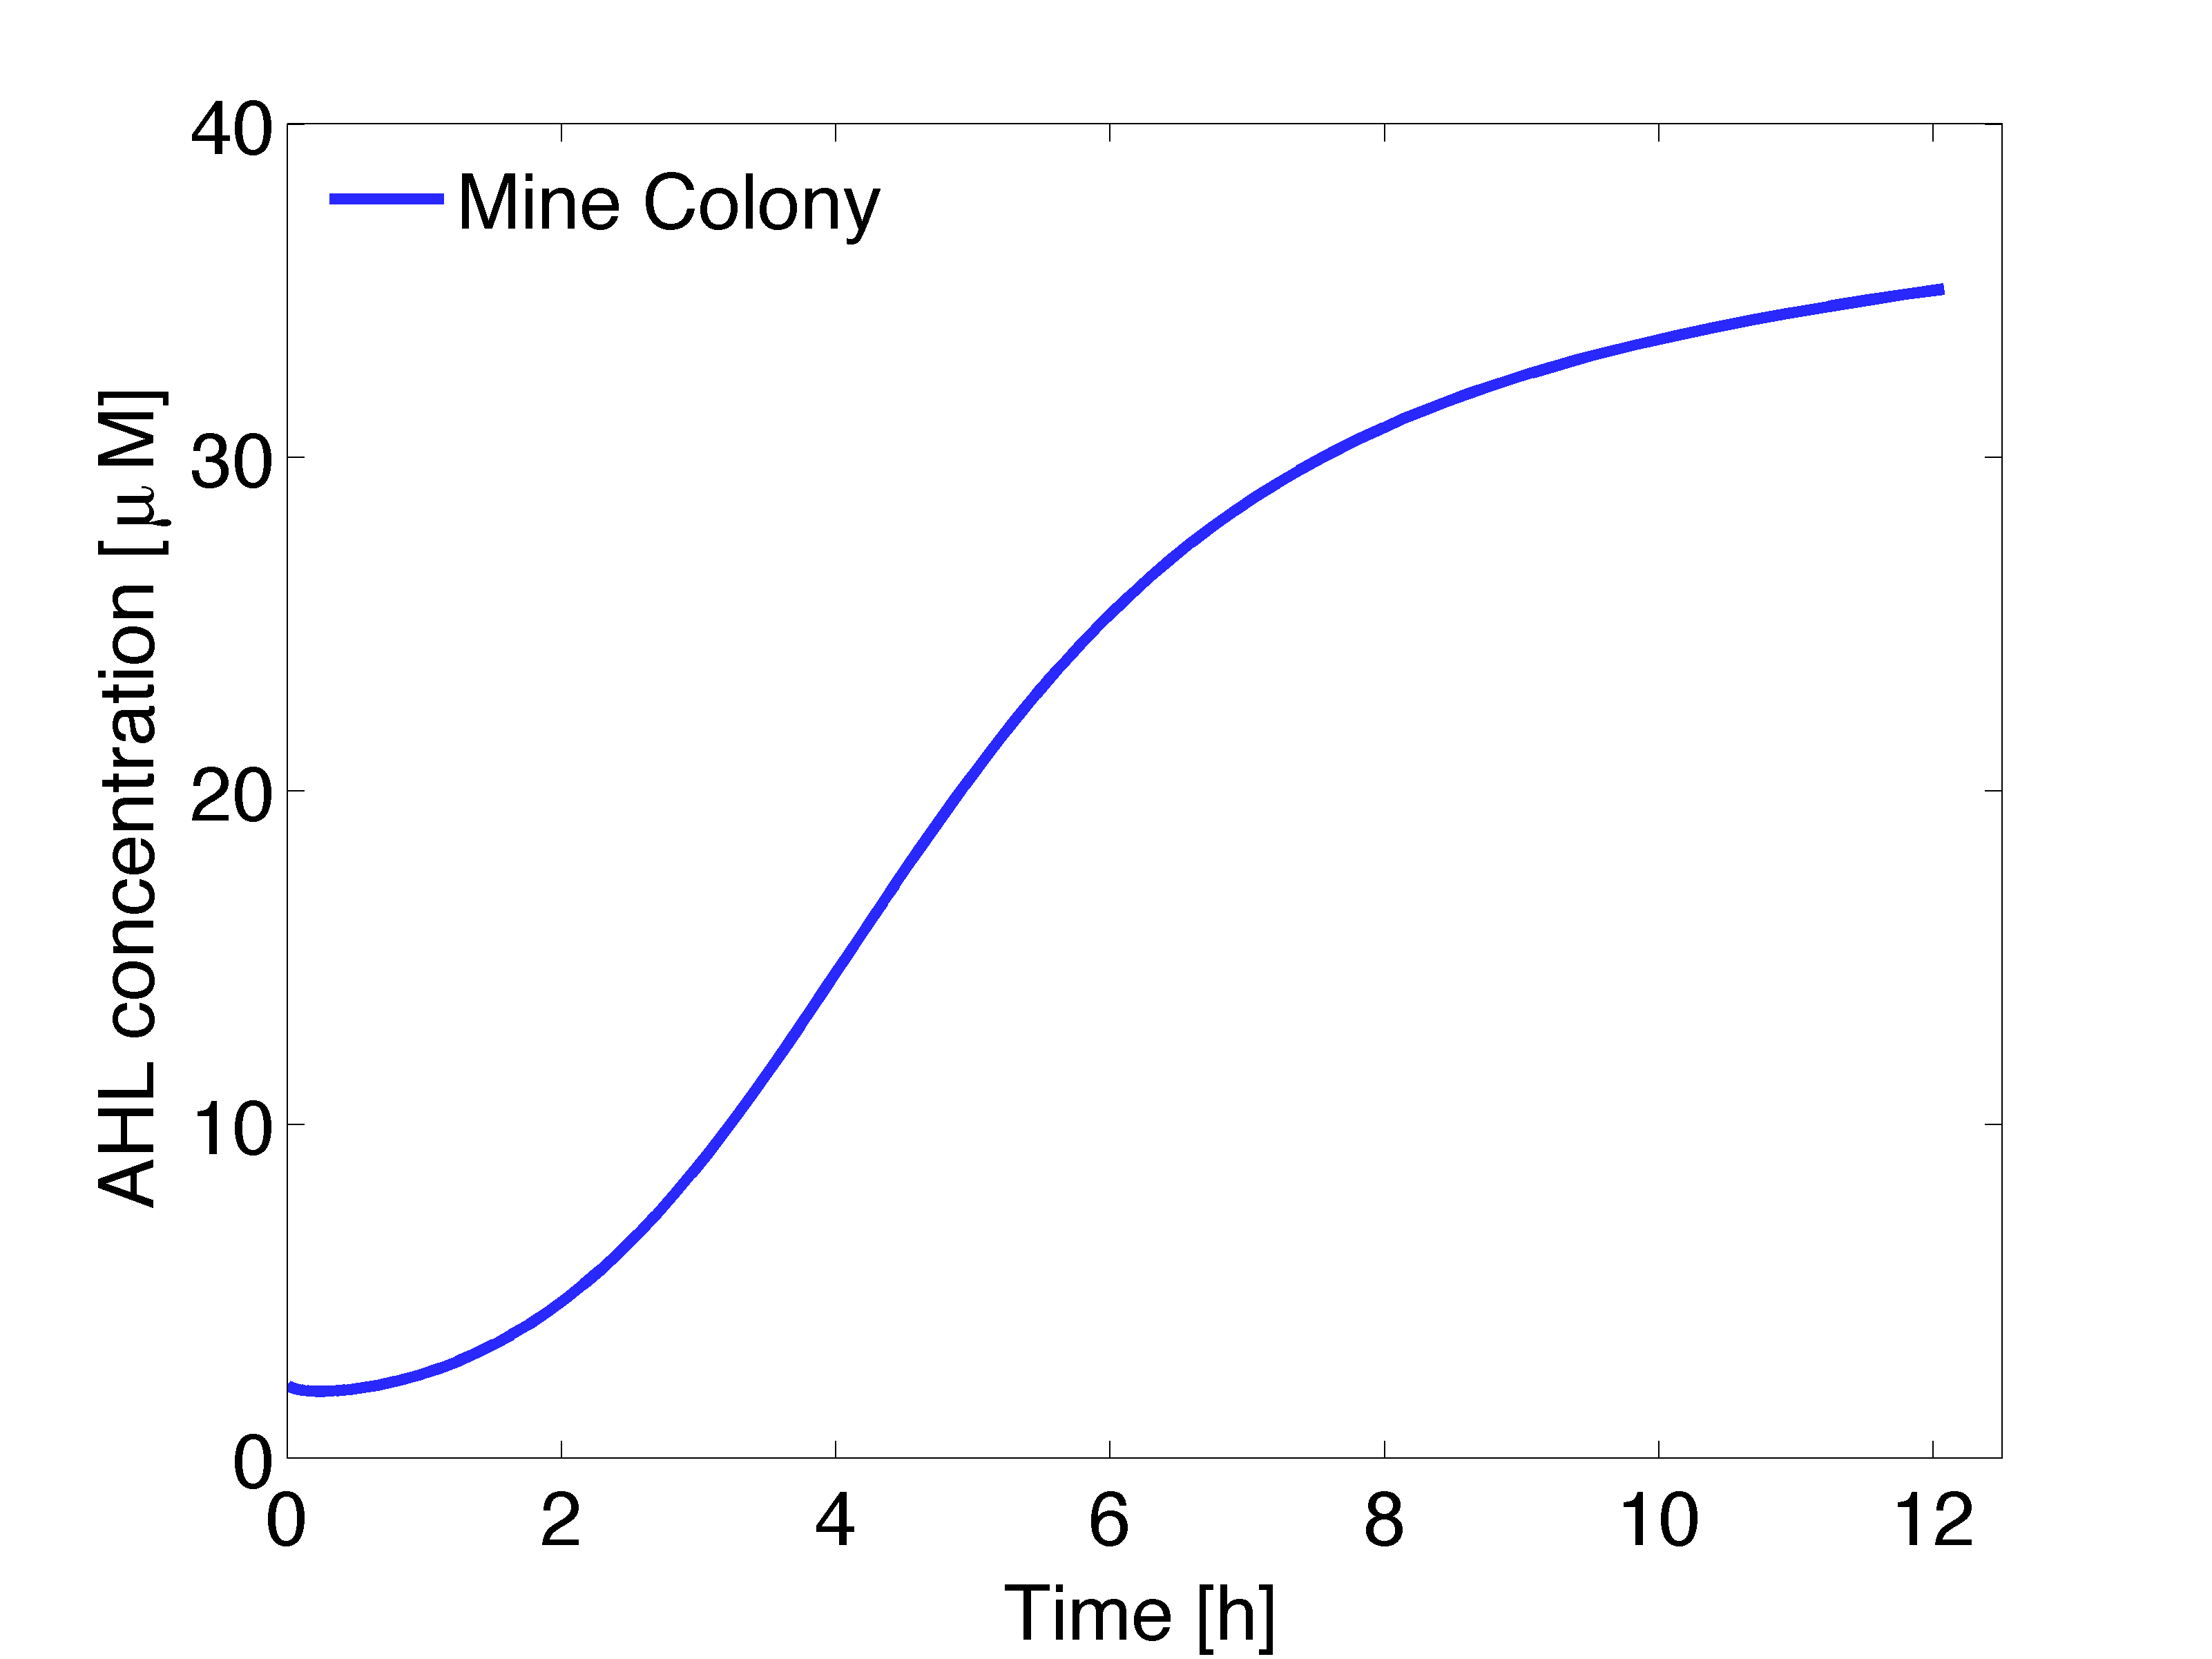
Additionally, we wanted to account for a possible slow-down of AHL production by mine colonies, to evaluate what would happen if senders cannot synthesize more AHL than a certain maximum and analyze the effect on the output as it will be presented later (visualization of AHL by triggering production of GFP). To do so, we only need to modify the expression for the reaction term in mine colonies as it follows:
\begin{align} R([AHL](\textbf{z},t))_{MineCell} = DF \cdot \left(\alpha_{AHL} \cdot [LuxI](\textbf{z},t) \cdot \frac{1}{1+\frac{[AHL](\textbf{z},t)}{K_{I}}}-d_{AHL,i} \cdot [AHL](\textbf{z},t)\right)\\ \end{align}
RESULTS: Simulation
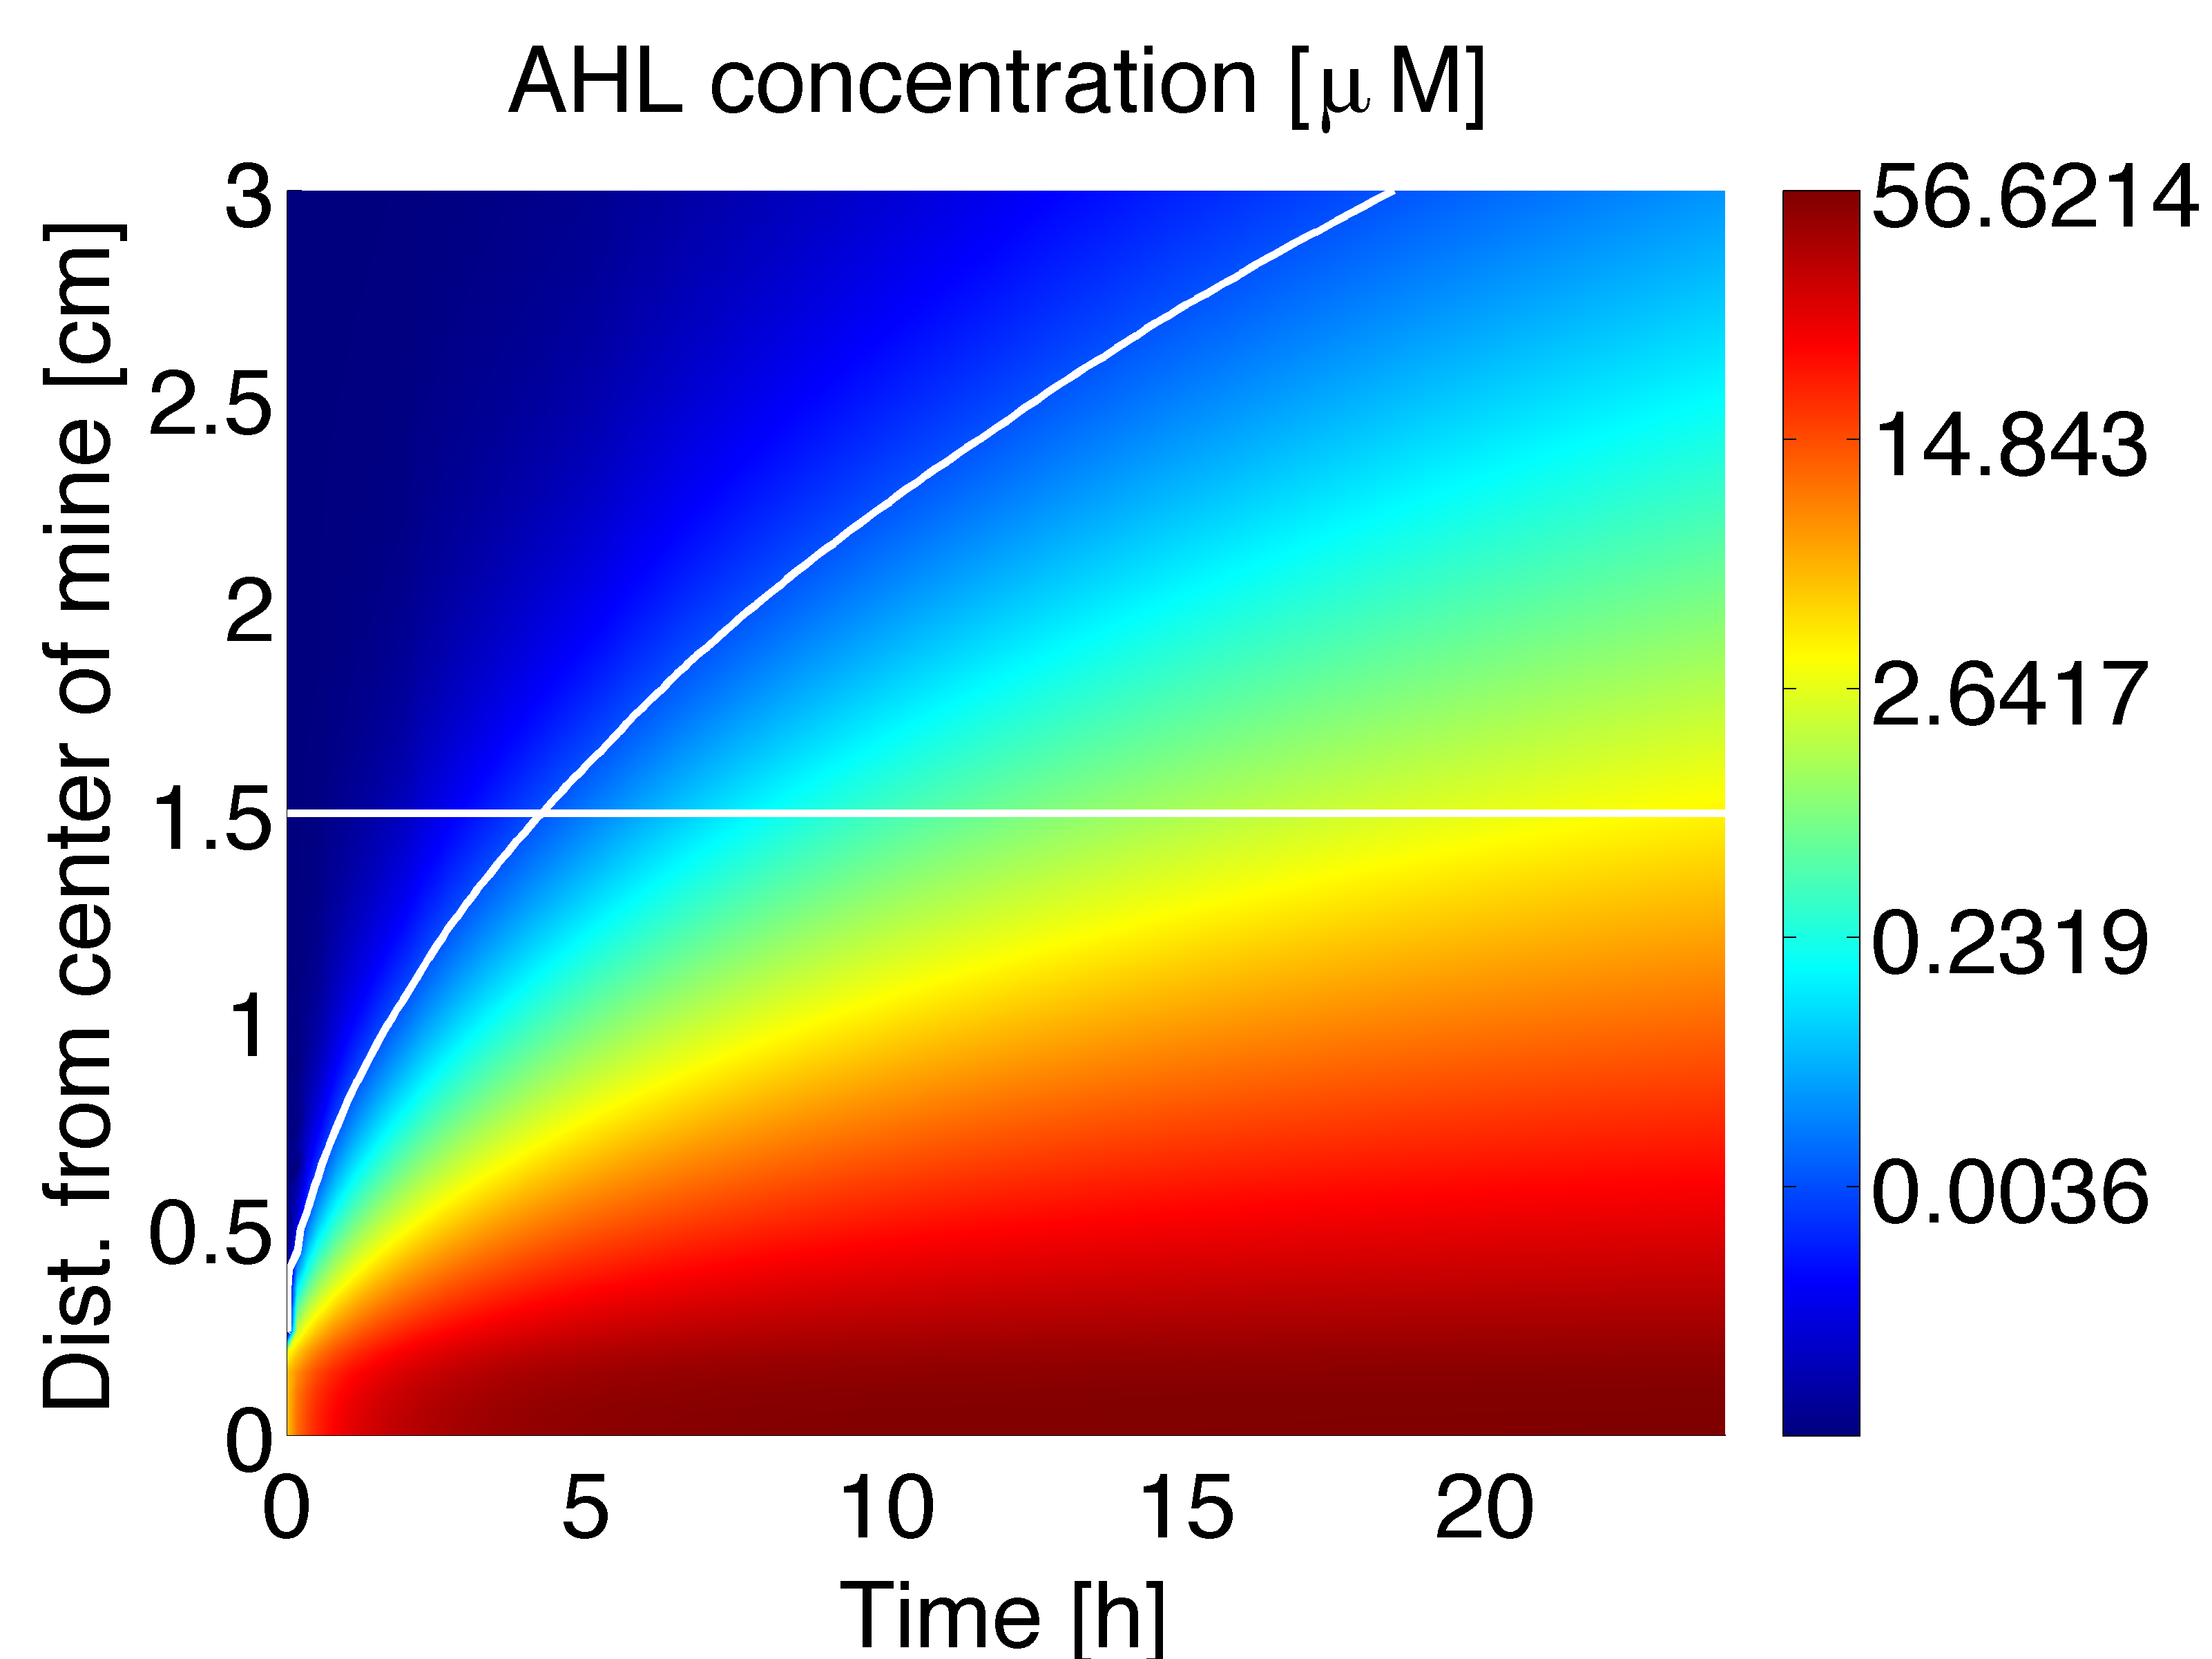
The AHL gradient established by a single colony can be obtained from a two dimensional model. Simulations were conducted to obtain the dynamics (Fig 1) and the stationary solution (Fig. 2). Figure 1 shows the AHL gradient that can be formed by a single mine colony over time (x-axis) and distance (y-axis), the colour scheme refers to AHL concentration in μM. The steady state concentration versus distance for AHL concentration derived from the 2D spatio-temporal model is shown in Figure 2; the stationary solution is achieved after around 60 hours.
In figure 3 is shown the time course of the averaged concentration of AHL at colonies surrounded by 0, 1, 2 or 3 mine colonies, with a distance of 1.5 cm between colonies. Important conclusions can be drawn from this results. Before 5 hours it is expected to have non-differential activation due to LuxR/AHL binding to PLuxR, because the AHL concentration at the receiver colonies is nearly the same independent of the number of neighbouring mine colonies. This prediction can be supported by the intersection of the 50% PLuxR promoter activity curve and the distance between the colonies in figure 1, which corresponds to 4.5 h. After 6-7 hours the difference in activation due to LuxR/AHL complex should start to be significant and remain over time. However after 18 hours, colonies that are further apart from mine colonies start to be exposed to significant concentrations of AHL.
The model predicts that mine colonies are able to generate a suitable gradient by synthesizing AHL at a sufficient rate to overcome the decay and the active degradation; the gradient is suitable because receiver colonies are exposed to different concentrations of AHL, depending on the number of adjacent mine colonies.
Thus, for the design of the game grid, model and diffusion experiments lead to
- a working geometry (hexagonal honeycomb),
- working distances (1.5 cm between colonies) and
- feasible timing (11 hours incubation for the plates).
RESULTS: Model incorporating inhibition
Trying different values for $K_I$ we can obtain different production profiles over time in the mine colonies. However, qualitatively we have the same output as it will shown later (visualization of AHL by triggering production of GFP).
Growth curve fitting
The estimation of the growth rate parameter was carried out using non-linear regression. The optical density measurements were conducted in triplicate over 17 hours, results are shown in figure 4 and 5. The growth rate was incorporated in the model in the dilution factor.
 "
"


