"
"
Team:Leeds/Results
From 2013.igem.org
 | |||||||
| | | | | ||||
 | Results from the lab so far. Please note, many of the images have been uploaded at high resolution, and are best viewed from their file page. Access this by clicking the image (where available). Different viewing options may be made availalbe, but this is dependent upon Coffee-Induced coding by the Code Monkey.
Bacterial growth curvesWe are monitoring the growth of our bacteria containing our devices to see if the genes we inserted have any effect on bacterial growth. Control Bacterial Growth Curve To kickstart lab work for Leeds's first-ever iGEM team, we performed this straightforward experiment in which cells were grown in SB media both in the presence and absence of chloramphenicol. Absorbance measurements taken over time show the growth of the bacteria. Clear lag and log phases are observed when the bacteria are grown in SB media only. But as expected, the graph shows that the bacteria do not grow in the presence of chloramphenicol. This graph was use as a control to compare with device-containing bacteria in order to determine whether the genes we inserted caused an effect on cell growth.
Characterisation of Device 1Growth Curve Bacteria were grown which contained Device 1; their absorbance was monitored over time and then the rate of growth compared to bacteria that do not contain Device 1. The graph clearly shows that inserting Device 1 into cells considerably slows their growth in log phase compared with the growth of cells without Device 1, that the lag phase is shorter, and that the cells don't grow to as high an optical density in log phase as the bacteria without Device 1.
Membrane Stress Investigation of literature regarding the action and regulation of the Cpx pathway lead to the discovery that the system as a whole responds to a large variety of membrane stresses, something that could be true of the specific promoter we chose to use (pCpxR). We therefore sought to investigate the response of our promoter to each individual membrane stress. Individually many of the experiments produced erratic and seemingly random data which is listed independently below. However plotting all average readings together shows that there is a dramatic increase in response to the stress induced by the silica beads relative to all chemically induced membrane stresses tested. This indicates that it would be possible to detect the presence of silica beads in solution, in principle, using our binding and detection system. This was certainly successful when silica beads were present at relatively high concentrations. However further work needs to be done to assess whether this high response remains across a range of silica bead concentrations in solution. In light of these results, additional experiments were conducted to gain further information in which cells were exposed to the stresses of ethanol, Triton X-100 and pH gradients. In this second experiment, a robotic pipette was used to directly fill the 96 well plate to reduce human error, the raw data of which can be found here. Excluding wells with imposed pH gradient, all wells were kept at pH 7 using Tris.HCl buffer, the pH gradient was also achieved with a Tris.HCl buffer. The 96 well plates (200 microliters/well), prepared with the chemical stressors, were inoculated with 20 microliters of overnight cell culture expressing Device 1 and incubated with shaking for 2 hours at 37 degrees. We also performed preliminary investigation on the effects of temperature extremes on the CpxR promoter but the results were inconclusive and thus warrant further studies, possibly by future Leeds iGEM teams. Listed below is the data for detergent and pH extremes. We note that the response of the Cpx pathway to temperature has been characterized previously in the literature and by Calgary 2010.
Triton X-100 Between the concentration values of 0.1-9.0% triton X-100, the data shows roughly the relationship that was expected, a rise in GFP production as the triton concentration increases. This is likely due to triton acting as a detergent resulting in damage to the plasma membrane of cells, activating the Cpx pathway in general, including the CpxR promoter (pCpxR). Past 10% Triton X-100 concentration, it is assumed that cells are dying in large quantities, being unable to produce GFP at all or in very limited amounts before they are killed. This explains the corrected fluorescence readings reducing to below zero. The reason for the large spike in fluorescence at Triton concentrations >20% is unclear, a possible explanation for this is the total lysis of the cell, expelling all cellular components resulting in background GFP levels having a larger fluorescence reading due to reduced scattering from within the cell. It is most important to note that this is preliminary data, from fluorescence based measurments, hence it is expected that with sufficiently high repeat readings, the trends proposed will clarify further. This would again be suggested extension work for future teams.
pH Effects The slight fluctuations across the pH scale are in line with the background fluorescence readings from our cell cultures, representing the standard levels of cpx activation as the cells collide, disperse in solution and divide during replication. The higher levels of expression at both low and high pH are likely to be due to the pH extremes denaturing proteins and disrupting interactions within the plasma membrane. It could be assumed that pH’s further into the extremes of acid and base would completely lyse and kill the cells resulting in a possibly lower fluorescence.
Membrane Stress - (Fluorescence) Atomic Force Microscopy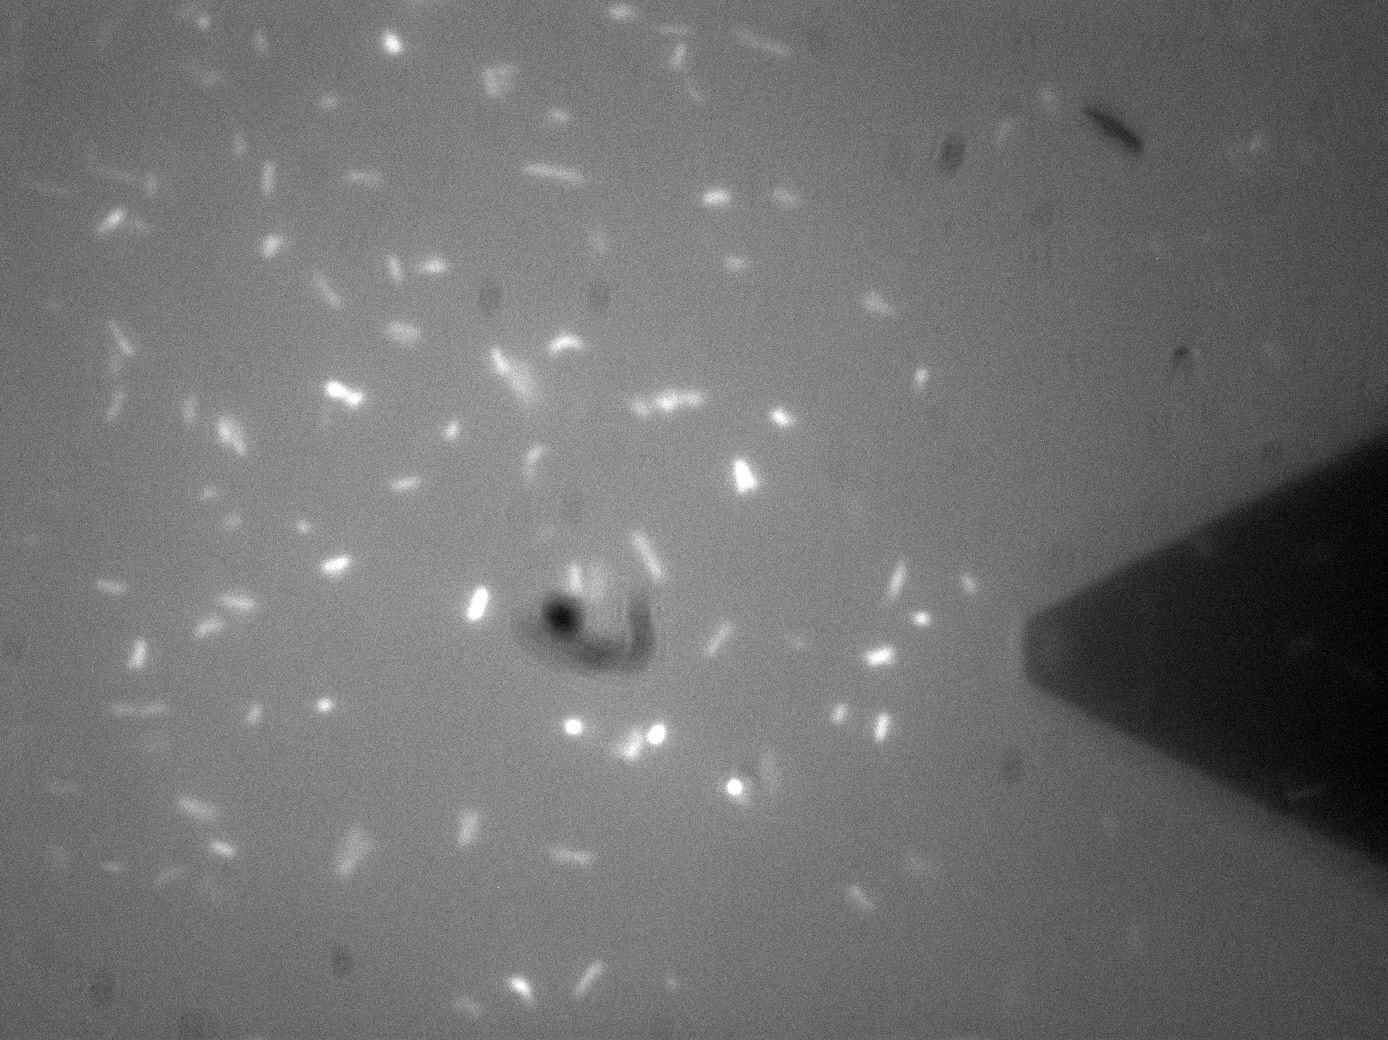 Atomic Force Microscopy utilises Van-Der-Waals forces to attract the tip towards a surface, causing the bending of a cantilever, onto which a laser is pointed. The tip deflection causes the laser light to also be deflected and this is tracked using a bank of photodiodes. AFM is typically used to image surfaces at the atomic scale, as well as for Force Spectroscopy. When used in Force Spectroscopy, the tip is brought into direct contact with the sample, allowing the sample protein to bind to the silicon tip. Then, the AFM is slowly retracted at varying speeds or to varying distances, applying a force to the protein. This causes portions of the protein to unravel, and the distinct patterns associated with α-helices and β-pleated sheets can be seen in this data. This allows the exact secondary and tertiary structure of a protein to be determined, but also the energy profile of various conformations, which in turn tells us how the protetin folds. For Bio-Device 1 however, the team wanted to measure how much force was required to trigger the stress activated Cpx Pathway. This was to be done by observing the culture under the fluoroscope portion of the F-AFM, and then "prod" a bacterium at a low force, slowly increasing the stress until a fluorescence response was seen. This would then give a direct measure of the stress threshold for Cpx, a value currently unknown in the literature. This is however, distinctly more difficult that it sounds. Firstly, it can be seen from the image that the culture were already fluorescing a little, likely due to smaller stresses in solution, although some can clearly be seen in the middle of binomial fission, which is known to also activate the pathway. The other issue was with trying to keep the bacterial cells stable enough to continually poke them with AFM tip. Normally, this sort of experiment is typically performed at the Univ of Leeds AFM facility on Giant Unilamellar Vesicles and microbubbles about 5 microns wide. These microstructures are naturally forming precursors to cells, and thus of great interest to bio-physicists. However, as trying to poke a structure 5 microns wide with a tip only 40nm at its widest is akin to throwing a needle from space onto a ship in the Atlantic ocean, experimenters usually adhere the bubbles to the surface with a binding peptide. This could not be done for Bio-Device 1 without potentially triggering the pathway, so instead, it was hoped a more viscous solution and some micro-troughs scratched into the glass slide surface would be enough to keep them steady. Again though, bacteria are very different to inert bubbles of lipids, and tend to forcibly move themsleves regardless, hence results remained inconclusive. The approach showed some promise however, and it is hoped further work will be undertaken on this at a later date. The presence of background fluorescence in this experiment agrees with fluorescence confocal data and previous literature suggesting that the pCpxR promoter is active during early and mid-log phase of cell growth (cell division). Again, we are interesting in the possibility of using evolutionary development techniques to mutate a variant promoter, specific for MicroBeagle activity, with a higher threshold stress tolerance than the native Cpx promoter. Other extensions to this work would be in use of characterising the binding domain strengths of MicroBeagle, and we hope other teams may seek to use similar methods in future.
Characterisation of Si4 silica-binding oligo-peptideGrowth Curve Here the growth of cells expressing INP-displayed Si4 was monitored via absorbance and compared to the growth of cells that do not contain Si4. As was seen when device 1 was inserted into the cells, the growth is slowed down considerably. Although the graph shows a log and a lag phase for the cells expressing INP-Si4, the absorbance reached in log phase is very low compared to cells without Si4; it is even lower than the absorbance reached for cells containing Device 1.
Characterisation of Device 2Growth Curve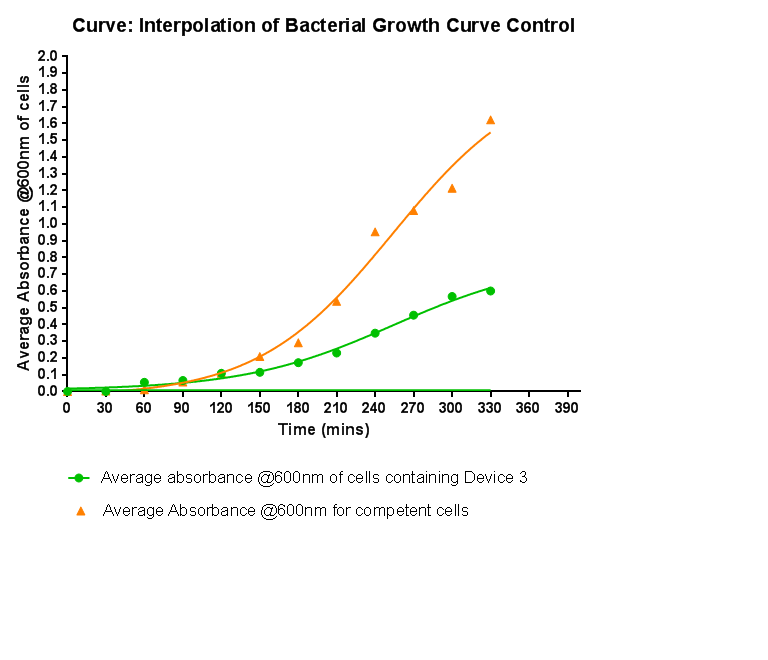 This graph shows the results of monitoring the growth of cells with expressing Device 2. As with other hetereologous expression experiments, growth of the cells is considerably slowed when compared with cells that do not contain any device at all. A slight change in the gradient of the graph can be seen showing the transition of the cell growth from lag to log phase, so the cells are still growing normally, but the insertion of Device 2 is restricting rate of cell growth and final density acheived. We propose that this is due to the increased energy and nutrient requirements to produce the inserted structures.
Confocal Microscopy 
Device 2 containing INP+Si4 along with Cpx and a Green Fluorescent Protein (GFP) coding region were incubated with silica beads of 5 micron diameter. The following images were taken with a confocal microscope. In the images containing the cells, it can be clearly witnessed that GFP is produced. This could be either due to direct binding of the Si4 peptide to the silica beads, or through other elements of stress, such as cell division and cellular movement. Certain cells produced significantly higher amounts GFP, culminating in the increased brightness of fluorescence in the images. This is apparent at instances when a cell appears to have bound to the silica bead. Most of the cells, however, failed to successfully associate with the silica beads present in solution. To this effect, it can be suggested that the Si4 polypeptide is perhaps not as efficient at interacting with the surface of the silica beads or that expression under the chosen promoter was lower than expected. In certain cases, the fluorescence yield from the GFP molecules was reflected through the silica beads. Those samples had a uniform streak of light amplified through most of the silica beads in solution. These images were taken out and the ones used in discussion are the ones containing Device 2 bound to silica beads. In the samples containing only cells with the Device 2 construct in them, and without silica beads present, not a significant amount of fluorescence was detected. A few cells appeared to have produced GFP, however that is only due to external cellular stress cause by various factors. See Menbrane Stress above.
Scannning Electron Microscopy
The gallery above contains images that were produced by the Scanning Electron Microscope (SEM) at the University of Leeds. Device 2 was incubated in solution of varying concentrations of an alkylsilane compound, which was solubilized using the sol-gel method from Tetraethoxysilane (TEOS). Samples were incubated at room temperature or at 45ºC. For the control samples, cells without the Device 2 construct gene were used, and did not react with the alkylsilane compound. The alkylsilane compound forming distinct spheres can be witnessed in one of the images. EDX chemical composition data is also included with each image, which allows assessment of the elements that are present in each sample. The high carbon output is partially due to the carbon adhesive used to isolate the samples for SEM. The alkylsilane compound would envelop the cells either fully or partially and this can be gathered from the images shown. The images of control samples exemplify the alkylsilane compound not extensively bound to the cells.
FACS Device 2 contains our INP+Si4 construct, along with the Cpx and GFP genes. It was characterized using a flow cytometry method called Fluorescence-activated cell sorting (FACS), in solution with and without beads. The FACS images contain Side scattering and Forward scattering information, relating to relative size and density of the cells. In the assay containing Device 2 with beads, there was an increase in the percentage of Population 3 (coloured in blue), from 0.1 to 2.2. This is suggestive of representing our Device 2 cells bound to silica beads. In contrast, the assay, which contained only Device 2 cells, had an insignificant percentage of Population 3 (0.1%). This suggests that our Device may successfully be binding to the silica beads, utilizing the INP+Si4 construct, however not in all cases. This could either be due to not having enough time for binding totake place, or that our Si4 binding domain is not as effective as it should be - due to either under expression, or a weak binding domain.
| ||||||
 |
| ||||||

| |||||||

| |||||||