Results
Glucose growth assay
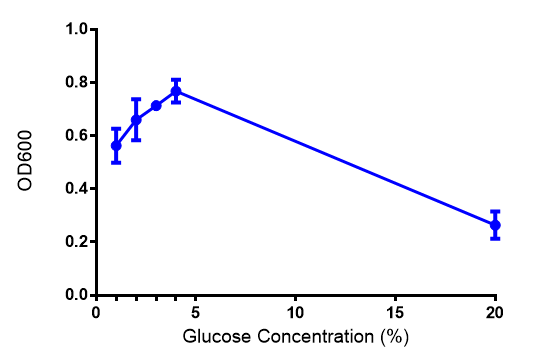
Cell growth of phaABC
E. coli at 4 concentrations of glucose. Optimum growth is at 2-4% glucose at 37ºC.
WCM growth assay
Originally we intended on using [http://parts.igem.org/Part:BBa_K639003 BBa_K639003] to detect whether our cells were stressed when placed in various toxic byproducts. However, as the data below shows, this biobrick is very leaky. As such, we are using the stress sensor as a marker for cell growth and also to show that the cells had been successfully transformed with the correct chloramphenicol resistance.
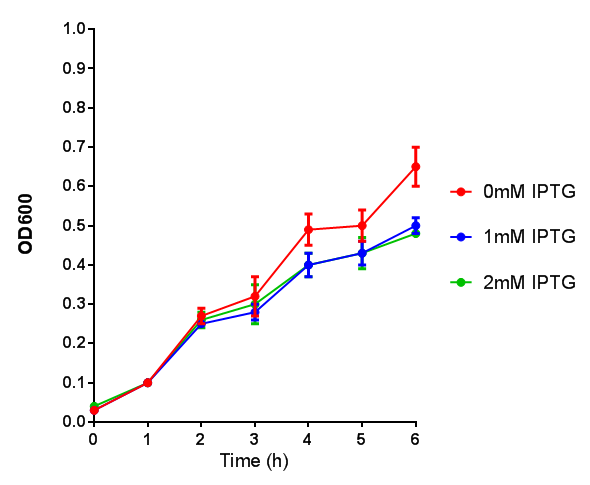 Cell growth over 6h with IPTG induction. mCherry production is induced by the stress pathway and detection of ppGpps. In order to bypass this, we induced with IPTG which inhibits LacI, resulting in mCherry expression. | 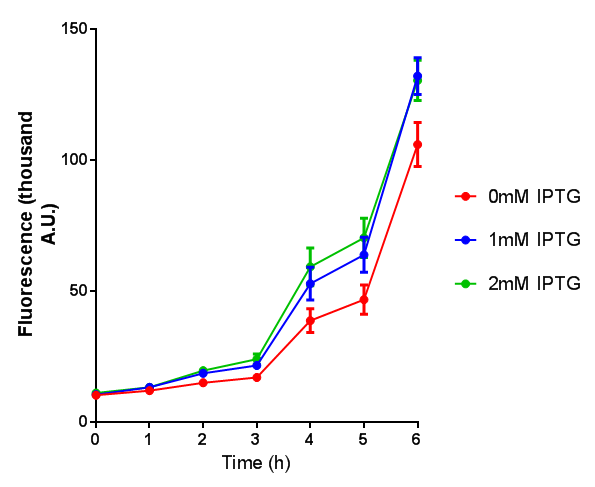 Fluorescence of the cells under IPTG induction over a 6h period. |
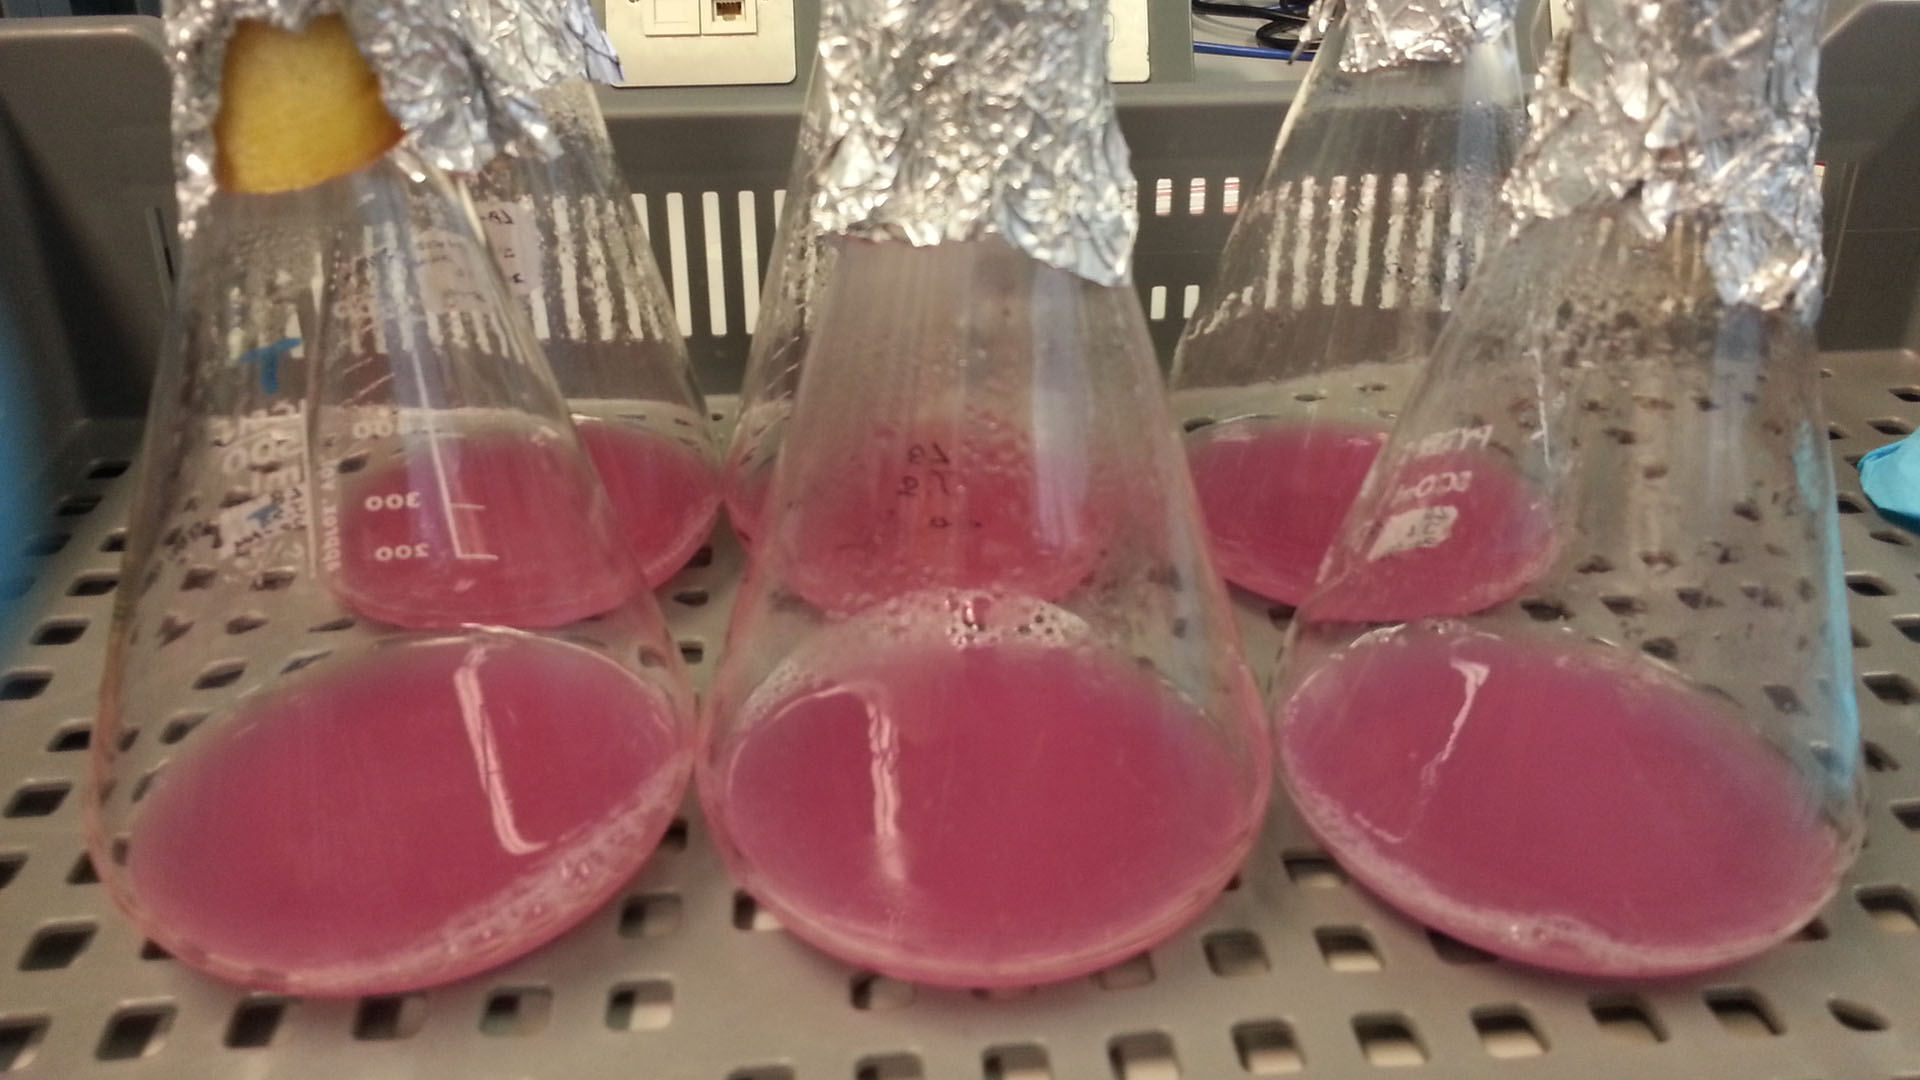 Production of the red pigment by stress induction. MG1655 were grown with LB media and sterile filtrated WCM for 48 hours. | 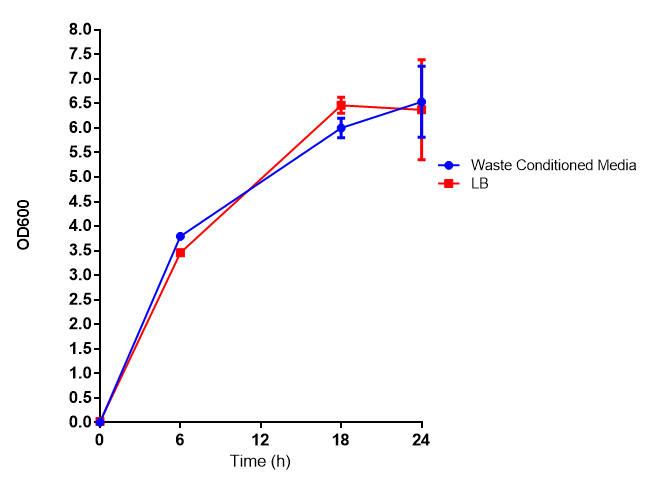 Growth curve of our [http://parts.igem.org/Part:BBa_K639003 mCherry] MG1655 bacteria. MG1655 were grown with LB media and sterile filtrated WCM at 37ºC |
Ethylene glycol growth assay
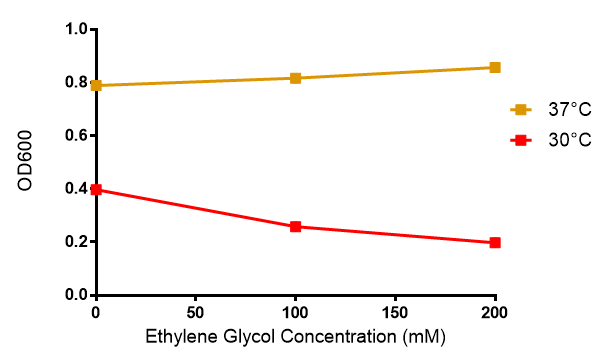
Cell growth of MG1655 in ethylene glycol, a byproduct of polyurethane degradation. Cells were grown in 0mM, 100mM or 200mM Ethylene Glycol at 30ºC.
red
green
blue
 "
"


