Data
Media characterisation
Growth assays with different experimental media
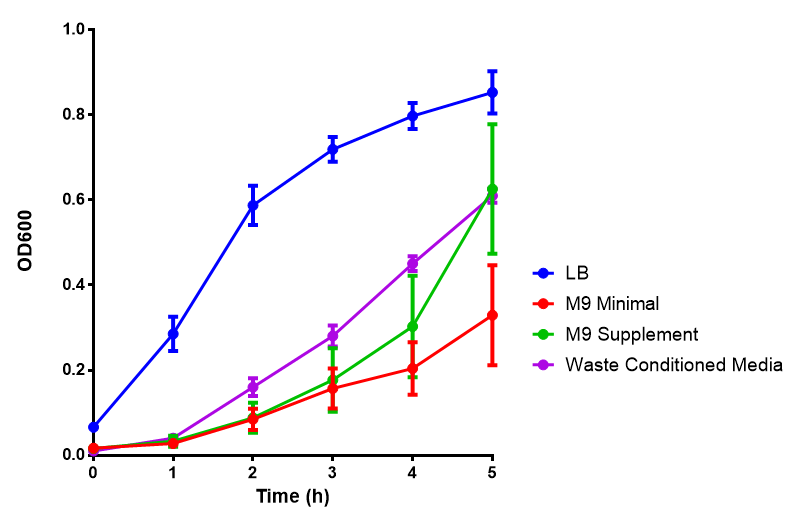 Figure 1: The medias used for our growth assays using the MG1655 strain. phaCAB is an operon involved in synthesis of P3HB while EV represents an empty vector. SR refers to stress response cells containing a red pigment. M9M is minimal media, while M9S is supplemented minimal media, as described here. WCM refers to waste conditioned media, which is made from sterile filtrated SRF waste, see here. Error bars are SEM, n=4. |
|
Waste Assays
These assays were designed to test whether our chassis could grow either directly with waste and/or in waste conditioned media. Waste conditioned media is a filter sterilised version of the waste media and was designed for several reasons; we were unsure whether mixed waste would be toxic to Ecoli and hence a less concentrated version may be more suitable and secondly large chunks of waste would prevent accurate OD600 measurements and therefore we decided to filter out the largest chunks.
Waste media
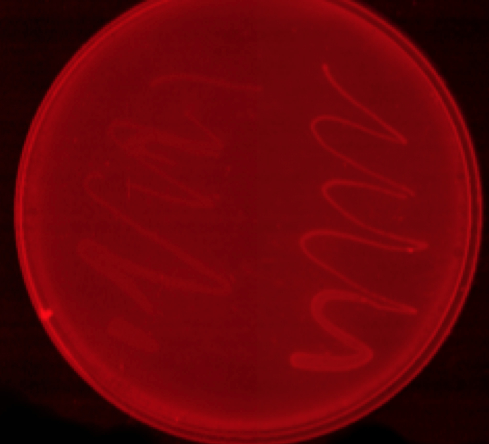
We can see from this experiment whether our bacteria can grow solely on the mixed waste.
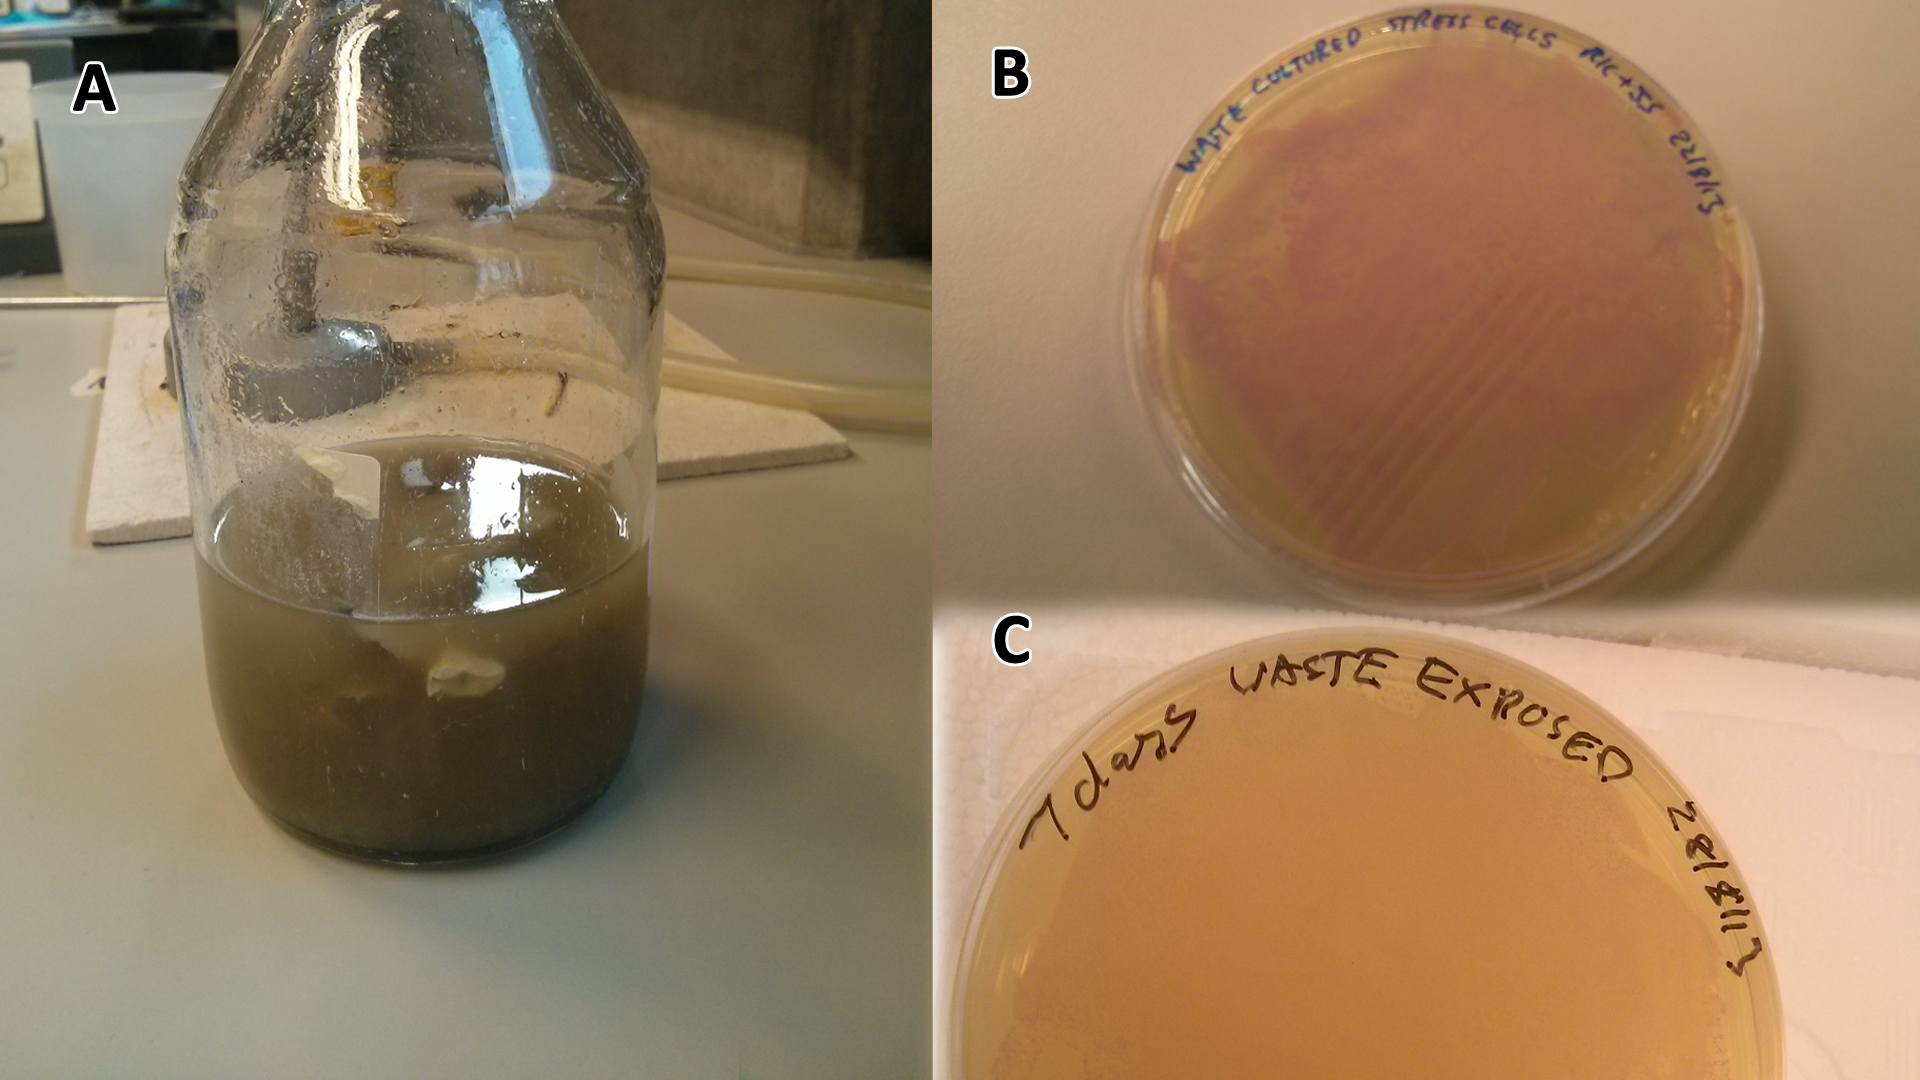 (A) Waste media (B) Ecoli containing mCherry stress biosensor (BBa_K639003) were grown in mixed waste (A) over 3 days, then streaked in a qualitative assay to check for growth. (C) mCherry stress biosensor (BBa_K639003) transformed Ecoli were streaked again after 7 days growth in SRF. | 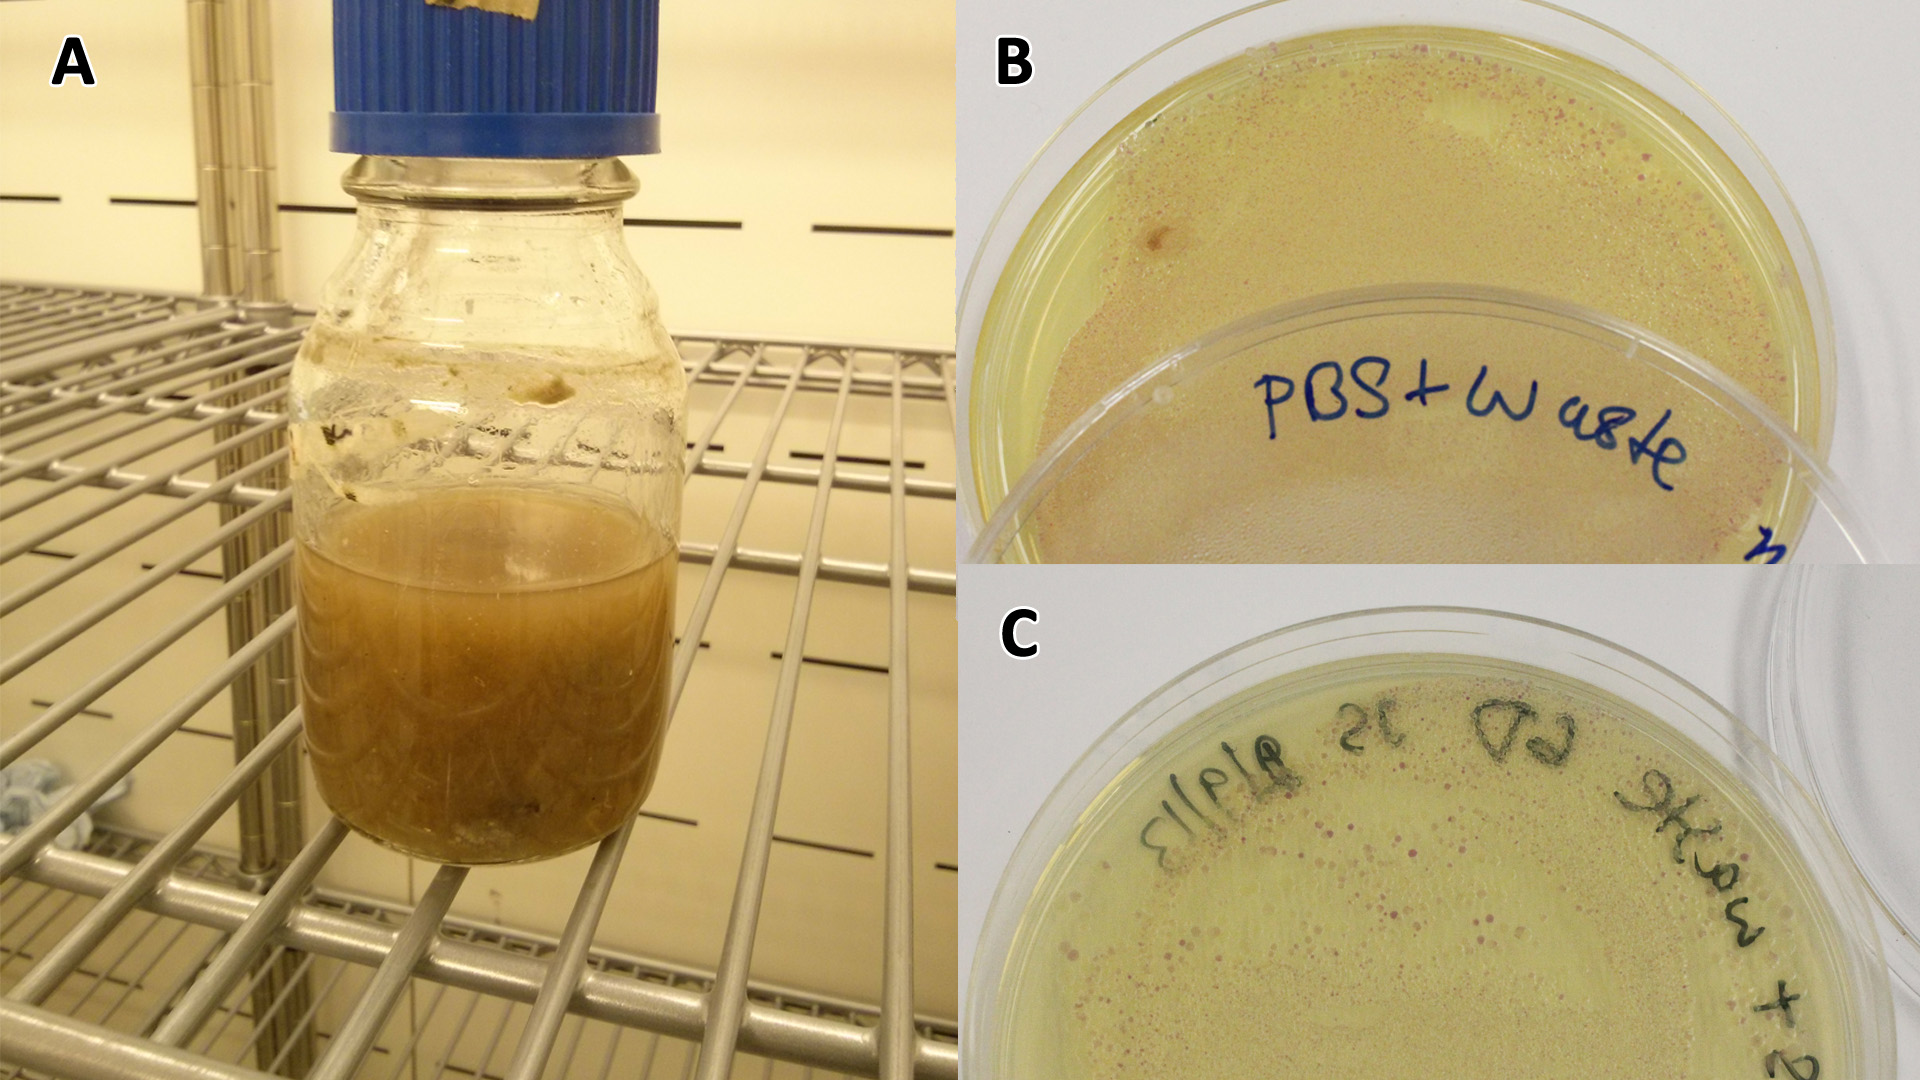 (A) waste media made up in PBS (phosphate buffered saline). (B) E coli expressing mCherry stress biosensor (BBa_K639003) grown in waste media (A) over 3 days, then streaked onto an antibiotic containing plate to qualitatively assess whether the E. coli had survived. (C) Streaked again after 6 days growth in SRF. |
Conclusion MG1655 can survive solely on mixed waste.
Waste conditioned media
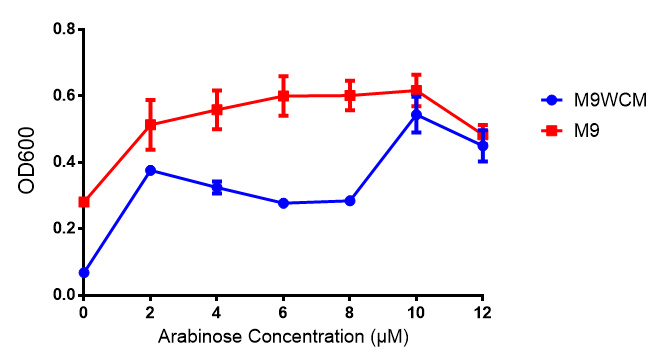
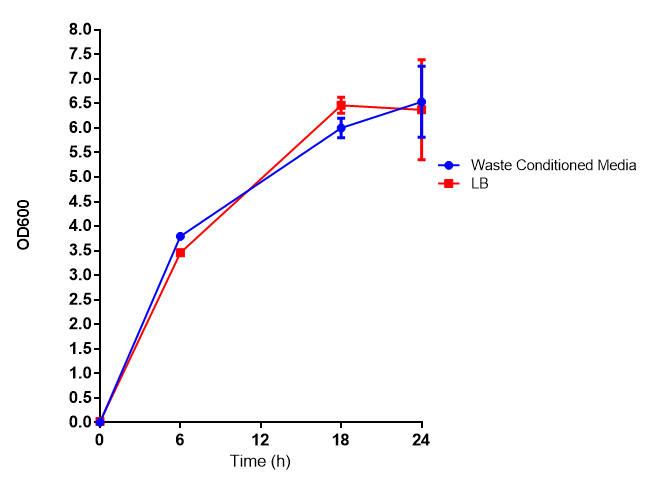 Growth curve of our [http://parts.igem.org/Part:BBa_K639003 mCherry] MG1655 bacteria. MG1655 were grown with LB media and sterile filtrated WCM at 37ºC. Error bars represents SE of the mean, n=4 | 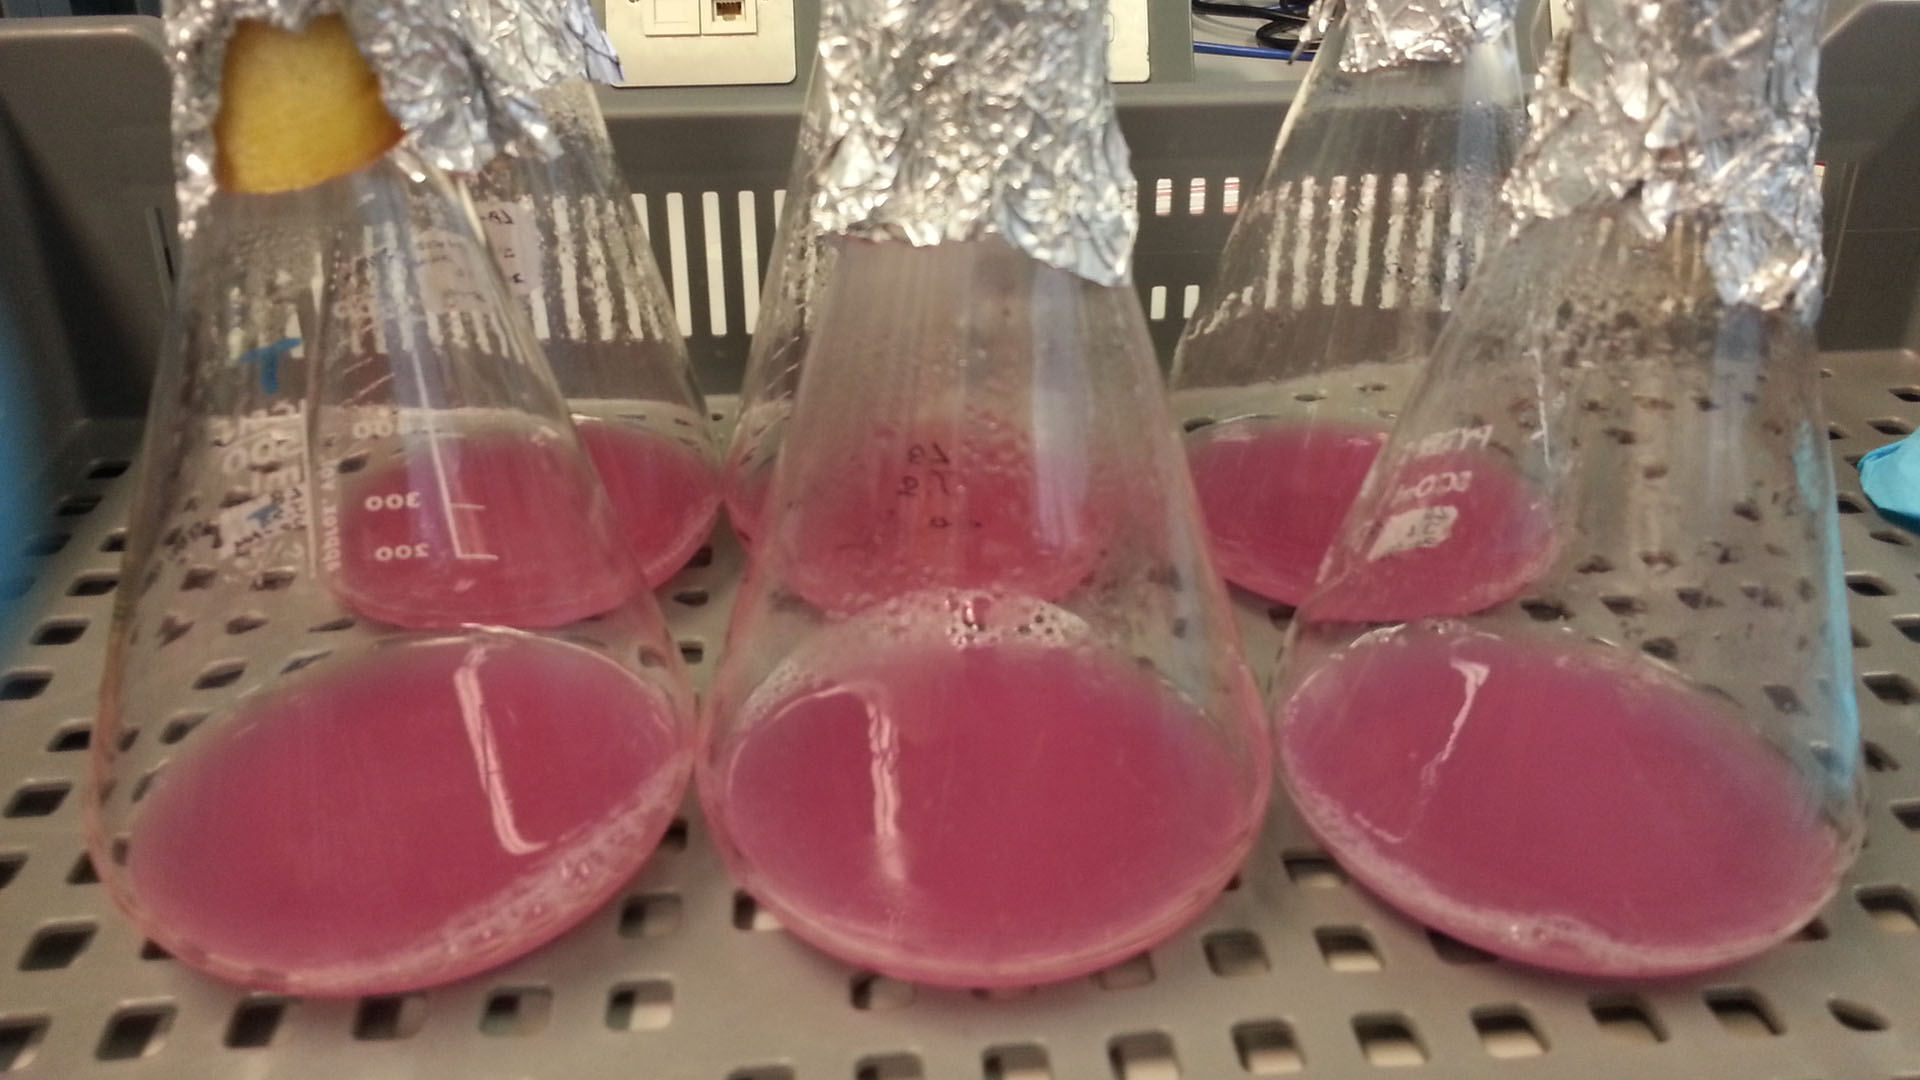 mCherry stress biosensor (BBa_K639003) transformed MG1655 were grown with LB-WCM for 48 hours. 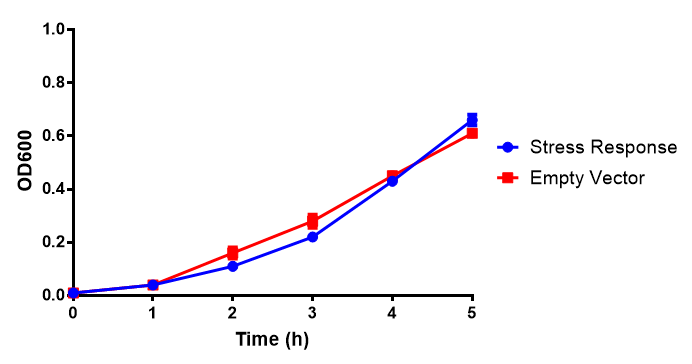 Figure 1: MG1655 in WCM with plasmids EV and SR. There is no growth inhibition when comparing the empty vector with the mCherry stress biosensor (BBa_K639003) vector in each media. WCM contains LB but trends in a simliar manner to M9S, suggesting that the chassis most likely due to toxins present within it from the mixed waste. Error bars are SEM, n=4. |
Characterisation of our Biobricks
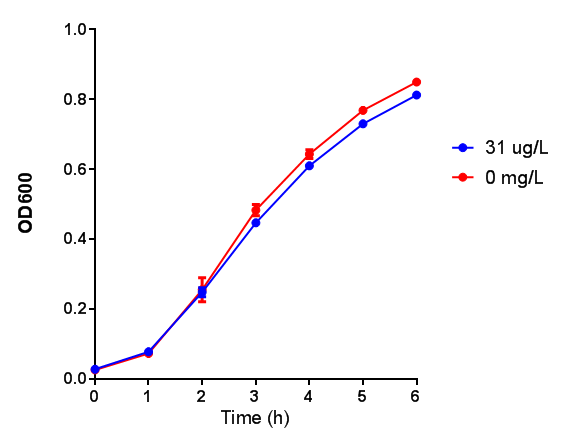
 Bdh2 induction to gauge growth effect. Error bars are SEM, n=4. |
|
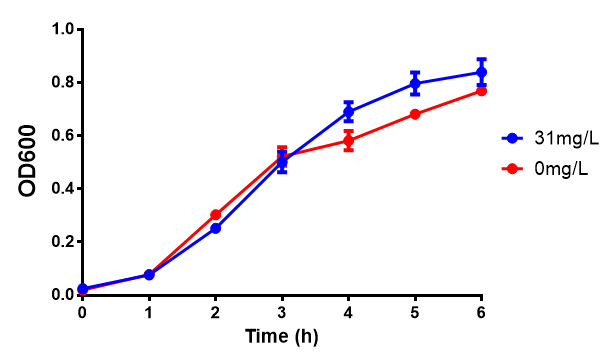
 CLE induction to gauge growth effect. Error bars are SEM, n=4. |
|
 PulA induction to gauge growth effect. Error bars are SEM, n=4. | 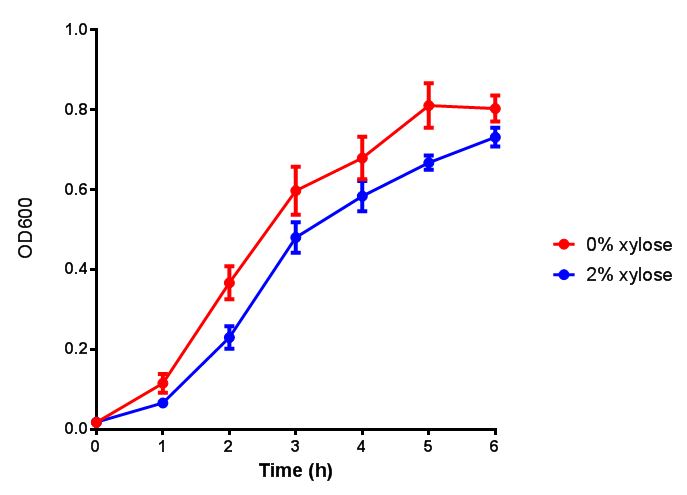 PueB induction to gauge growth effect. Error bars are SEM, n=4. |
Empty Vector Control
Characterisation of existing Biobricks
phaCAB biobrick characterisation
LB
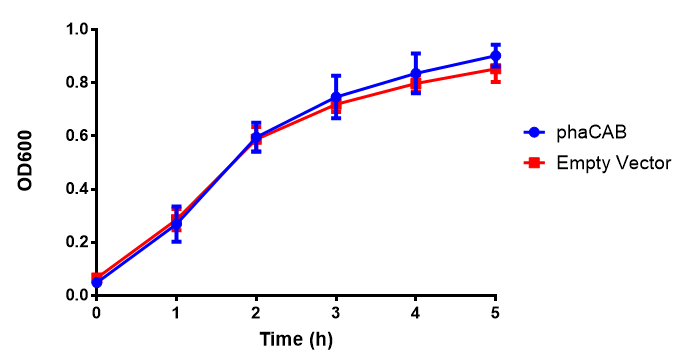
Figure 1: MG1655 in LB with plasmids EV and phaCAB. There is no growth inhibition when comparing the empty vector with the phaCAB vector in each media. LB shows the strongest growth curve with minimal latency. Error bars are SEM, n=4.
M9 Minimal
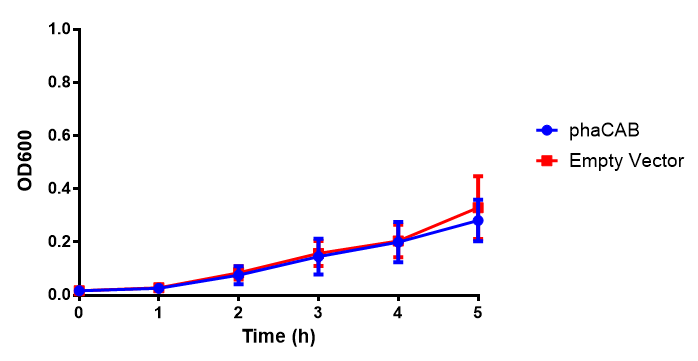
Figure 1: MG1655 in M9M with plasmids EV and phaCAB. There is no growth inhibition when comparing the empty vector with the phaCAB vector in each media. M9M shows the least growth growth of all the medias as it has low carbon and amino acid content. Error bars are SEM, n=4.
M9 Supplemented
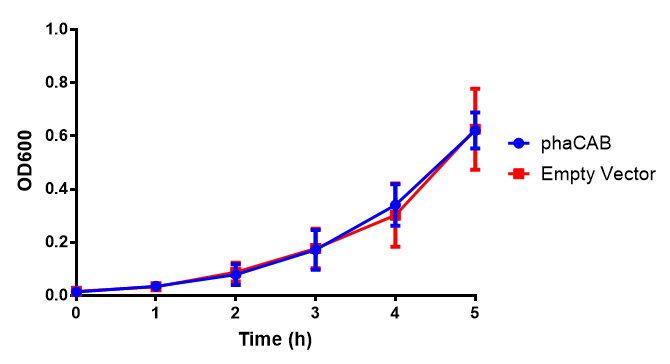
Figure 1: MG1655 in M9S with plasmids EV and phaCAB. There is no growth inhibition when comparing the empty vector with the phaCAB vector in each media. M9S shows a lag phase in growth but quickly increases due to increased amino acid content, nearly reaching LB after 5h. Error bars are SEM, n=4.
Stress biosensor characterisation BBa_K639003
IPTG induction assay
Originally we intended on using [http://parts.igem.org/Part:BBa_K639003 BBa_K639003] to detect whether our cells were stressed when placed in various toxic byproducts. However, as the data below shows, this biobrick is very leaky. As such, we are using the stress sensor as a marker for cell growth and also to show that the cells had been successfully transformed with the correct chloramphenicol resistance.
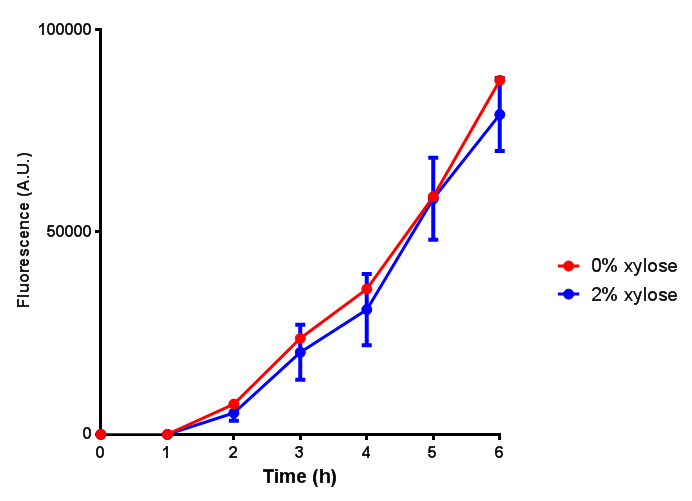
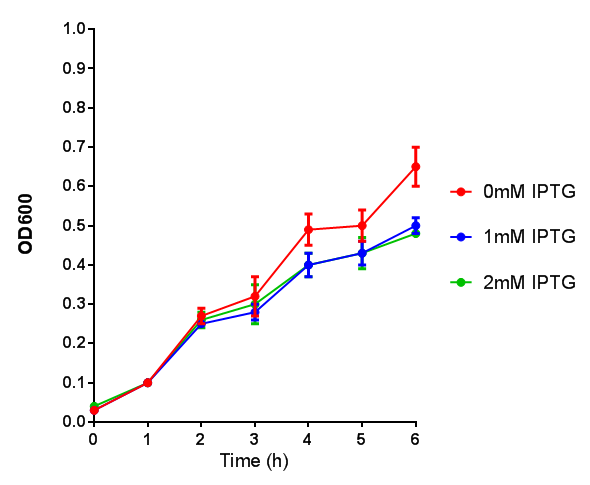 Cell growth over 6h with IPTG induction. mCherry production is induced by the stress pathway and detection of ppGpps. In order to bypass this, we induced with IPTG which inhibits LacI, resulting in mCherry expression. | 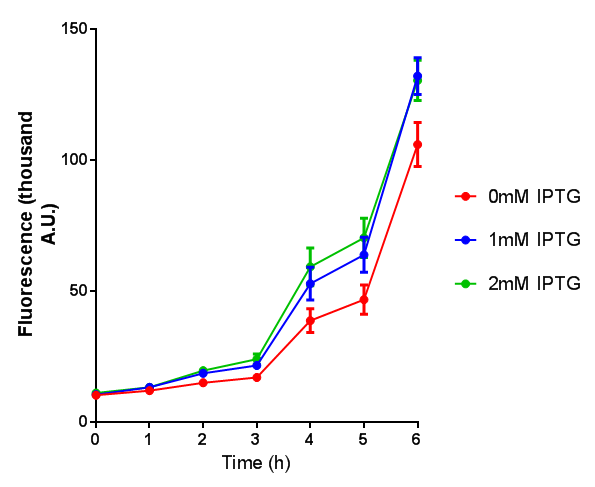 Fluorescence of the cells under IPTG induction over a 6h period. |
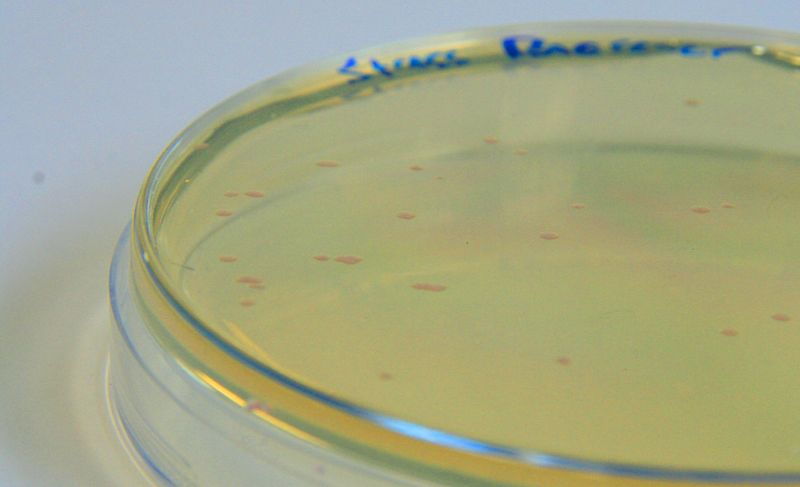
BBa_K639003 transformed into E coli. strain MG1655. Pink colonies are visible, which relate to 'leaky' RFP production
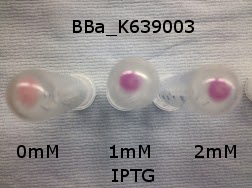
BBa_K639003 transformed into E coli. strain MG1655. Cells were grown at 37oC in 4ml LB with 0, 1 or 2mM IPTG. At 6 hours post IPTG induction, cells were spun down.
File:BBa K639003OD600.jpg Growth curve. BBa_K639003 transformed into E coli. strain MG1655. Cells were grown at 37oC in 4ml LB with 0, 1 or 2mM IPTG
File:BBa K639003FL.jpg FL. BBa_K639003 transformed into E coli. strain MG1655. Cells were grown at 37oC in 4ml LB with 0, 1 or 2mM IPTG
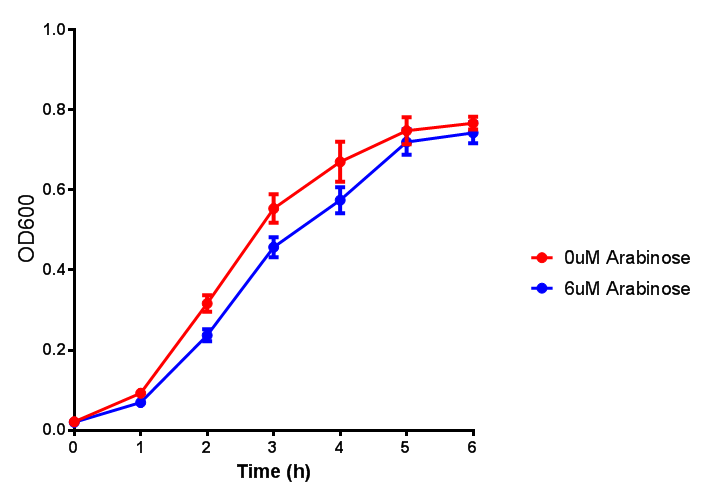
pBAD characterisation
 Cell growth over 6h with IPTG induction. mCherry production is induced by the stress pathway and detection of ppGpps. In order to bypass this, we induced with IPTG which inhibits LacI, resulting in mCherry expression. | 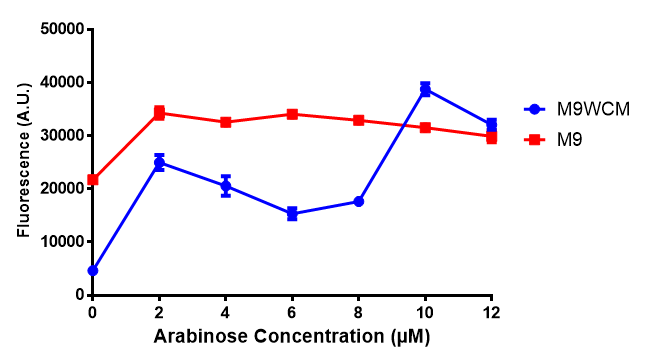 Fluorescence of the cells under IPTG induction over a 6h period. |
 Cell growth over 6h with IPTG induction. mCherry production is induced by the stress pathway and detection of ppGpps. In order to bypass this, we induced with IPTG which inhibits LacI, resulting in mCherry expression. | 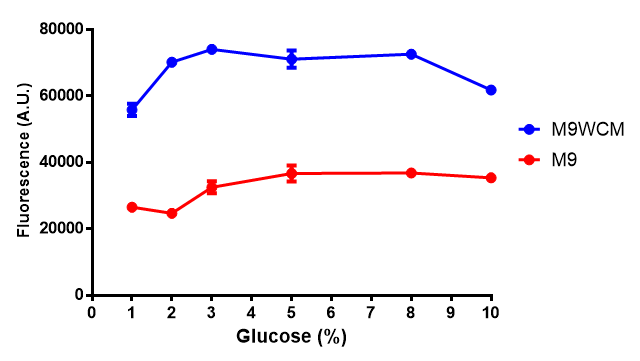 Fluorescence of the cells under IPTG induction over a 6h period. |
Glucose
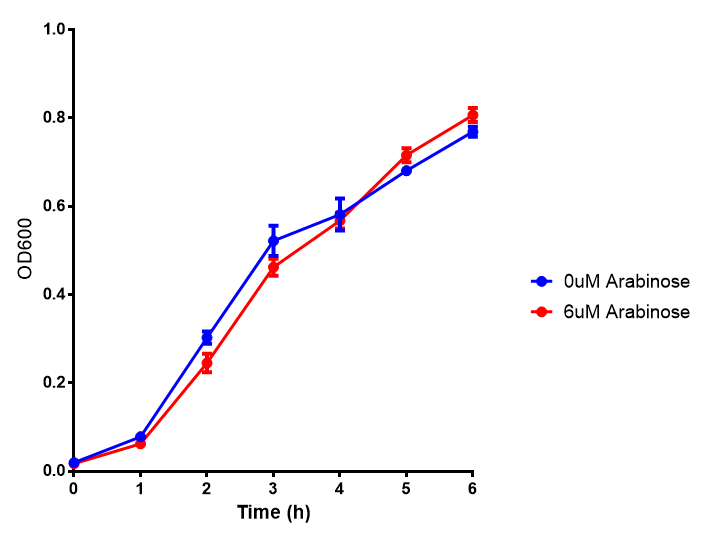
Cell growth of phaCAB
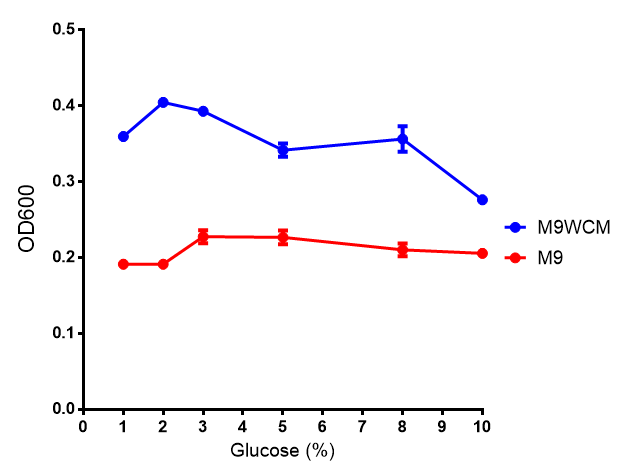
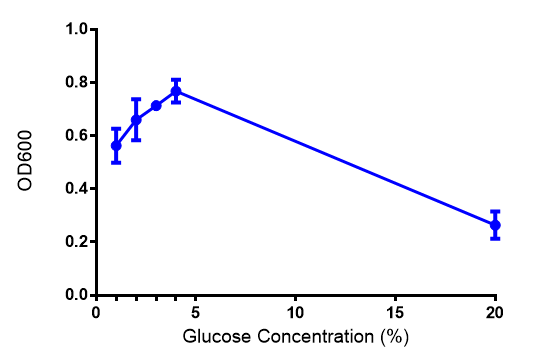
E. coli at 4 concentrations of glucose. Optimum growth is at 2-4% glucose at 37ºC. Error bars represents SE of the mean, n=4
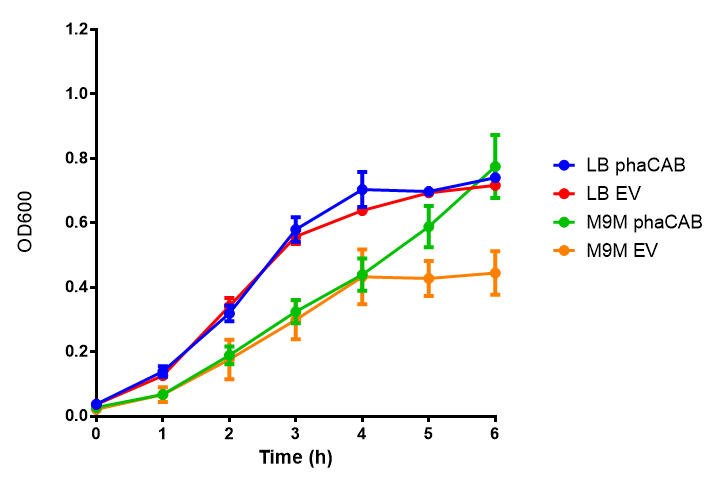 Cell growth over 6h in LB and M9M minimal media. LB grown MG1655 phaCAB grow more rapidly initially then M9M but reach the same OD after 6h while EV shows a different trend. EV in M9M levels off at a much lower OD at 4h, as seen with EV grown in LB. Error bars are SEM, n=4. | 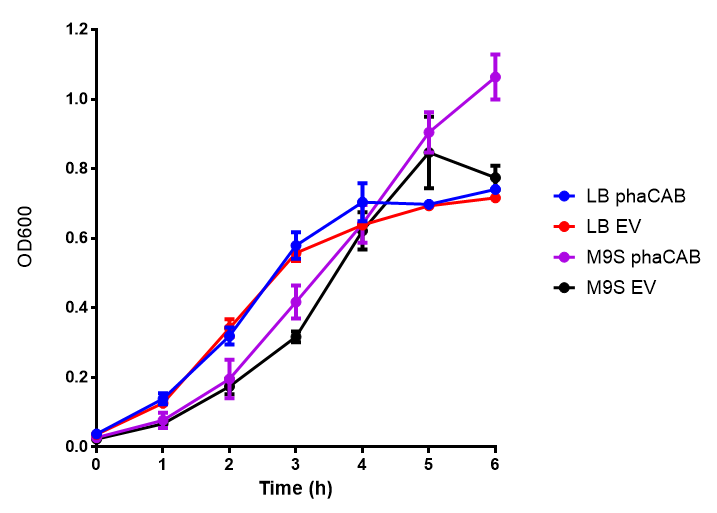 Cell growth over 6h in LB and M9S minimal media. LB grown MG1655 phaCAB grow more rapidly initially then M9S but after 5h, phaCAB in M9S continue to grow to a higher OD. EV shows a different trend, in M9S it levels off at a similar level to LB. Error bars are SEM, n=4. |
ANOVA analysis shows that...
Plastic Toxicity Assays
L-lactic Acid
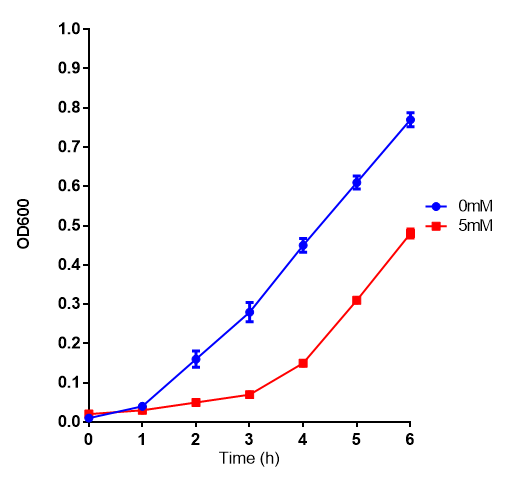
Cell growth of MG1655 on 5mM L-Lactic Acid. Error bars represents SE of the mean, n=4.
Ethylene glycol
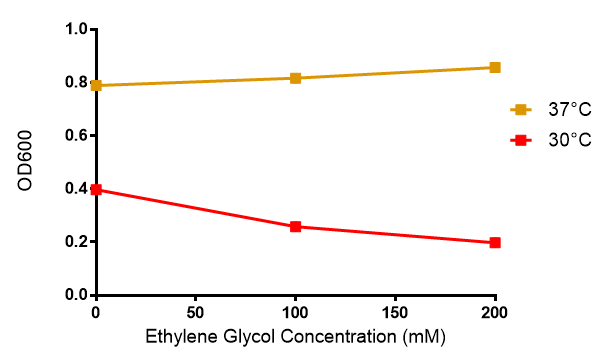
Cell growth of MG1655 in ethylene glycol, a byproduct of polyurethane degradation. Cells were grown in 0mM, 100mM or 200mM Ethylene Glycol at 30ºC. Error bars represents SE of the mean, n=4
Reduced growth at 30oC likely due to decreased efficiency of MG1655 ethylene glycol break down enzymes. These enzymes (see UC Davis 2012) are endogenously expressed and detoxify Ethylene Glycol.
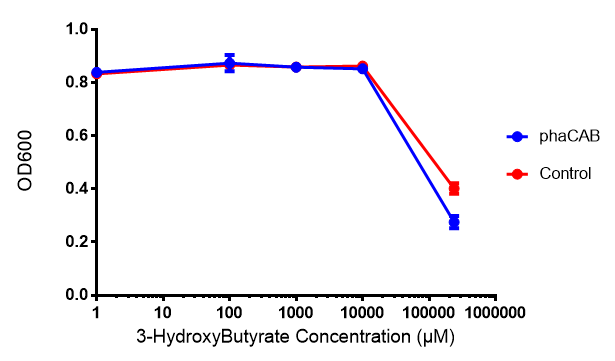
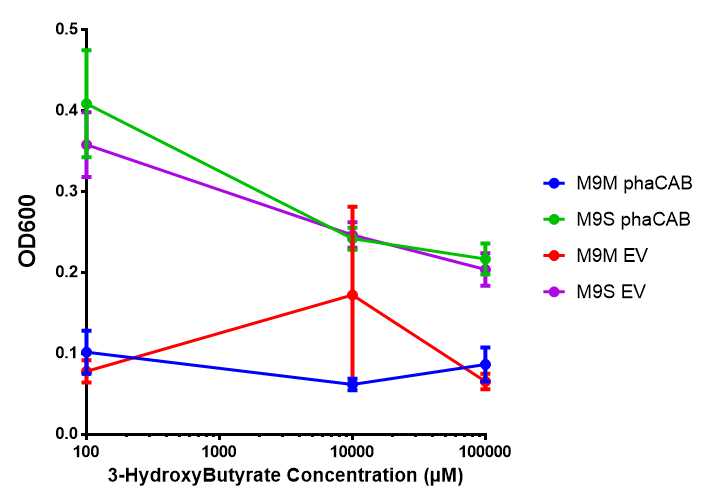
3-hydroxybutyrate (3HB)
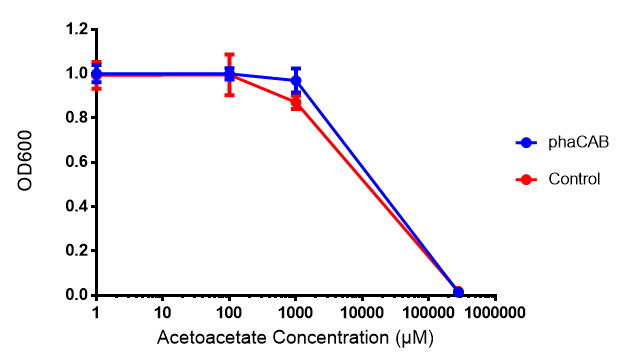
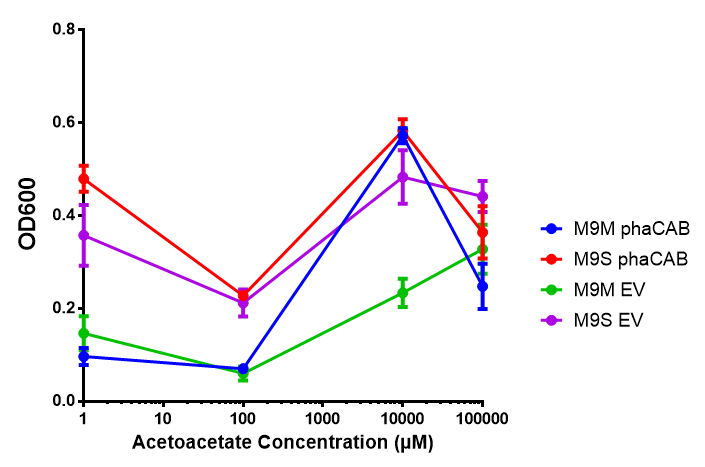
Acetoacetate
Poly(3-hydroxybutyrate) P(3HB)
Poly(lactic acid) (PLA)
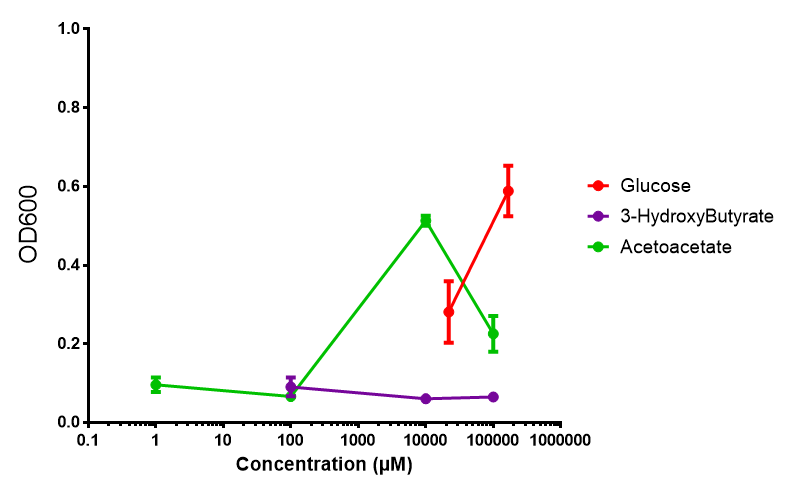
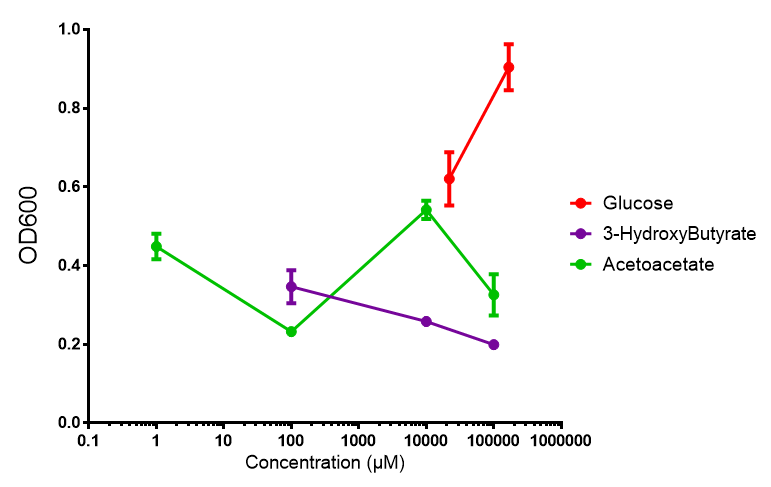
Sole carbon source
3HB
Acetoacetate
Western blots
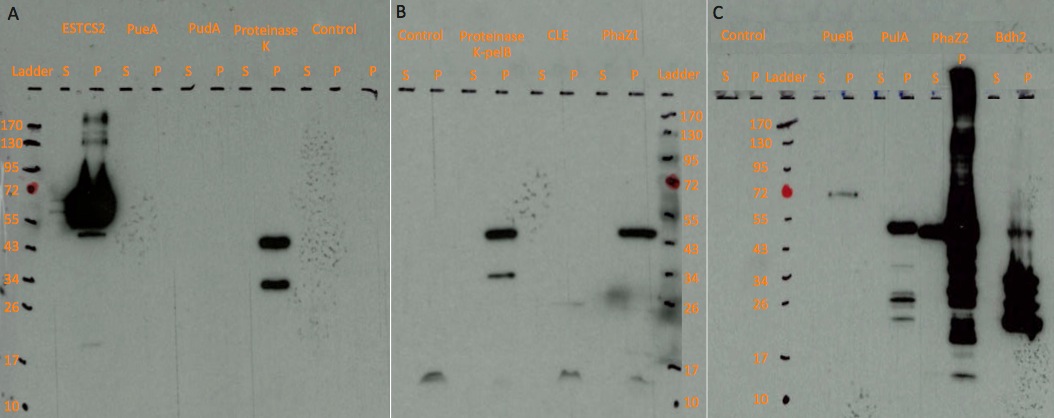
Figure: Western blot results on three chemiluminescent-compatible X-ray films. For each protein, we ran both lysed pellet(P) and supernatant(S) sample on gel, in order to test protein expression and secretion respectively.
Enzyme Kinetics
PHB production
Nile red staining
left control cells
right phaCAB transformed MG1655 O/N cutures of MG1655 transformed with either control or phaCAB plasmid were spread onto LB-agar plates with 3% glucose and Nile red staining. The staining indicates the production of P3HB.
Purification of P3HB
 P(3HB) purified from phaCAB transformed MG1655 that were grown in LB with 3% glucose | P(3HB) purified from phaCAB transformed MG1655 that were grown in LB with 3% glucose | 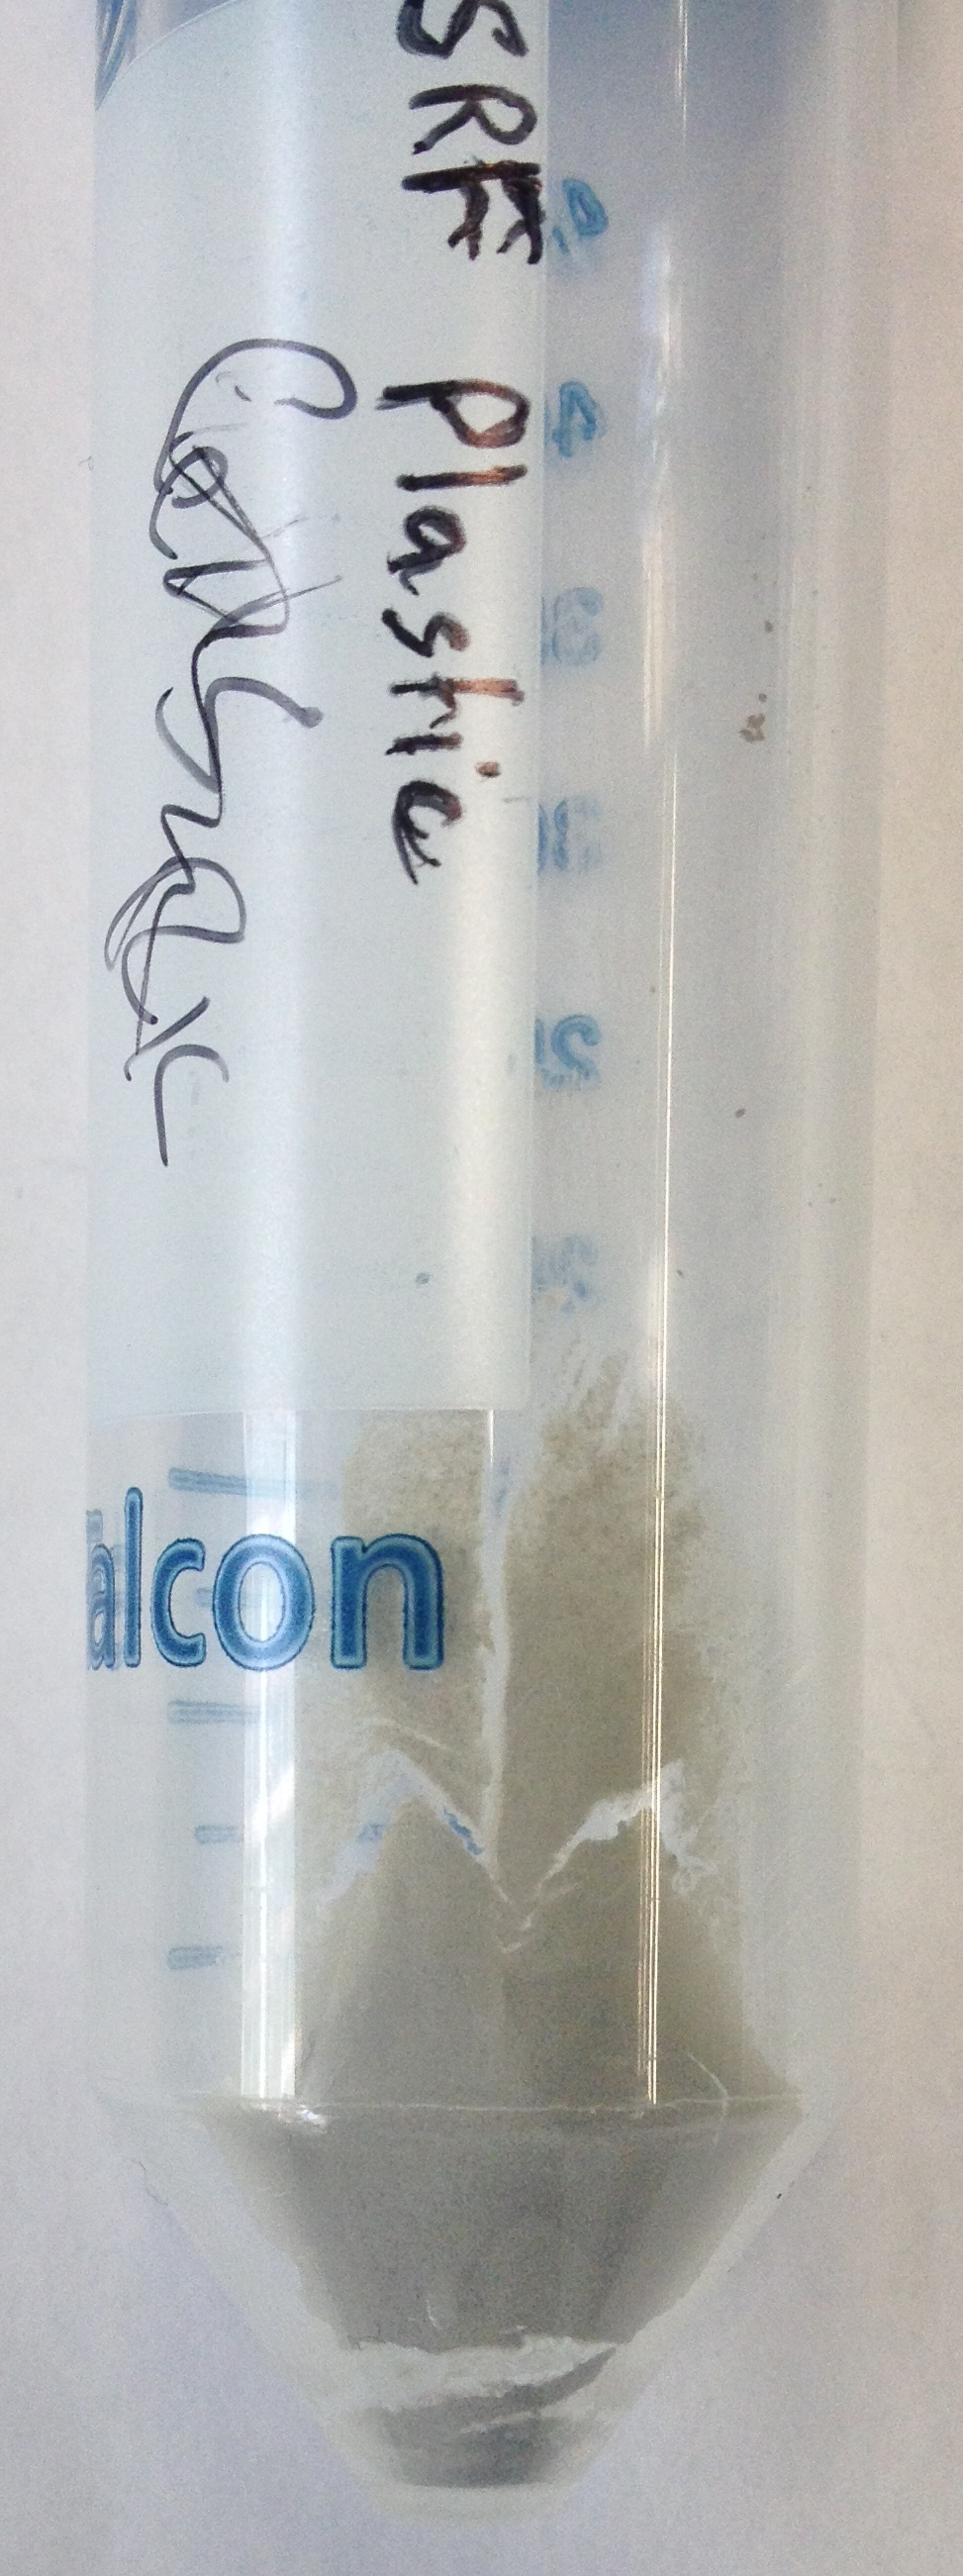 P(3HB) purified from phaCAB transformed MG1655 that were grown in M9M mixed waste. |
 "
"


