 "
"
Team:TU-Delft/BandAid
From 2013.igem.org
Band Aid
The Band Aid Modeling is related to the final application of our project. Specifically, we are going to use a band aid in which E. coli will be added. By locating the band aid on the wound, the S. aureus should be detected and killed (Figure 1).
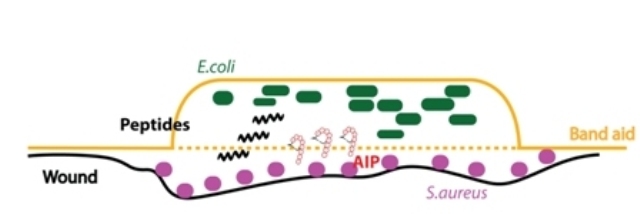
As, it is already known, S. aureus is a pathogenic bacterium that utilizes quorum sensing (QS), a cell-to-cell signalling mechanism, to enhance its ability to cause disease[1]. The communication is succeeded through small peptides known as AIPs. We engineered the receiver part of S. aureus to E. coli in order to be able for the last to detect AIPs produced by S. aureus.
The main purpose in the band aid modeling is to answer questions like these mentioned underneath:
- How many pores are necessary in order to be possible for the peptide to be released?
- If the MRSA is detected, is the amount of the produced peptide enough to kill it ?
Differential Equations
Our model consists of two Populations:- Sender: The S. aureus Population
- Receiver: The E. coli Population
For our model we made the following assumptions:
- The S. aureus population grows exponentially.
- The E. coli population is constant.
- The AIP concentration in both populations is modeled as homogeneous (perfectly mixed). This removes the need of a space model for the populations.
- The membrane assumed in 47mm diameter and 0.1μm pore size.
- No hydrophobic/hydrophilic interactions between membrane and the AIPs are taken into account.
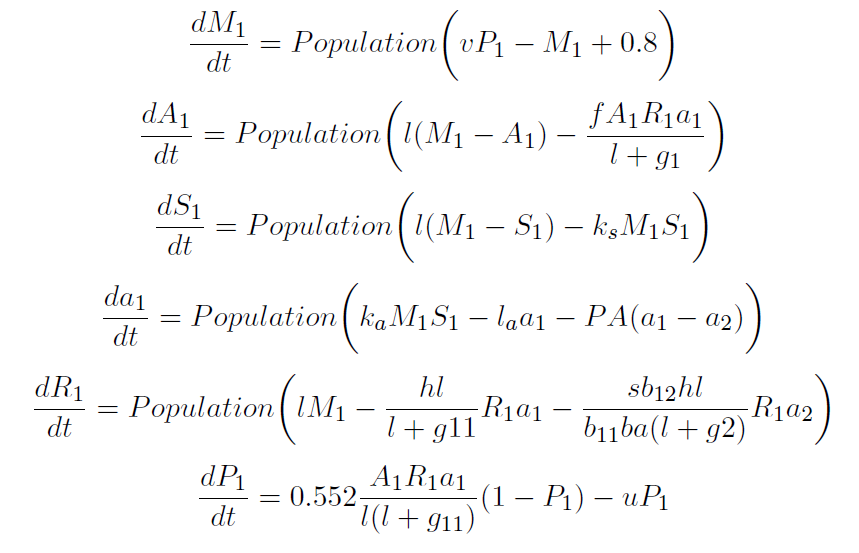
Sender: S. aureus Population

Figure 2:Sender [1]
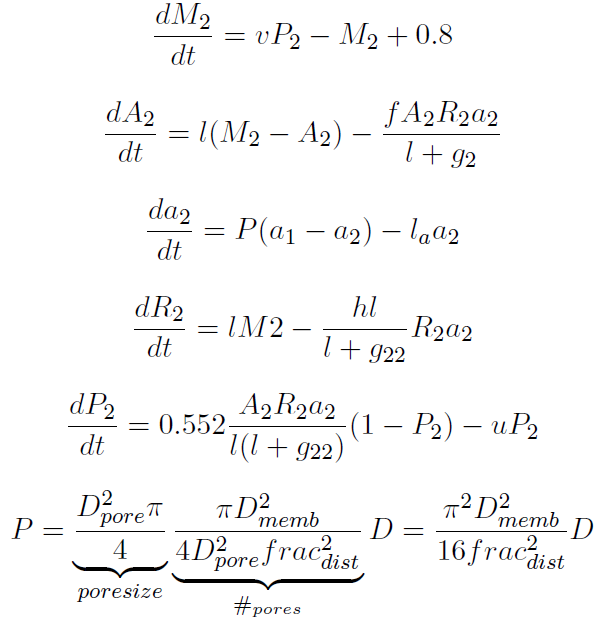
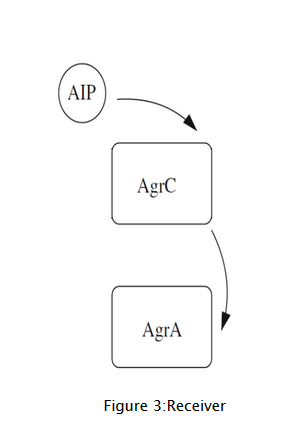
Receiver: E. coli Population
Note that in the above equation of the permeability the distance is expressed in the ratio of the pore sizes. For example the distance between pores can be 5 times the pore diameter.
Parameters
The references [1][2] used dimensionless variables and parameters. However, to be able to add equations to these models, units must be added. This is done by picking dimensionless values in or resulting from this model and use the known value with dimension to find out the used dimensions of the model.
In the model three units must be determined: the units of time and concentration. This is most easily done by plotting from the resulting model the AIPs over time. However, little is known on the typical concentration of AIPs and the time needed to reach these concentrations. Therefore, we used the quorum sensing system of gram negative bacteria (AHL molecules) as a reference and assume that the order of concentrations is the same for the AIP system.
From the model of [7] it is seen that a concentration of 120 nm is representative in a growth from 1 cell to 1 OD in 100 hours. This final concentration is reached in 45 hours. These two data are used to fit to dimension to the model. These are shown in the table below.
To estimate the growth parameters, we set the K to 1, since the capacity is equal to one OD. The growth rate is set in such a manner to fit the doubling time of S. aureus, 60 minutes [8].| Parameter | Value | Description | Units |
| s | 0.02 | Ratio of basal to QS transcription | - |
| v | 0.05 | mRNA transcription rate | sec-1 |
| l | 1 | protein degradation | sec-1 |
| f | 1 | agrA activation | nM-2sec-2 |
| g1 | 1 | unbinding AIP from AgrC | sec-1 |
| ks | 0.08 | AgrD loss through AIP production | nM-1sec-1 |
| ka | 80 | AIP production | nM-2sec-2 |
| la | 1 | Natural AIP degradation | sec-1 |
| h | 0.08 | receptor loss through AIP binding | nM-1sec-1 |
| gij | 1 | AIP from Population i unbinding from Population j | sec-1 |
| bij | 1 | AIP binding from Population i to Population j | - |
| ba | 1 | Ratio of cognate AIP binding in Population 2 to Population 1 | - |
| u | 1 | Diassociation active AgrA from the DNA binding site | sec-1 |
| r | 3.6*10-4 | growth rate | sec-1 |
| K | 1 | capacity | - |
| D | 8*10-4 | diffusion coefficient | μm2sec-1 |
| Dmembrane | 47*103 | membrane diameter size | μm |
Variables
The following variables were used in the equations:| Variable | Description | Unit |
| Mi | mRna concentration in Population i | nM |
| Ai | agrA concentration in Population i | nM |
| Si | agrD concentration in Population i | nM |
| ai | AIP concentration in Population i | nM |
| Ri | agrC concentration in Population i | nM |
| Pi | Proportion of cells that are upregulated in S. aureus population | - |
| Population | Population size of S. aureus | OD |
Results
For different fractional distances (fracdist) the model is simulated. It is observed that this fraction must become exteremely large before the membrane becomes a barrier. This becomes clear from Figure 1, where the concentrations are plotted for a fraction of 500. This means that the distance between the pores is 500 times larger than the pore size, which corresponds to 50 μm. For this fraction the concentration over the two populations becomes unequal, for lower fractions they are almost equal. For completeness the growth of S. aureus is also plotted in Figure 2. Starting from only 1 cell, it reaches 1 OD in about 6 hours and 30 minutes.
Figure 1: The AIP concentration for the S. aureus (blue) and E. coli (red) population
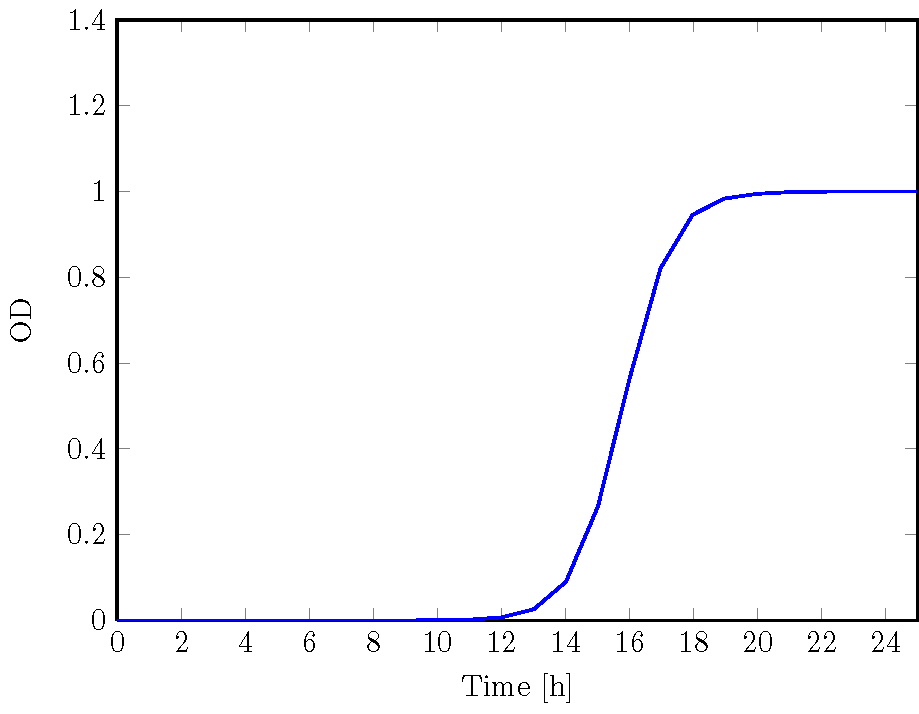
Figure 2: The growth of the S. aureus population
Peptide production model
Instead of a complex model a simple calculation is done using the modeling results of the combined system. From this model the total amount of peptides produced is estimated to be 18,000 molecules/cell. If we now calculate this to a concentration in the medium of the E. coli, we can relate this concentration to the determined MIC values. In this manner we do not directly calculate the effect of the volume of the population of S. aureus or losing peptides or the growth of S. aureus. It is therefore an optimistic estimation, which is done in Figure 3.
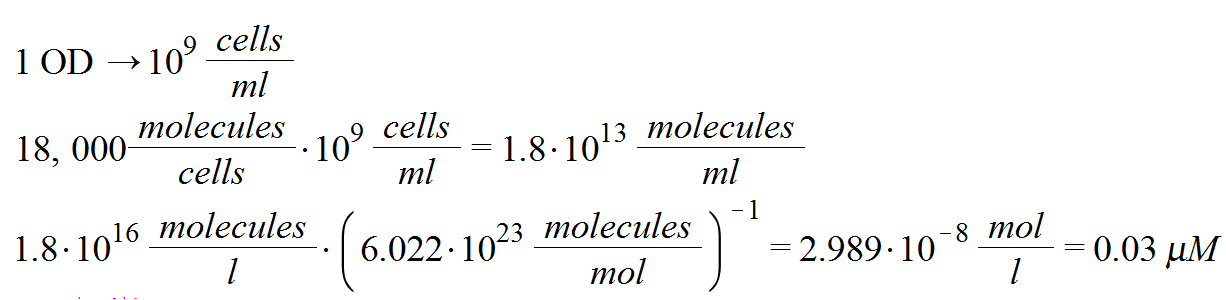
Figure 3: Calculation of the amount of concentration of peptides
Conclusion/Discussion
With these results we can give answer to the questions stated above:
- How many pores are necessary in order to be possible for the peptide to be released?
From the results it shows that the amount of pores on the membrane is not the determining parameter. Having the distance between the pores at 500 times the pore size, the concentration of AIPs at the E. coli population becomes significantly lower than the concentration in the S. aureus population. This is a high number, most membranes are much higher packed (having a lower fracdist). Thus, we conclude that the diffusion will not be hindered by the amount of pores on available membranes in this application.
- If the MRSA is detected, is the amount of the produced peptide enough to kill it ?
The result is that in 1 OD 0.03μM (30 nM) of peptide can be produced. This is too low, since signiferin has an MIC of 1μM. This would mean that in our current circuit we would need to have 33 OD, or to be exact 33*109 cells/ml. This is however not feasible and therefore a major hurdle to implement the system in a Band-aid.
One of the solutions to this is to design new antimicrobial peptides. We showed that we could alter the properties to our needs, i.e. making the peptides less toxic to humans. In the same manner you can also work on making the MIC value lower. This way having an MIC in the range of nanomolars is not infeasible. Furthermore, from the sensitivity analysis it shows that the concentration can be increased by slowing down the timer. This way the final concentration of the peptide can be increased.