Team:TU-Delft/FinalApplication
From 2013.igem.org

BandAid Application
The Band Aid is related to the final application of our project. Specifically, the idea is to use a band aid in which E. coli will be present. After placing the band aid on the wound, S.aureus will be detected, the peptide will, after production, diffuse through the band aid targeting the infection. Diffusion of the AIP and the AMP have been shown in the membrane experiment.

Figure 1: Band aid
Experiments
Aim
To check if it is feasible for both the peptides and the AIPs to pass through the selected membranes (Cellulose Nitrate Membrane and PTFE Membrane).Procedure:
- Dissolve the peptides. Signiferin was dissolved in water, in order to dissolve maximim 1M of ammonium bicarbonate was added in order to gain an end concentration of 5mM.
- The peptide solutions were measured, using the nanodrop, and we determined the absorbance to be 0.51 and 0.74 respectively. Using absorbance A= εcL=εc when L = 1cm [1], [2] the concentration was measured to be 0.34μM for Maximim and 0.49μM for Signiferin. The AIPs solutions were measured, using the nanodrop, and we determined the absorbance to be 2.56. The concentration was measured to be 1.64μM.
- In order to make diffusion measurable, we folded the membrane like a filter paper and placed it in the peptide solution.
- The diffusion was measured from the upper part of the membrane in different time points.
- The peptides cannot pass through the PTFE membrane which is hydrophobic(Table 2).
- Both the peptides are successfully passing through the Cellulose Nitrate Membrane(Table 1).
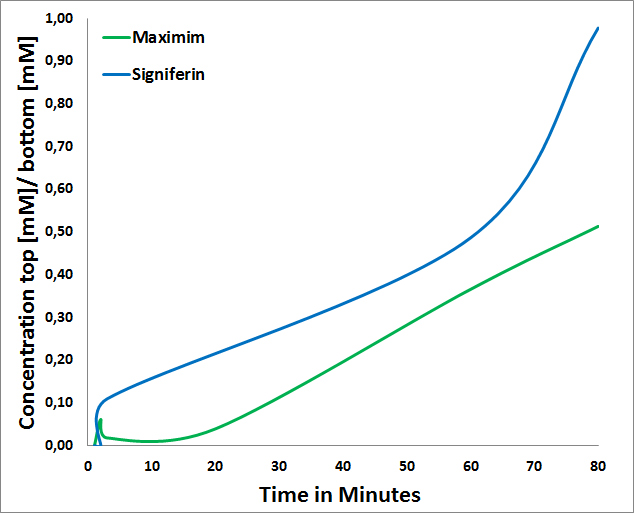
- Signiferin passes through the Cellulose Nitrate Membrane in a higher concentration than Maximim (Figure 2). The slow diffusion of Maximim is probably based on the fact that Maximim has a negative charge of -3 whereas Signiferin a positive charged of 2.[3]
- The AIPs pass through the Cellulose Nitrate Membrane in a slower rate that the peptides but in a concentration which is more than enough for the E.coli to detect the existence of S. aureus. (Table 3, Figure 3)
- AIPs are not passing through the PTFE membrane due to its hydrophobic nature(Table 4).
-
Pierce Biotechnology: Extinction Coefficients, A guide to understanding extinction coefficients, with emphasis on spectrophotometric determination of protein concentration.[Online]. Available From: http://classes.soe.ucsc.edu/bme220l/Spring11/Reading/Extinction-coefficients.pdf
C. N. Pace, F. Vajdos, L. Fee, G. Grimsley, and T. Gray,"How to measure and predict the molar absorption coefficient of a protein.", Protein Sci. 1995 November; 4(11): 2411–2423.
Peptide Calculator[Online]. Available From https://www.genscript.com/ssl-bin/site2/peptide_calculation.cgi
| minutes | Absorbance(Maximim) | Absorbance(Signiferin) | Concentration in mM Maximim | Concentration in mM Signiferin |
| ∅ | 0.51 | 0.74 | 0.34 | 0.49 |
| 1 | 0 | 0 | 0 | 0 |
| 2 | 0.03 | 0 | 0.02 | 0 |
| 3 | 0.01 | 0.08 | 0.006 | 0.05 |
| 20 | 0.02 | _ | 0.013 | - |
| 60 | 0.16 | 0.27 | 0.1 | 0.18 |
| 80 | 0.2 | 0.44 | 0.13 | 0.29 |
Table 2: PTFE Membrane, 0.1μm pore size, peptide testing
| minutes | Absorbance(Maximim) | Absorbance(Signiferin) | Concentration in mM Maximim | Concentration in mM Signiferin |
| ∅ | 0.51 | 0.74 | 0.34 | 0.49 |
| 1 | 0.02 | 0 | 0.002 | 0 |
| 2 | 0.07 | 0.001 | 0.005 | 0.001 |
| 3 | 0.01 | 0.007 | 0.001 | 0.005 |
| 20 | 0.01 | 0.016 | 0.008 | 0.011 |
| 60 | 0.016 | 0.01 | 0.011 | 0.007 |
| 80 | 0.01 | 0.014 | 0.008 | 0.01 |
Table 3: Cellulose Nitrate Membrane, 0.1μm pore size, AIPs testing
| minutes | Absorbance(AIP) | Concentration in mM AIP |
| ∅ | 2.56 | 1.64 |
| 1 | 0.04 | 0.02 |
| 5 | 0.02 | 0.01 |
| 10 | 0.23 | 0.14 |
| 15 | 0.20 | 0.12 |
| 30 | 0.25 | 0.16 |
| 60 | 0.28 | 0.18 |
| 65 | 0.32 | 0.2 |
| 75 | 0.37 | 0.23 |
| 105 | 0.41 | 0.26 |
| 135 | 0.45 | 0.28 |
| 175 | 0.48 | 0.30 |
| 200 | 0.53 | 0.34 |
| 250 | 0.81 | 0.52 |
Table 4: PTFE Membrane, 0.1μm pore size, AIPs testing
| minutes | Absorbance(AIP) | Concentration in mM AIP |
| ∅ | 2.56 | 1.64 |
| 1 | -0.01 | -0.02 |
| 5 | 0.02 | 0.01 |
| 10 | 0.04 | 0.02 |
| 15 | 0.02 | 0.01 |
| 30 | 0.06 | 0.03 |
| 60 | 0.02 | 0.01 |
| 65 | 0.04 | 0.02 |
| 75 | 0.04 | 0.02 |
| 105 | 0.04 | 0.02 |
| 135 | 0.05 | 0.03 |
| 175 | 0.03 | 0.01 |
| 200 | 0.08 | 0.05 |
| 250 | 0.06 | 0.03 |
Graphs
PTFE membrane results are approximately zero and therefore are not plotted.

Figure 2:Maximin and Signiferin ratio passing through Cellulose Nitrate membrane

Figure 3:AIPs ratio passing through Cellulose Nitrate membrane
Conclusions
The conclusions derived by the experiments are listed below:
All these facts make the cellulose nitrate membrane to be a proper membrane for our application in contrast to the PTFE membrane which does not allow the peptides to pass through due to its hydrophobic nature.The time that the peptide needs to pass through the membrane is reasonable for a real application. It is possible to reduce the time needed by increasing the pore size of the membrane. However, it was decided not to do this in order to be impossible for the E.coli to escape from the membrane and infect the patient.
 "
"
